ROC Curve
| Tab | Description |
|---|---|
| Performance | Helps in exploring classification, performance, and statistics related to a selected model at any point on the probability scale. |
For classification experiments, the ROC Curve tab provides the following tools:
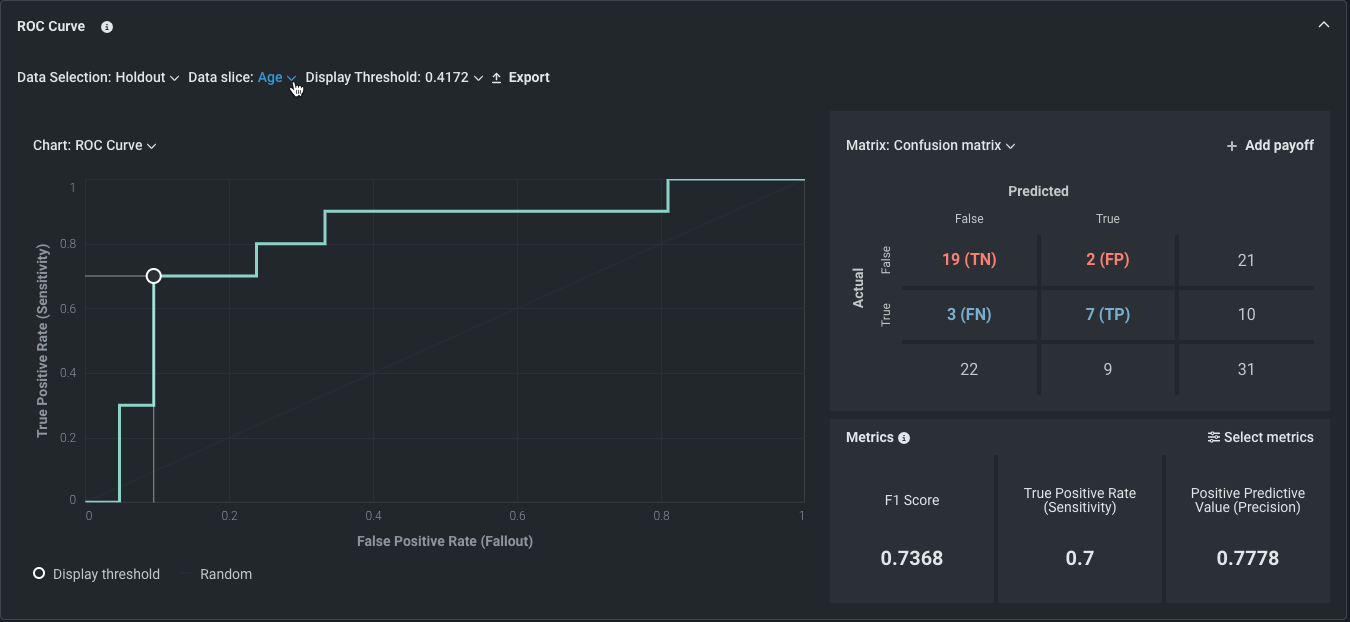
Next steps
Continue evaluating your classification model with these related insights.
- Confusion Matrix: Evaluate model performance for multiclass experiments using a confusion matrix.
- Lift Chart: See how well the model segments the target population and ranks predictions from low to high.
- Metric Scores: Review the model's performance across all supported metrics.