Series Insights
| Tab | Description |
|---|---|
| Performance | Provides series-specific information in both charted and tabular format. Multiseries only |
Series Insights provides series-specific information regarding distribution and metrics scores for selected backtests and bin sizes.
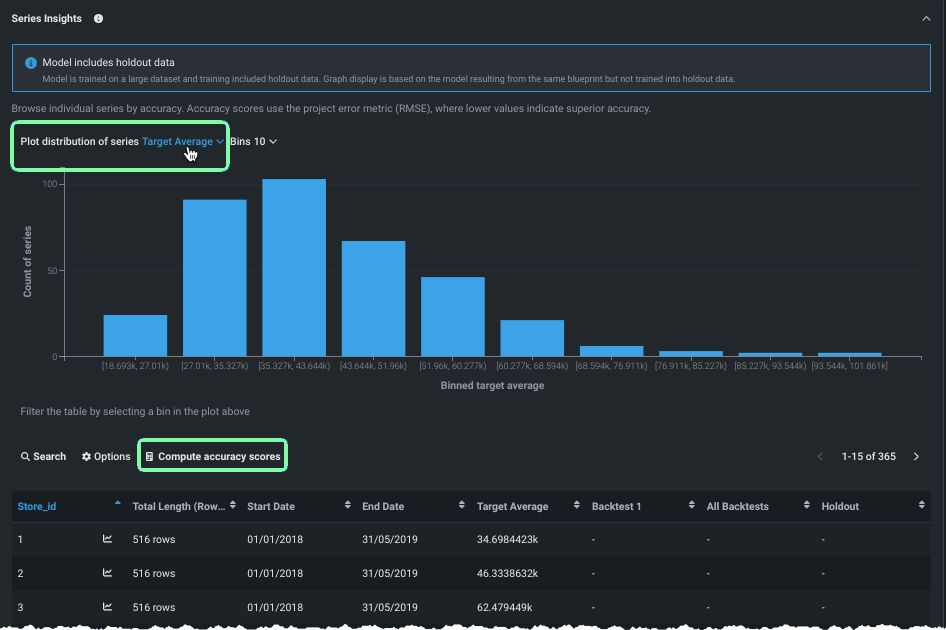
To speed processing, Series Insights visualizations are initially computed for the first 1000 series (sorted by ID). You can, however, Compute accuracy scores for the remaining series data. Use the Plot distribution controls and binning to change the display.
Next steps
Continue evaluating your time-aware model with these related insights.
- Forecasting Accuracy: See a visual indicator of how well the model predicts at each forecast distance.
- Forecast vs Actual: Compare how different predictions behave from different forecast points to different times in the future.
- Accuracy Over Time: Visualize how prediction accuracy changes over time.