Neural Network Visualizer
| Tab | Description |
|---|---|
| Details | Provides a visual breakdown of each layer in the model's neural network. |
The Neural Network Visualizer illustrates the order of, and connections between, layers for each layer in a model's neural network. It helps to understand if the network layers are connected in the expected order in that it describes the order of connections and the input and outputs for each layer in the network.
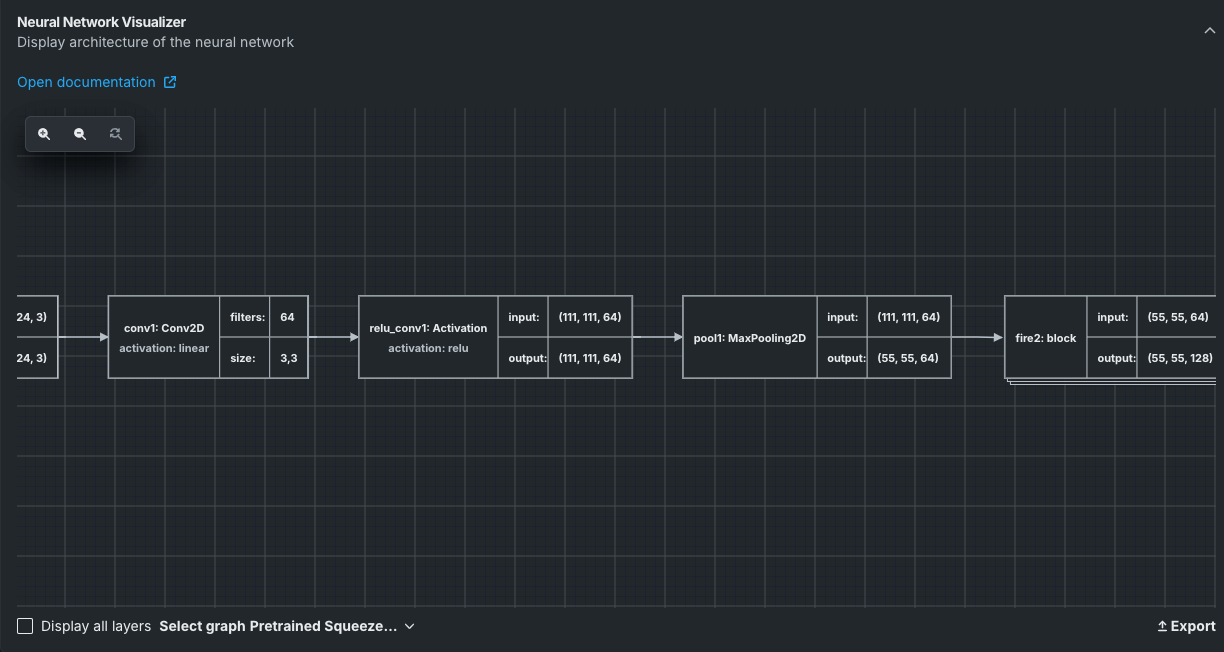
There are several ways to interact with the visualizer display:
-
Click and drag left and right to see all layers.
-
Use the canvas tools to zoom in or out, or to reset to the default.
-
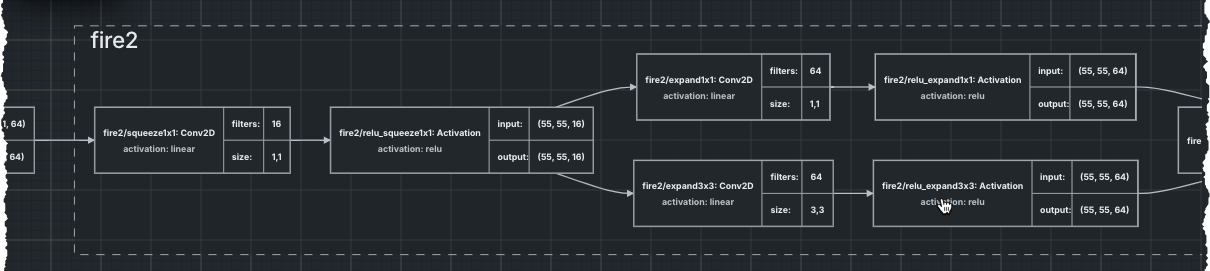
Click a grouped layer to expand and display, or collapse and hide, all layers in the group (cluster). These clusters are parallel groups of CNNs with the same architecture, but with different weights and biases. Each can be thought of as a separate feature detector applied on the same input.

-
Click Display all layers to reload the blueprint with all layers expanded.
-
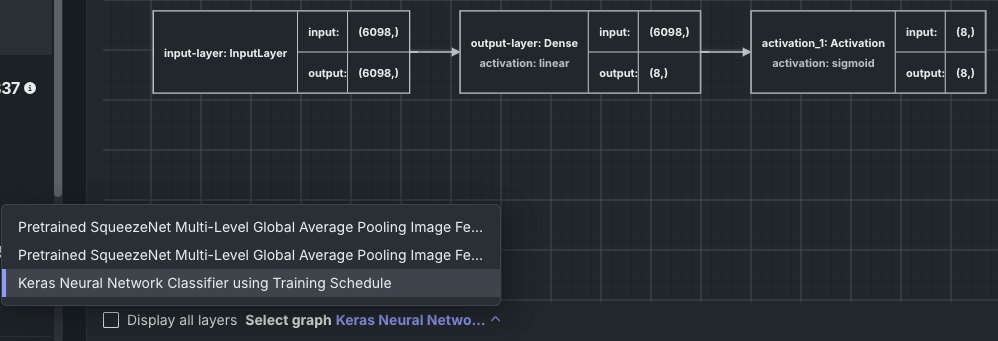
For blueprints that contain multiple neural networks in a single blueprint, the Select graph dropdown becomes available, allowing you to display the associated visualization for that neural network.
Next steps
After confirming the network's structure, use these companion insights to understand what the model has learned.
- Attention Maps: See which regions of an image the model focuses on when making predictions.
- Image Embeddings: Visualize how the model's featurizer groups images by similarity.
- Model Info: Check general model and performance statistics, such as training sample size and prediction time.