Local tracing
The Traces tab in the local experimentation dashboard lists every request the agent handled during a development session. Use it to inspect spans, tool calls, latency, token counts, and errors without deploying to the DataRobot platform.
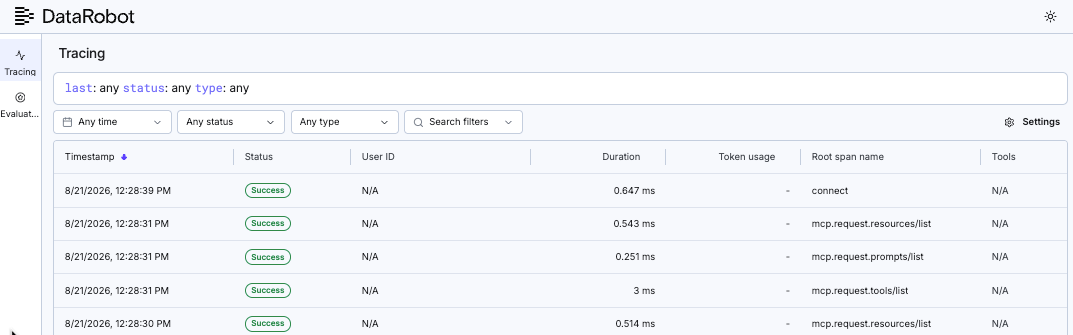
For installation, GUI access, and port configuration, see the DataRobot experimentation plugin landing page.
Why use local tracing
Local tracing supports agent development in several ways:
- Faster iteration. Review traces, logs, and spans without leaving the local environment or breaking the development flow.
- Behavior verification. Validate agent behavior across multiple real requests before deployment, not only on a single demo input.
- Span-level debugging. Inspect individual spans to explain agent decisions instead of inferring them from the final response.
- Earlier issue detection. Catch errors, guardrail violations, and performance problems while changes are still local, before they reach production.
For guidance on adding custom spans and attributes that appear in local and deployed traces, see Implement tracing. After deployment, review traces in the DataRobot UI; see Tracing for custom applications.
Inspect OpenTelemetry traces
After installing the plugin, start the agent locally with task agent:dev. If the dashboard did not start automatically, run dr xp in another terminal. By default, it is available at http://localhost:8090. Configure the port with --port or DR_EXPERIMENT_PORT.
The dashboard lists every request the agent handled during the session. Each row corresponds to a trace. Select a trace to open a detailed breakdown of its spans, including:
- Tool invocations and their execution order.
- Duration and latency for each span.
- Token counts, when reported by instrumentation.
- Associated error logs when a span or trace fails.
This is the same class of observability normally available only after deployment. With the experimentation plugin, it is available on the local machine from the start of development.
Filter and search traces
As request volume grows, use the dashboard controls to narrow results:
| Control | Description |
|---|---|
| Attribute filter | Isolate traces by tool name, model, or a custom span attribute. |
| Status filter | Separate successful runs from traces that ended in error. |
| Date range | Scope the table to a specific window of activity. |
| Search | Jump directly to a trace by request or trace identifier. |
Tracing troubleshooting
| Symptom | Fix |
|---|---|
| No traces in the dashboard | Start the agent with dr run dev or task agent:dev, send requests to the agent, then refresh the Traces tab. |
| Dashboard not reachable | Confirm the server is running; see GUI access troubleshooting. |
Port 8090 already in use |
List the process with lsof -i :8090 (macOS/Linux), note the PID, and run kill <PID>. On Windows, run netstat -ano | findstr :8090, then taskkill /PID <pid> /F. Alternatively, start on another port with --port 8091. |
| Duplicate startup message | When task dev runs, dr xp may start from both agent:dev and infra:dev. The message Already running at http://127.0.0.1:8090 is expected. |
See also
- DataRobot experimentation plugin—install, configure, and open the GUI.
- Batch agent evaluation—score agent responses on a fixed dataset.
- Implement tracing—add custom spans and attributes.