Late shipment predictions
With the inception of one-day and same-day delivery, customer standards on punctuality and speed have risen to levels unlike ever before. While a delayed delivery will usually be only a nuisance to the individual consumer, demands for speed ultimately flow upstream into the supply chain, where retailers and manufacturers are constantly being pressed on time. For these organizations, on-time performance is a matter of millions of dollars of customer orders or contractual obligations. Unfortunately, with the unavoidable challenges that come with managing variability in the supply chain, even the most well-known logistics carriers saw a 6.9 percent average delay across shipments made by 100 e-commerce retailers who collectively delivered more than 500,000 packages in the first quarter of 2019.
Sample training data used in this use case, "Supply Chain Shipment Pricing Data":
Click here to jump directly to the hands-on sections that begin with working with data. Otherwise, the following several paragraphs describe the business justification and problem framing for this use case.
Business problem
A critical component of any supply chain network is to prevent parts shortages, especially when they occur at the last minute. Parts shortages not only lead to underutilized machines and transportation, but also cause a domino effect of late deliveries through the entire network. In addition, the discrepancies between the forecasted and actual number of parts that arrive on time prevent supply chain managers from optimizing their materials plans.
To mitigate the impact delays will have on the supply chain, manufacturers adopt approaches such as holding excess inventory, optimizing product designs for more standardization, and moving away from single-sourcing strategies. However, most of these approaches add up to unnecessary costs for parts, storage, and logistics.
In many cases, late shipments persist until supply chain managers can evaluate the root cause and then implement short-term and long-term adjustments that prevent them from occurring in the future. Unfortunately, supply chain managers have been unable to efficiently analyze historical data available in MRP systems because of the time and resources required.
Solution value
AI helps supply chain managers reduce parts shortages by predicting the occurrence of late shipments, which in turn gives them time to intervene. By learning from past cases of late shipments and their associated features, AI applies these patterns to future shipments to predict the likelihood that those shipments will also be delayed. Unlike complex MRP systems, AI provides supply chain managers with the statistical reasons behind each late shipment in an intuitive but scientific way. For example, when AI notifies supply chain managers of a late shipment, it will also explain why, offering reasons such as the shipment’s vendor, mode of transportation, or country.
Using this information, supply chain managers can apply both-short term and long-term solutions to preventing late shipments. In the short term, based on their unique characteristics, shipment delays can be prevented by adjusting transportation or delivery routes. In the long term, supply chain managers can conduct aggregated root-cause analyses to discover and solve the systematic causes of delays. They can use this information to make strategic decisions, such as choosing vendors located in more accessible geographies or reorganizing shipment schedules and quantities.
ROI estimation
The ROI for implementing this solution can be estimated by considering the following factors:
-
Starting with the manufacturing company and production line stoppage, the cycle time of the production process can be used to understand how much of the production loss relates to part shortages. For example, if the cycle time (time taken to complete one part) is 60 seconds and each day 15 minutes of production are lost to part shortages, then total production loss is equivalent to 15 products, which can be translated to loss in profit of 15 products in a day. A similar calculation can be used to estimate annual loss due to part shortage.
-
For a logistic provider, predicting part shortages early can increase savings in terms of reduced inventory. This can be roughly measured by capturing the difference in maintaining parts stock before and after implementation of the AI solution. The difference in stock when multiplied by the holding and inventory cost per unit, calculates the overall ROI. Furthermore, in cases when the demand for parts is left unfulfilled (because of part shortages), the opportunity cost related to the unsatisfied demand could directly result in the loss of prospective business opportunities.
Data
This accelerator uses a publicly-available dataset, provided by the President’s Emergency plan for AIDS relief (PEPFAR), to represent how a manufacturing or logistics company can leverage AI models to improve decision-making. This dataset provides supply chain health commodity shipment and pricing data. Specifically, it identifies Antiretroviral (ARV) and HIV lab shipments to supported countries. In addition, it provides the commodity pricing and associated supply chain expenses necessary to move the commodities to other countries for use.
Features and sample data
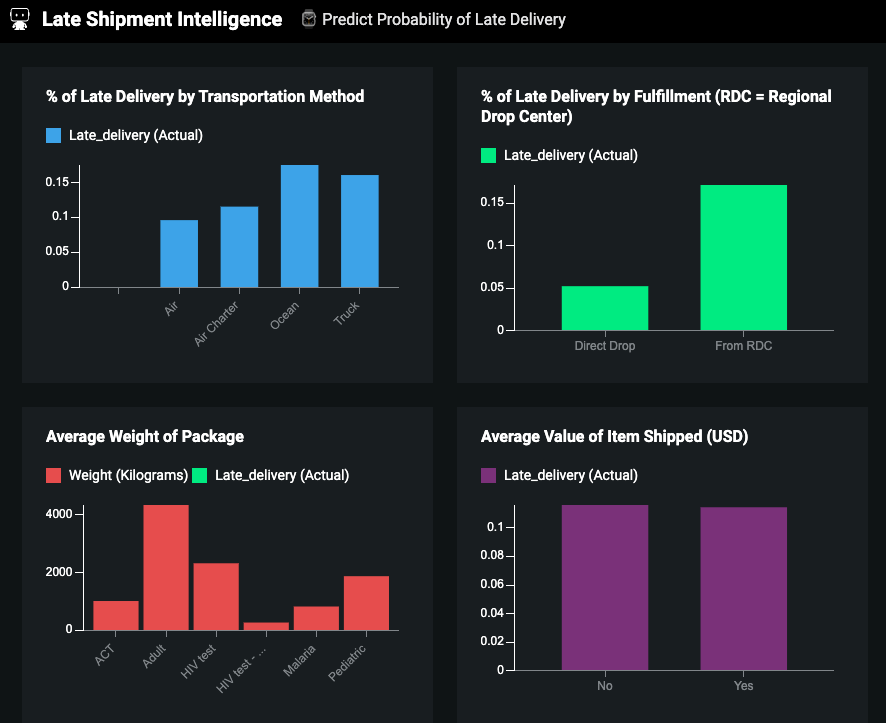
The features in the dataset represent some of the factors that are important in predicting delays.
Target
The target variable:
Late_delivery
This feature represents whether or not a shipment would be delayed using values such as True \ False, 1 \ 0, etc. This choice in target makes this a binary classification problem. The distribution of the target variable is imbalanced, with 11.4% being 1 (late delivery) and 88.6% being 0 (on-time delivery).
Sample feature list
The following shows sample features for this use case:
| Feature name | Data type | Description | Data source | Example |
|---|---|---|---|---|
| Vendor | Categorical | Name of the vendor who would be shipping the delivery | Purchase order | Ranbaxy, Sun Pharma etc. |
| Item description | Text | Details of the part/item that is being shipped | Purchase order | 30mg HIV test kit, 600mg Lamivudine capsules |
| Line item quantity | Numeric | Amount of item that was ordered | Purchase order | 1000, 300 etc. |
| Line item value | Numeric | Unit price of the line item ordered | Purchase order | 0.39, 1.33 |
| Manufacturing site | Categorical | Site of the vendor manufacturing (the same vendor can ship parts from different sites) | Invoice | Sun Pharma, India |
| Product group | Categorical | Category of the product that is ordered | Purchase order | HRDT, ARV |
| Shipment mode | Categorical | Mode of transport for part delivery | Invoice | Air, Truck |
| Late delivery | Target (Binary) | Whether the delivery was late or on-time | ERP System, Purchase Order | 0 or 1 |
In addition to the features listed above, incorporate any additional data that your organization collects that might be relevant to delays. (DataRobot is able to differentiate important/unimportant features if your selection would not improve modeling.) These features are generally stored across proprietary data sources available in the ERP systems of the organization.
Data preparation
The included dataset contains historical information on procurement transactions. Each row of analysis in the dataset is an individual order that is placed and whose delivery needs to be predicted. Every order has a scheduled delivery date and actual delivery date—the difference between these dates is used to define the target variable (Late_delivery). If the delivery date surpassed the scheduled date, then the target variable had a value 1, otherwise, the value is 0. Overall, the dataset contains roughly 10,320 rows and 26 features, including the target variable.
Modeling and insights
DataRobot automates many parts of the modeling pipeline, including processing and partitioning the dataset, as described here.
While this use case skips the modeling section and moves straight to model interpretation, it is worth noting that because the dataset is imbalanced, DataRobot automatically recommends using LogLoss as the optimization metric to identify the most accurate model, being that it is an error metric which penalizes wrong predictions.
For this dataset, DataRobot found the most accurate model to be the Extreme Gradient Boosting Tree Classifier with unsupervised learning features using the open-source XGboost library.
The following sections describe the insights available after a model is built.
Feature Impact
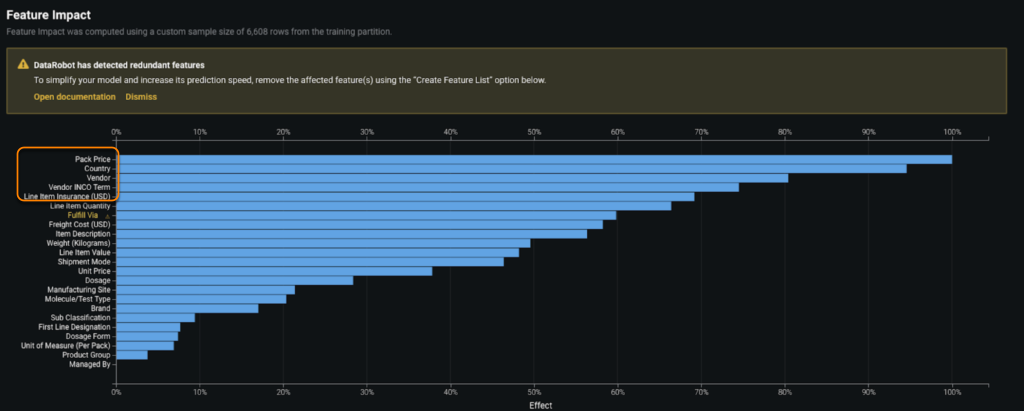
To provide transparency on how the model works, DataRobot provides both global and local levels of model explanations. Feature Impact shows, at a high level, which features are driving model decisions (the relative importance of the features in the dataset in relation to the selected target variable).
From the visualization, you can see that the model identified Pack Price, Country, Vendor, Vendor INCO Term, and Line item Insurance as some of the most critical factors affecting delays in the parts shipments:
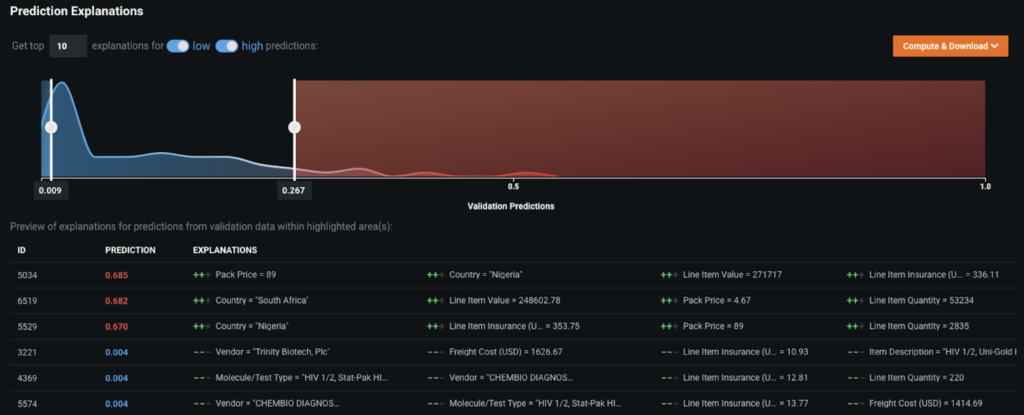
Prediction Explanations
DataRobot also provides Prediction Explanations to help understand the 10 key drivers for each prediction generated. This offers you the granularity you need to tailor your actions to the unique characteristics behind each part shortage.
For example, if a particular country is a top reason for a shipment delay, you can take action by reaching out to vendors in these countries and closely monitoring the shipment delivery across these routes.
Similarly, if there are certain vendors that are among the top reasons for delays, you can proactively reach out to these vendors and take corrective actions to avoid any delayed shipments that would affect the supply chain network. These insights help businesses make data-driven decisions to improve the supply chain process by incorporating new rules or alternative procurement sources.
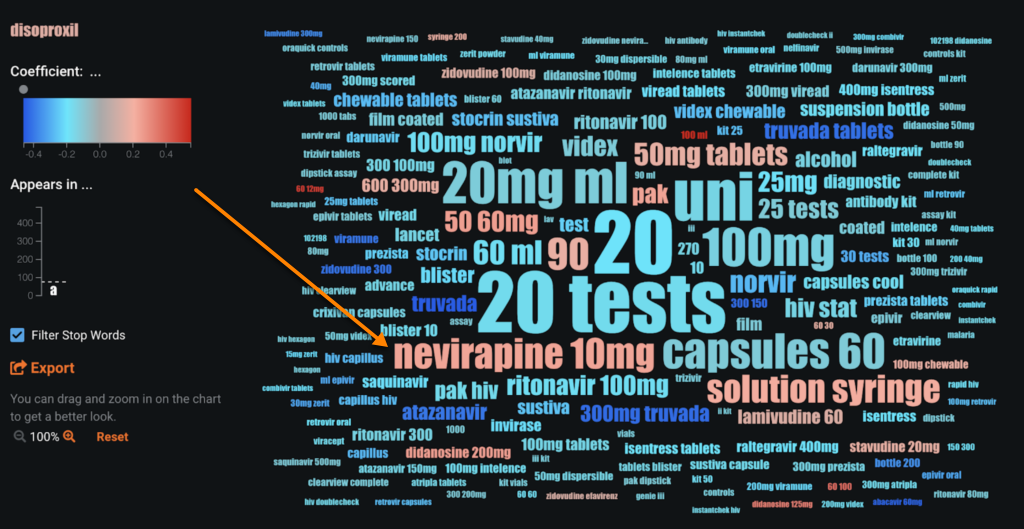
Word Cloud
For text variables, such as Part description in the included dataset), use Word Clouds to discover the words or phrases that are highly associated with delayed shipments. Although text features are generally the most challenging and time consuming to build models for, DataRobot automatically fits each individual text column as an individual classifier, which is directly preprocessed with natural language processing (NLP) techniques (tf-idf, n grams, etc.) In this cloud, you can see that the items described as nevirapine 10 mg are more likely to get delayed in comparison to other items.
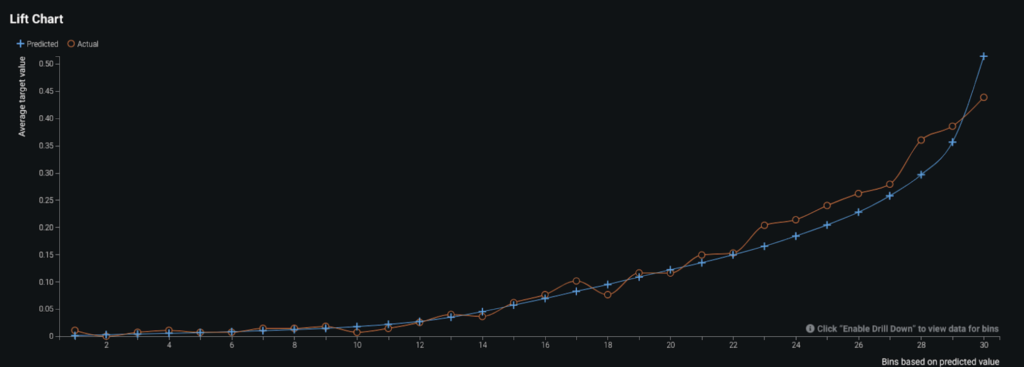
Evaluate accuracy
To evaluate the performance of the model, DataRobot, by default, ran five-fold cross validation and the resulting AUC score was roughly 0.82. The AUC score on the Holdout set (unseen data) was nearly equivalent, indicating that the model is generalizing well and is not overfitting. The reason to use the AUC score for evaluating the model is because AUC ranks the output (i.e., the probability of delayed shipment) instead of looking at actual values. The Lift Chart, below, shows how the predicted values (blue line) compare to actual values (red line) when the data is sorted by predicted values. You can see that the model has slight under-predictions for the orders which are more likely to get delayed. But overall, the model performs well. Furthermore, depending on your ultimate problem framework, you can review the Confusion Matrix for the selected model and, if required, adjust the prediction threshold to optimize for precision and recall.
Predict and deploy
After selecting a model, you can deploy it into your desired decision environment. Decision environments are the ways in which the predictions generated by the model will be consumed by the appropriate stakeholders in your organization, and how these stakeholders will make decisions using the predictions to impact the overall process.
The predictions from this use case can augment the decisions of the supply chain managers as they foresee any upcoming delays in logistics. It acts as an intelligent machine that, combined with the decisions of the managers, help improve your entire supply chain network.
Decision stakeholders
The following table lists potential decision stakeholders
| Stakeholder | Description |
|---|---|
| Decision Executors | Supply chain managers and procurement teams who are empowered with the information they need to ensure that the supply chain network is free from bottlenecks. These personnel have strong relationships with vendors and the ability to take corrective action using the model’s predictions. |
| Decision Managers | Executive stakeholders who manage large-scale partnerships with key vendors. Based on the overall results, these stakeholders can perform quarterly reviews of the health of their vendor relationships to make strategic decisions on long-term investments and business partnerships. |
| Decision Authors | Business analysts or data scientists who would build this decision environment. These analysts could be the engineers/analysts from the supply chain, engineering, or vendor development teams in the organization who usually work in collaboration with the supply chain managers and their teams. |
Model deployment
The model can be deployed using the DataRobot Prediction API. A REST API endpoint can bounce back predictions in near real time when new scoring data from new orders are received.
No-Code AI Apps
Once the model is deployed (in whatever way the organization decides), the predictions can be consumed in several ways. For example, a front-end application that acts as the supply chain’s reporting tool can be used to deliver new scoring data as an input to the model, which then returns predictions and Prediction Explanations in real-time for use in the decision process. For example, this No-Code AI App is an easily shareable, AI-powered application using a no-code interface:
Decision process
The action that managers and executive stakeholders could decide to take, based on the predictions and Prediction Explanations for identifying potential bottlenecks, is reaching out and collaborating with appropriate vendor teams in the supply chain network based on data-driven insights. The could make both long- and short-term decisions based on the severity of the impact of shortages on the business.
Monitoring and management
Tracking model health is one of the most critical components of proper model lifecycle management, similar to product lifecycle management. Use MLOps to deploy, monitor (for data drift and accuracy), and manage all models across the organization through a centralized platform.
Implementation considerations
One of the major risks in implementing this solution in the real world is adoption at the ground level. Having strong and transparent relationships with vendors is also critical in taking corrective action. The risk is that vendors may not be ready to adopt a data-driven strategy and trust the model results.