Value Tracker
Value Tracker
The Value Tracker allows you to specify what you expect to accomplish by using DataRobot. You can measure success by defining the value you expect to get and tracking the actual value you receive in real time. The Value Tracker also provides a platform for you to collect the various DataRobot assets you are using to achieve your goals and collaborate with others.
Navigate to Value Tracker to view the dashboard.

The dashboard provides details for existing value trackers and allows you to navigate to any value tracker you currently have access to. You can search existing value trackers and create new ones with the actions in the upper left.
Create a value tracker
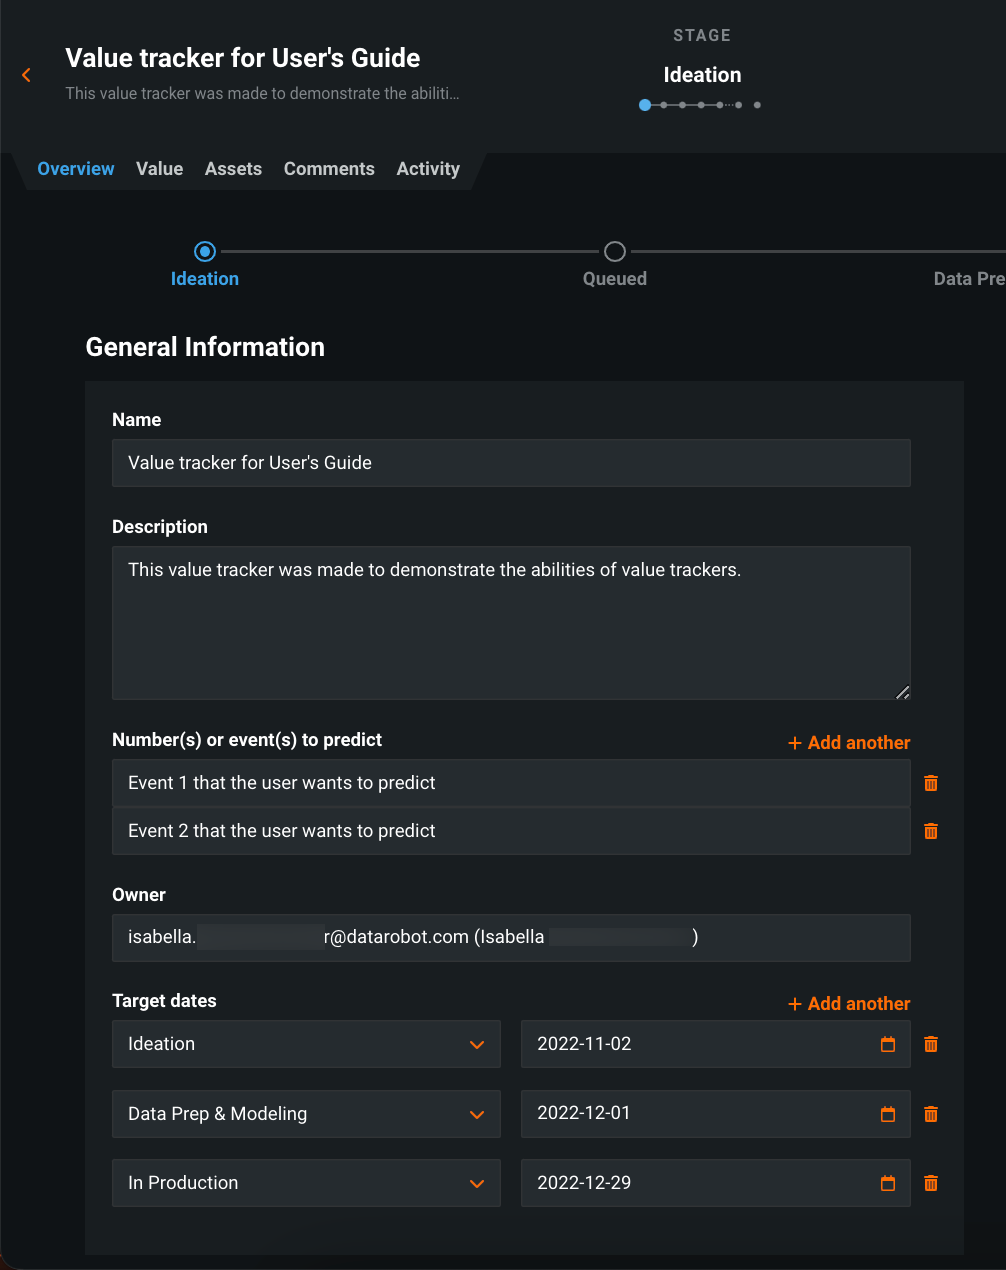
From the dashboard, select + Add new value tracker. This brings you to the Overview tab for the new value tracker. Complete the fields to provide general information about what you want to track.
| Category | Description |
|---|---|
| Name | The name of the value tracker. |
| Description | A basic description of what the value tracker is designed to accomplish. |
| Number(s) or event(s) to predict | Targets or metrics that you measure in the value tracker (used for information purposes only.) |
| Owner | The user who owns the value tracker. |
| Target dates | The dates that outline when the value tracker is expected to reach individual project stages. You can only set one target date for each stage. |
The Overview tab displays a stage bar, visible on every tab, to track the current progress of a value tracker. Update the stage at any time by clicking on one of the radio buttons.

After completing the fields, click Save in the top right corner. To undo all changes, click Cancel. Once saved, your value tracker is created and is accessible from the dashboard.
Value tab
The Value tab offers tools to estimate the monetary value generated by using AI. This data helps you prioritize decisions that are more likely to be successful and provide greater value.
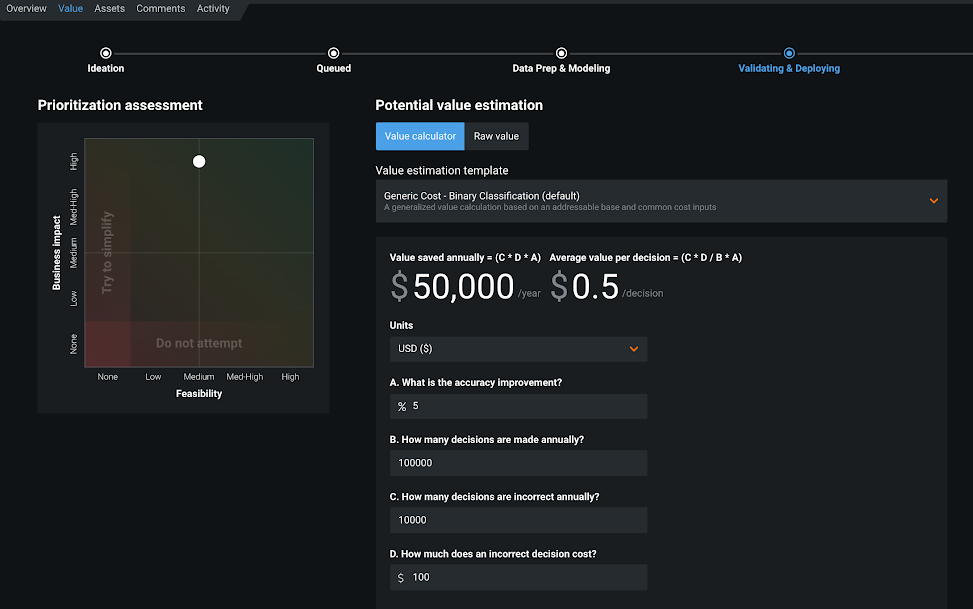
Prioritization assessment
Use the snap grid to estimate the business impact (Y-axis) and feasibility (X-axis) of a value tracker. Each axis has 5 data points: None, Low, Medium, Med-High, High. The grid also displays built-in warnings, described in the table below:
| Warning | Cause | Description |
|---|---|---|
| Try to simplify | Feasibility = None | There is value in pursuing the value tracker, but DataRobot recommends simplifying the problem. |
| Do not attempt | Business impact = None | There is no business impact, and DataRobot does not recommend pursuing the value tracker. |
To change a value tracker's location on the grid, click on the desired section and the dot snaps to the closest datapoint. After making any changes, click Save.
Potential value estimation
The Potential value estimation modal assists you in estimating the expected value to receive (in actual currency) when implementing a value tracker. Select Raw value to manually provide an estimation and Value calculator to calculate an estimation with the interface.
Value calculator
To use the value calculator, you must choose from either the Binary Classification or Regression template. Provide numeric values to answer the questions that accompany each template. The example below displays the template for a Binary Classification value tracker.
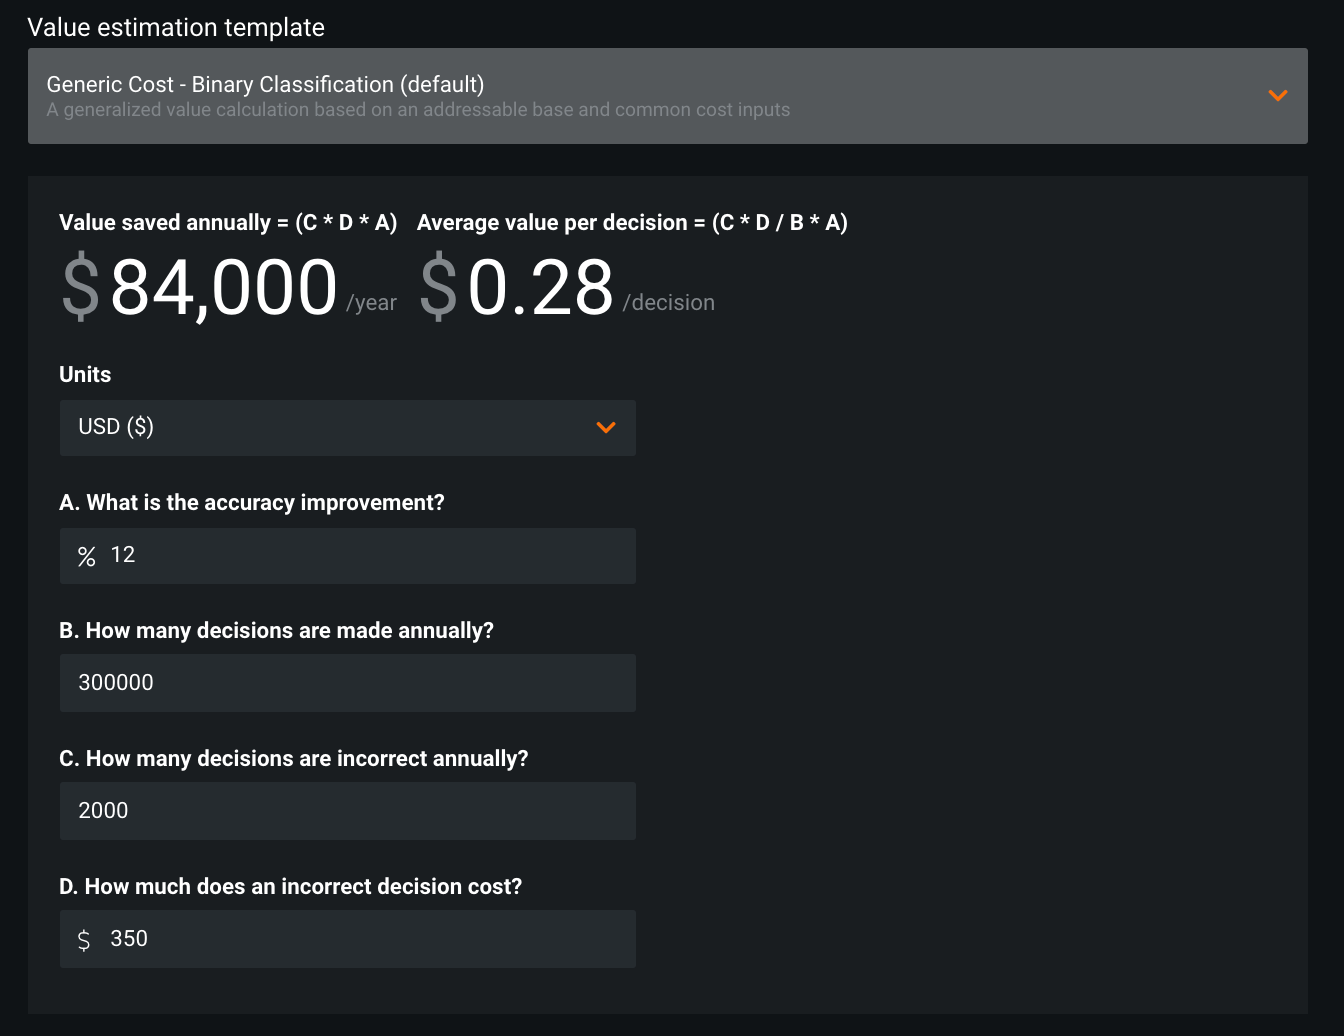
After completing the fields for either template, DataRobot calculates two values based on your inputs:
- Value saved annually: The expected value that can be produced by this value tracker each year.
- Average value per decision: The value produced by the value tracker each time a decision is made.
After making any calculations, click Save.
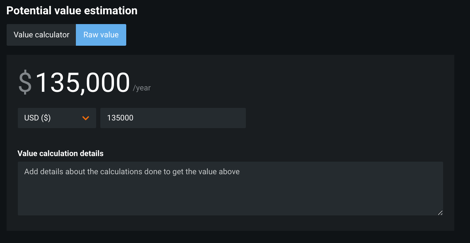
Raw value
Use the raw value method to provide an estimated value manually. Specify a currency and expected annual value for the value tracker. Provide details for how you calculated the value in the text box.
Production value metrics
When a value tracker is moved to the In Production stage, the Value tab updates from estimating potential value to tracking realized value. The tab displays new metrics:

| Category | Description |
|---|---|
| Potential value | The estimated annual value for the value tracker. |
| Realized value | The total realized value of the value tracker. Realized value is calculated by multiplying "Average value per decision” by the number of predictions made in the history of deployments tied to the value tracker. |
| Predictions | The total number of predictions made for all deployments attached to the value tracker. |
| Deployment status | The aggregated health statuses of deployments attached to this value tracker. The icons represent service health, data drift, and accuracy. If multiple deployments are attached to a value tracker, the most severe status per health type is shown. If the status shows an issue, you can view the status of individual deployments on the Attachments page. |
All predictions from an attached deployment contribute to realized value, including predictions made before the deployment was attached to the value tracker. If a deployment is removed from a value tracker, realized value derived from that deployment will also be removed from the value tracker.
If the average value per decision is updated, the new value will apply to all realized value calculations, including value from previous predictions. If a value calculator was not used to define potential value, then realized value cannot be calculated because the value tracker lacks an “Average value per decision” value. However, you can still track deployment health and predictions over time.
Two new charts appear on the value tab when you move a value tracker to the "In Production" stage:
-
A realized value chart, measuring the realized value (Y-axis) over time (X-axis).
-
Number of predictions, measuring the number of predictions made (Y-axis) over time (X-axis).
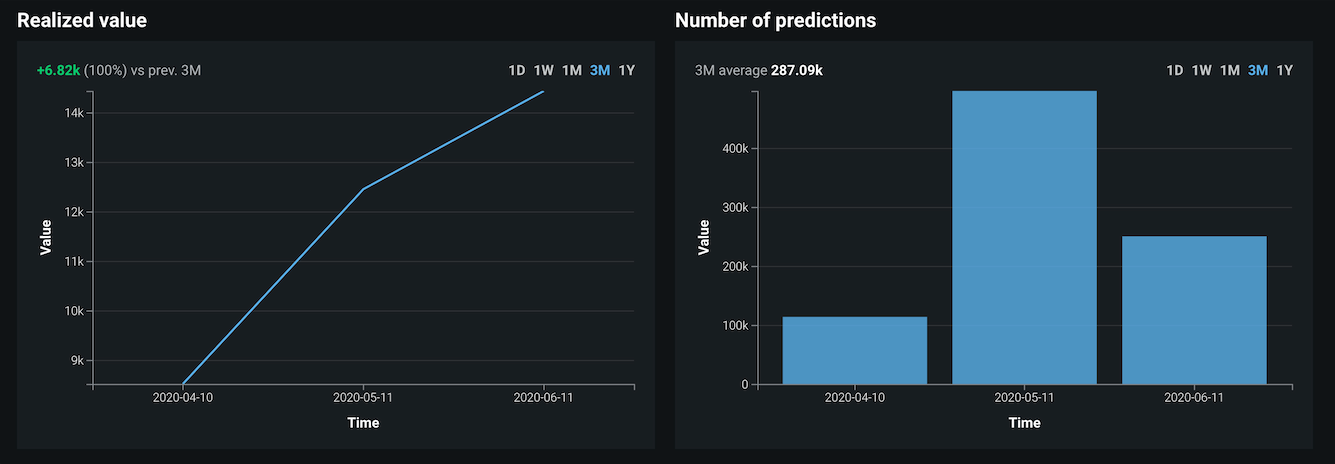
Modify the time range in the upper right corner of each chart.
To review or edit information displayed in the Value tab before the value tracker was moved to "In Production" (snap grid, value calculator, etc.), click Show potential value information below the charts.
Assets tab
The Assets tab provides a collection of all of the other DataRobot objects—datasets, deployments, and more—contributing to the value tracker.
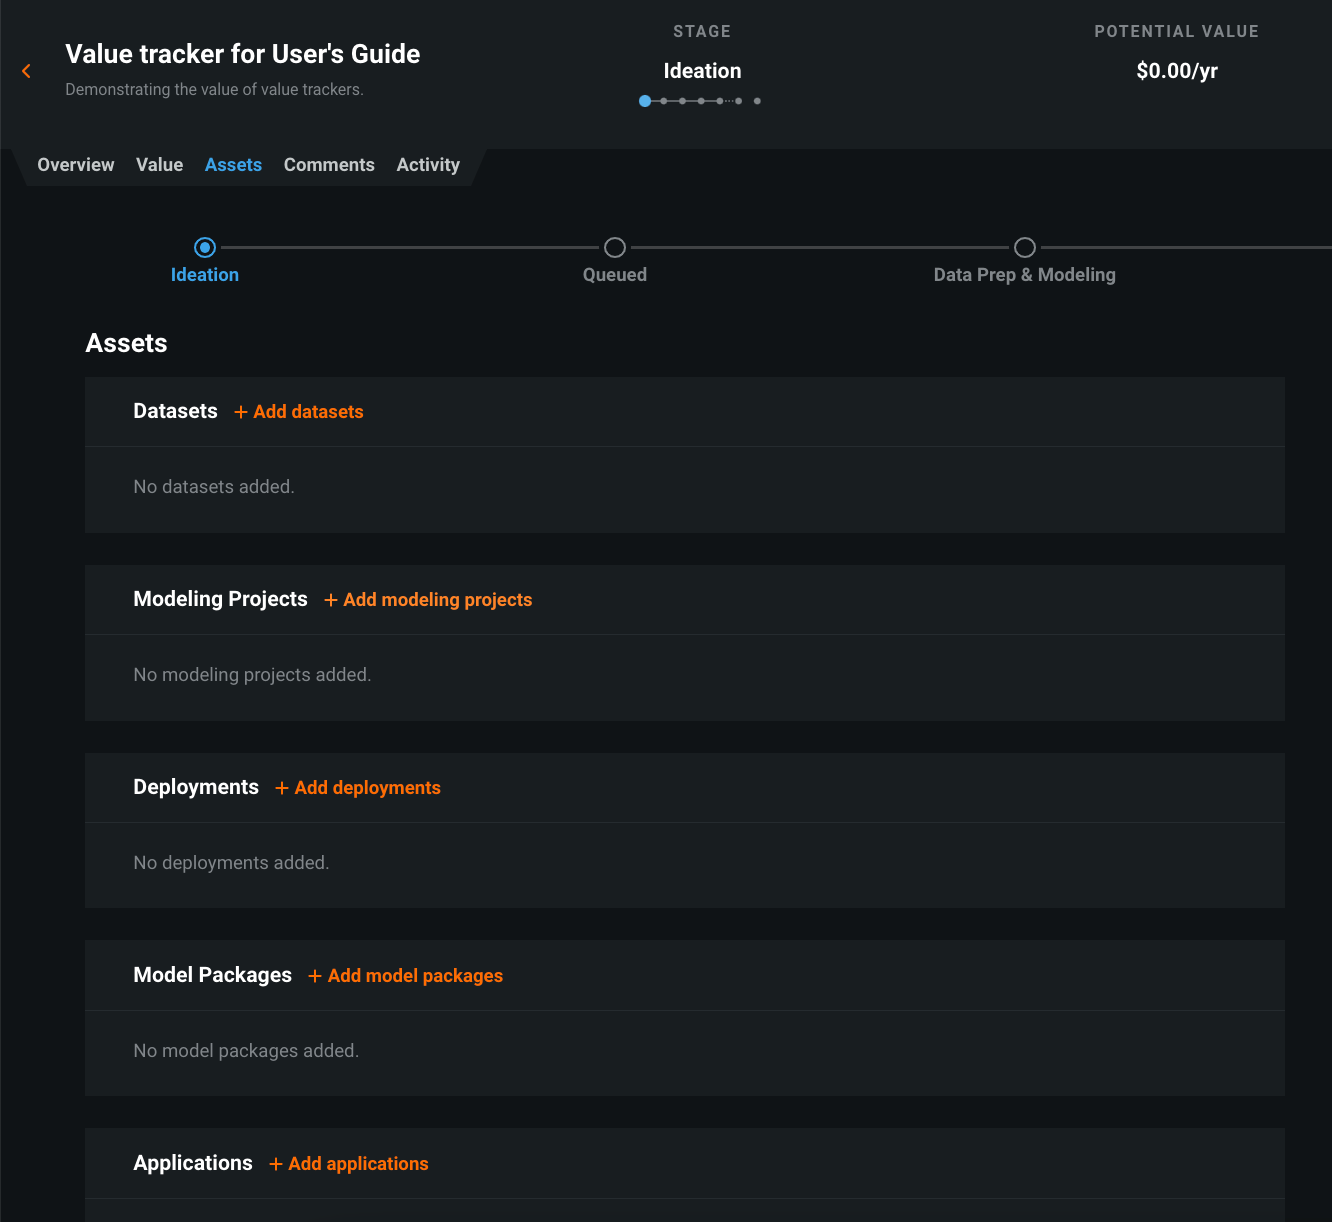
Six types of objects can be attached to value trackers:
- Datasets
- Projects
- Deployments
- Model packages
- Custom models
- Applications
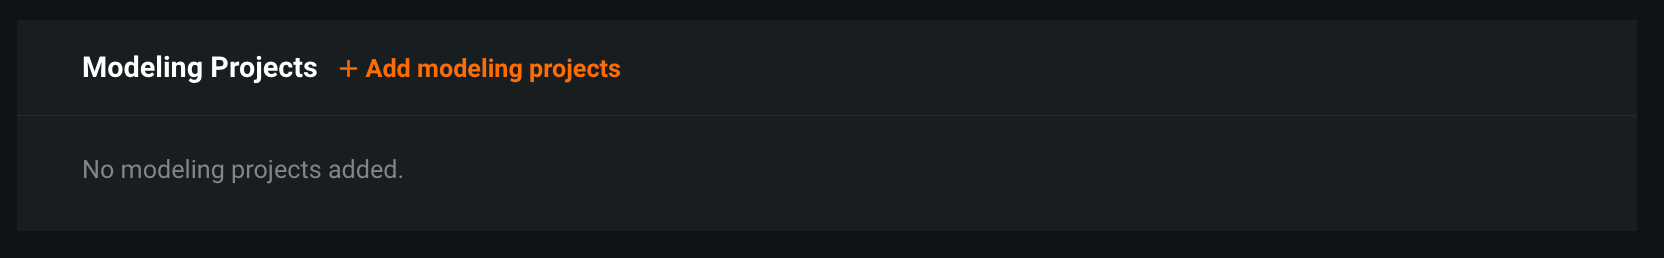
To attach an object, click the plus sign for the type of object you want to attach. The example below outlines the workflow for adding a modeling project.
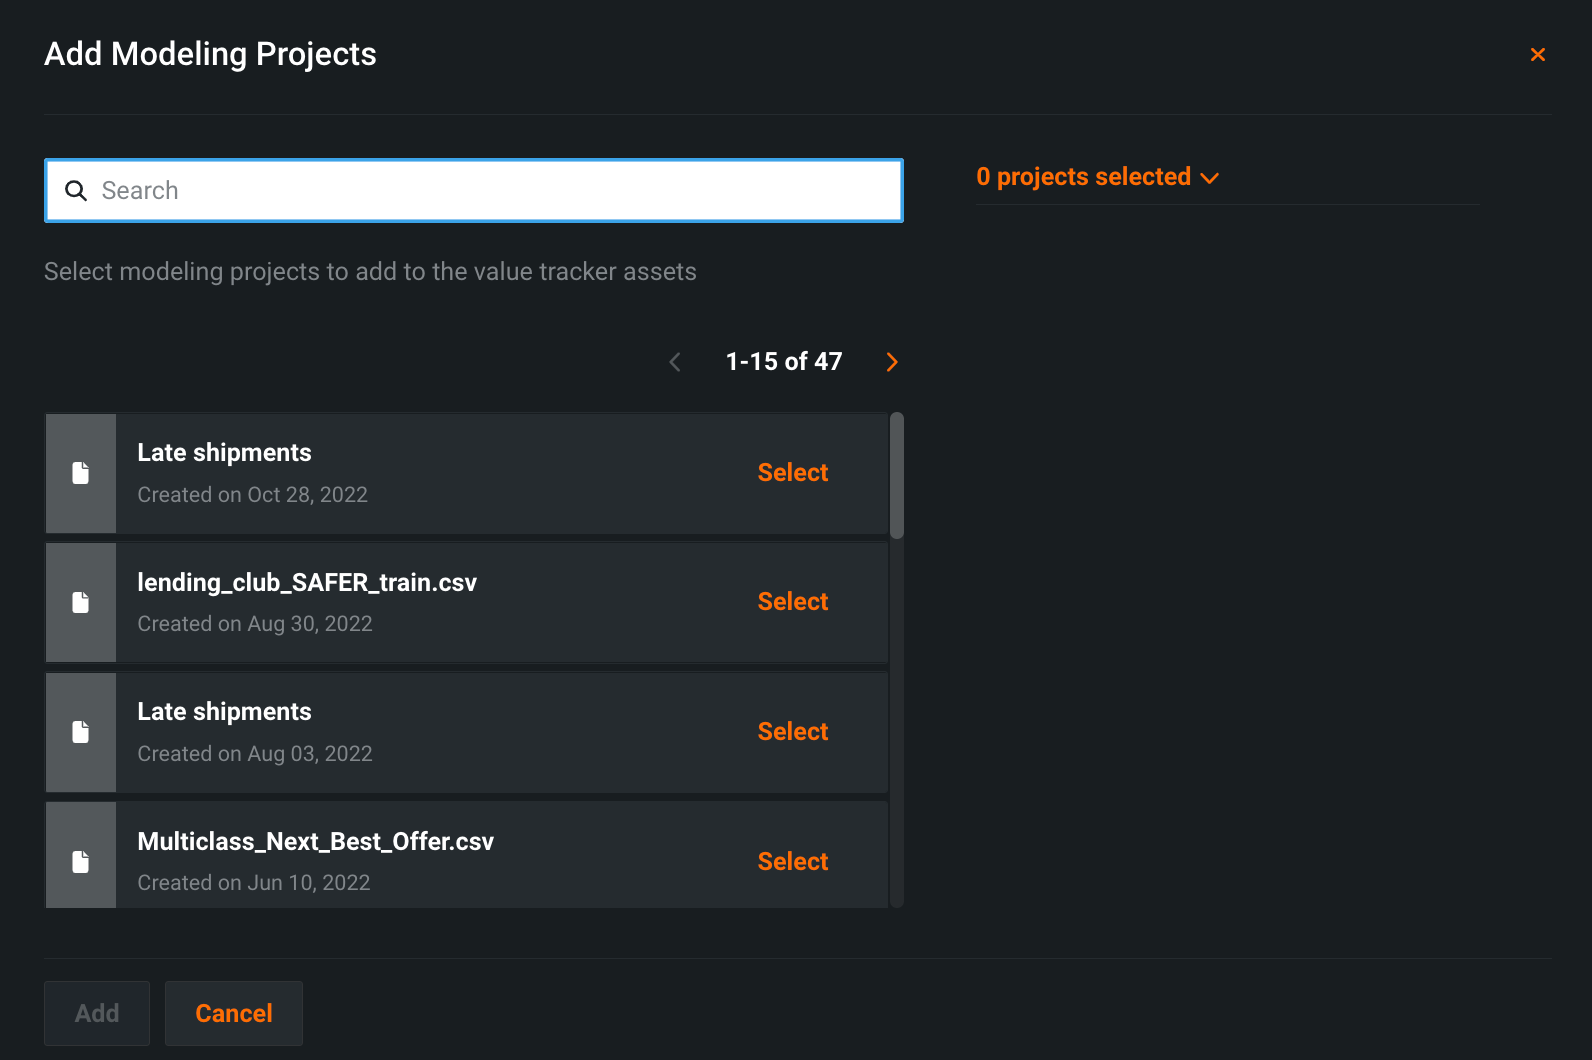
You are directed to the attachment modal, listing all objects of the chosen type that you currently have access to. In order to attach objects, click Select next to the object. You can select multiple objects at once. When you have selected the projects to attach, click Add.
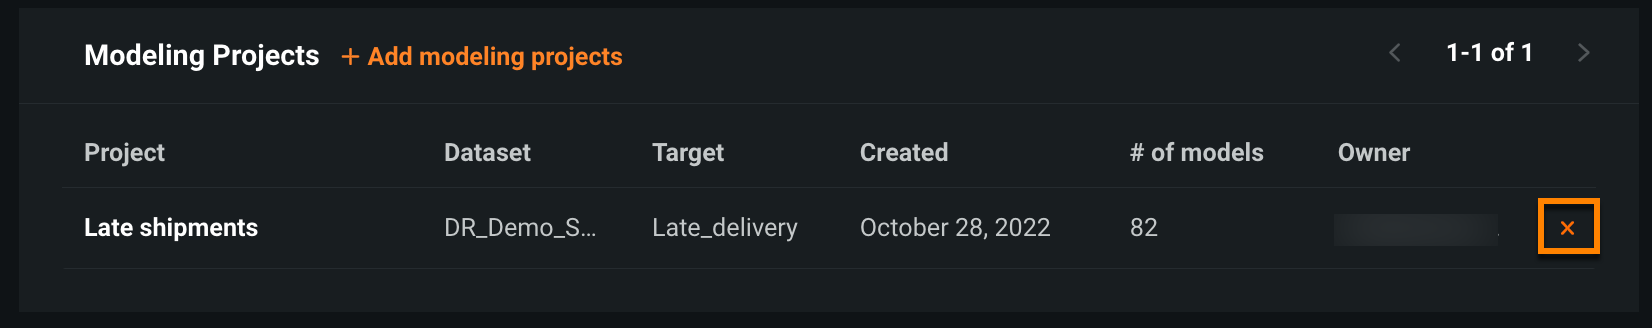
When assets are added to a value tracker, they will be listed on the Assets tab with some metadata. Click on an individual asset name to view it in detail. Click the orange "X" to remove it.
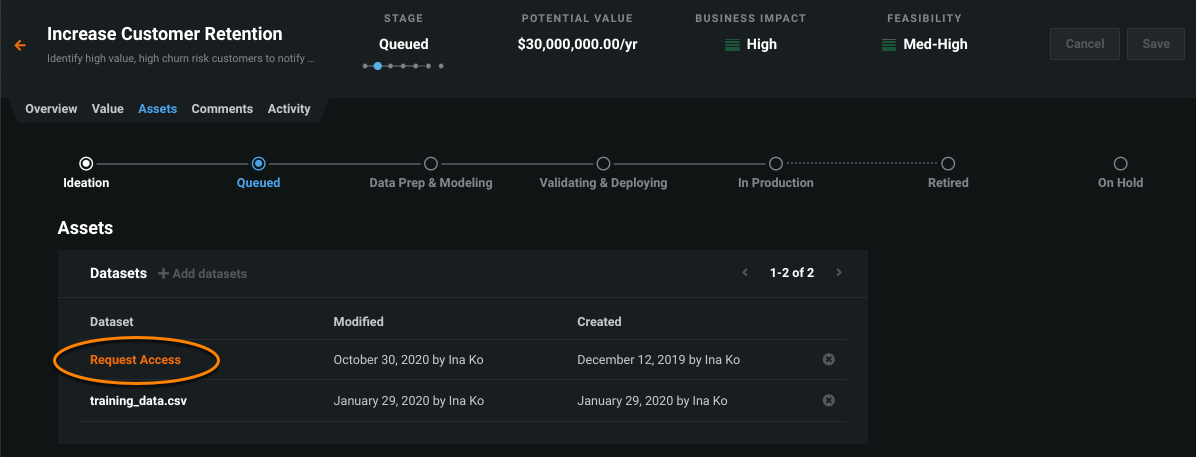
Assets access
Sharing a value tracker does not automatically grant access to its datasets, modeling projects, deployments, model packages, custom models, and applications. Each of these assets could have different owners as well as collaborators with different permissions.
If you need access to assets in a shared value tracker, hover over the asset and click Request Access.
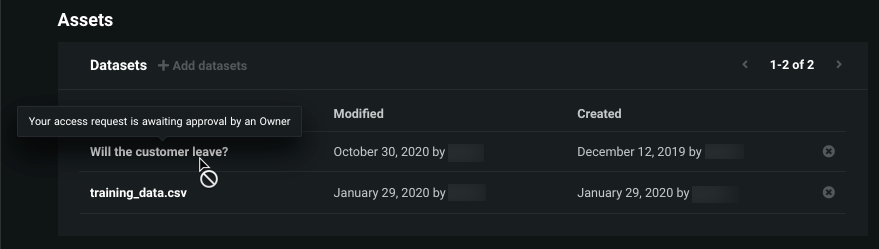
The Owner of the asset will receive an email notification of your request. While you are awaiting approval, you will see the following message when you hover over the asset:
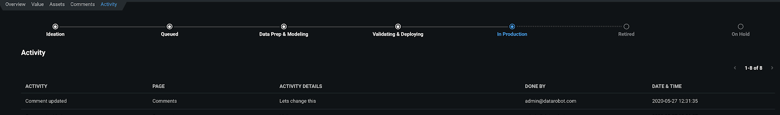
Activity tab
The Activity tab provides a way to track changes to a value tracker over time. Any action taken on a value tracker is recorded, along with who took the action and when it was taken. Navigate pages with the arrows in the top right corner.
Value Tracker actions
Each value tracker has three actions available: edit, share, and delete.

-
Select the edit icon to modify the overview page for the value tracker.
-
Select the share icon to allow other users access to the value tracker and assign them a role.
-
Select the trash icon to permanently delete a value tracker. Once deleted, the value tracker cannot be recovered, but associated objects will persist (datasets, deployments, etc.)
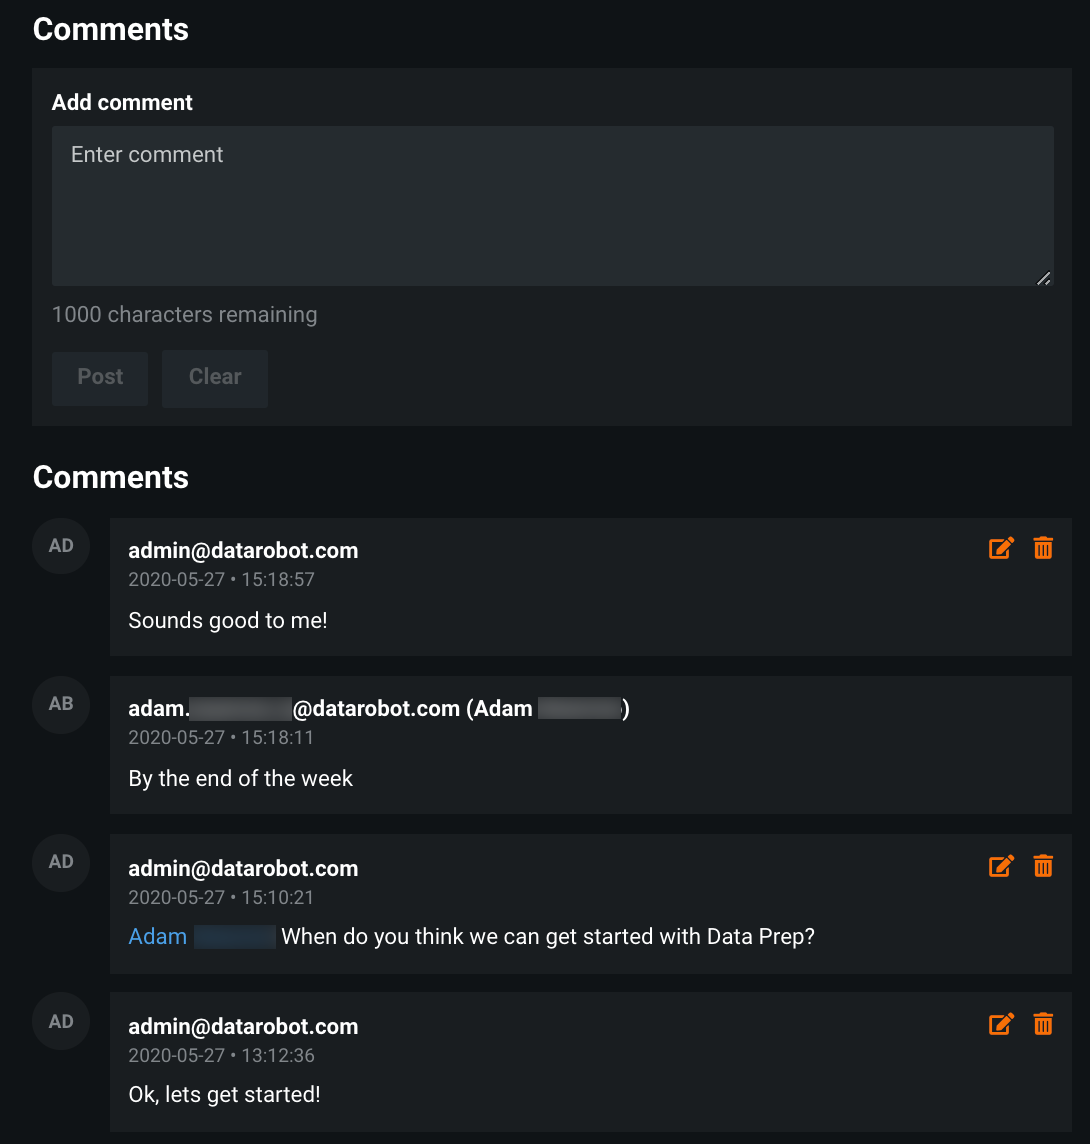
In addition to the three action icons, each value tracker has a Comments sections, where all users who have a value tracker can host discussions. The comments support tagging users and sending email notifications to those users. Comments can be edited or deleted.
Filtering
Select the Stage dropdown above the list to filter the list by the stage value trackers are in. When filtering by stage, the contents of the chart will change based on what stage you filter by.
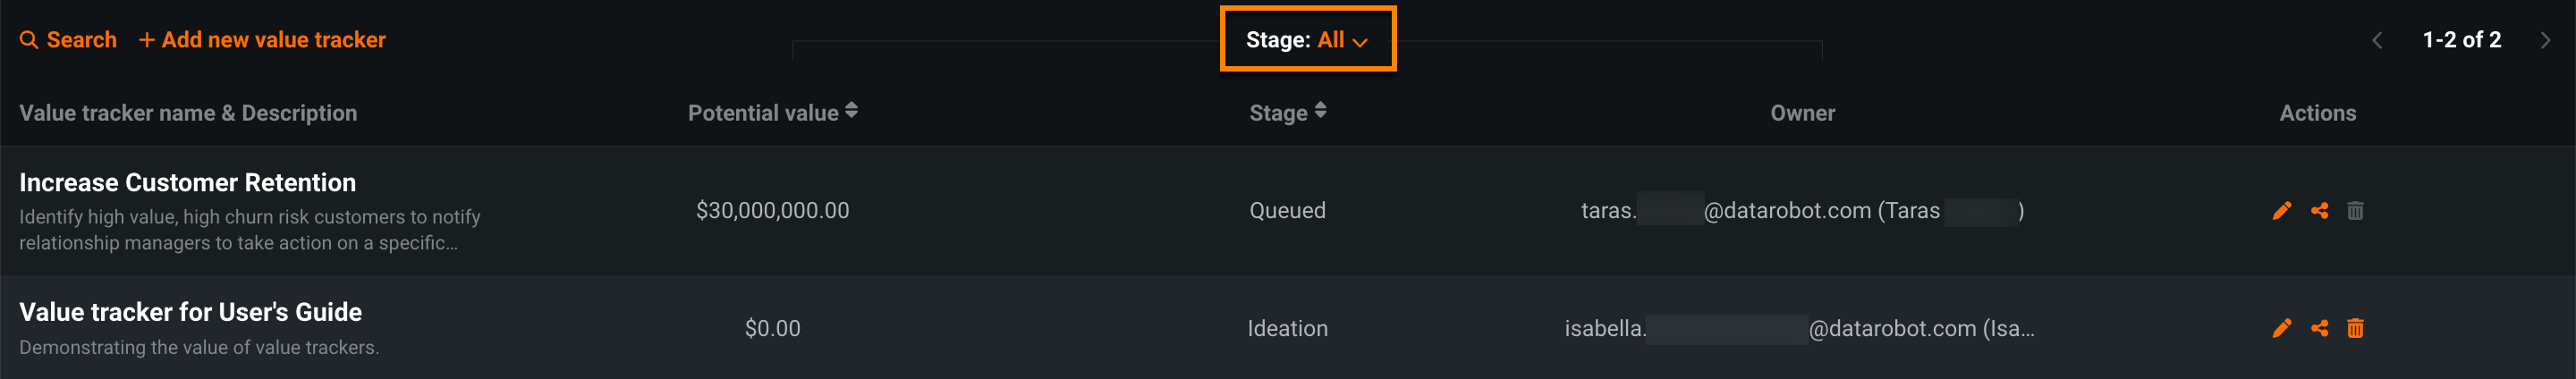
When filtering by stage, the contents of the chart will change based on what stage you filter by. See the table below for a description of the filtering options:
| Filter | Description |
|---|---|
| All | View basic information for each value tracker and perform any actions. |
| Ideation | View the value and business impact of the value tracker. |
| In Production | View the performance of deployed value trackers. |