User Activity Monitor
Availability information
For Managed Cloud AI users, the User Activity Monitor feature requires an upgraded package. If you do not see the monitor, and would like access, contact your DataRobot representative.
Availability information
Required permission: Enable organization level UAM
Availability information
Required permission: Enable Activity Monitoring
DataRobot continuously collects user and system data and makes it available to you through the User Activity Monitor (UAM). The tool provides a means for accessing and analyzing various usage data and prediction statistics. You can view reports online or export the data as CSV files. System information about the deployed cluster is available as well.
You can use this information to understand how DataRobot is being used, troubleshoot model or prediction errors, monitor user activities, and more. User activity data is available for review online and can be downloaded for offline access. Filters enable you to access and limit data records to specified time frames, users, and projects. The information provided in these reports proves invaluable to DataRobot Support when understanding your deployed system and resolving issues. You can also exclude sensitive identifying information from generated reports.
User activity types
Three types of user activity reports are available: Admin, App, and Prediction. See the report reference for fields and accompanying descriptions.
| Report Type | Description |
|---|---|
| Admin Usage | Provides a report of all administrator-initiated audited events. Information provided by this report can identify who modified an organization or an account and what changes were made. |
| App Usage | Provides information related to model development. This report can show models by user and identify the most commonly created types of models and projects, average time spent fitting each type of model, etc. |
| Prediction Usage | Provides a report with data around predictions and deployments. Information provided by this report can show how many models a user deployed, how predictions are being used, error codes generated for prediction requests, which model types generate the most predictions, and more. |
Self-Managed AI Platform admins, you can also download a report with system information (no online preview available).
| Report Type | Description |
|---|---|
| Admin Usage | Provides a report of all administrator-initiated audited events. Information provided by this report can identify who modified an organization or an account and what changes were made. |
| App Usage | Provides information related to model development. This report can show models by user and identify the most commonly created types of models and projects, average time spent fitting each type of model, etc. |
| Prediction Usage | Provides a report with data around predictions and deployments. Information provided by this report can show how many models a user deployed, how predictions are being used, error codes generated for prediction requests, which model types generate the most predictions, and more. |
| System Information | Provides a report with system information for the deployed cluster, such as installation type, operating system version, Python version, etc. Only accessible by download. |
Access the UAM
Some ways to access the User Activity Monitor:
-
From the profile icon located in the upper right, click User Activity Monitor to access all data in all reports for any users.
-
From the User Profile page for a specific user, click View Activity to view that user's events.
-
Once on an individual's activity page, remove the value in the User ID field and click Search to once again view all users.
-
From the User Profile you can quickly view the last five app events for the user.
View activity and events
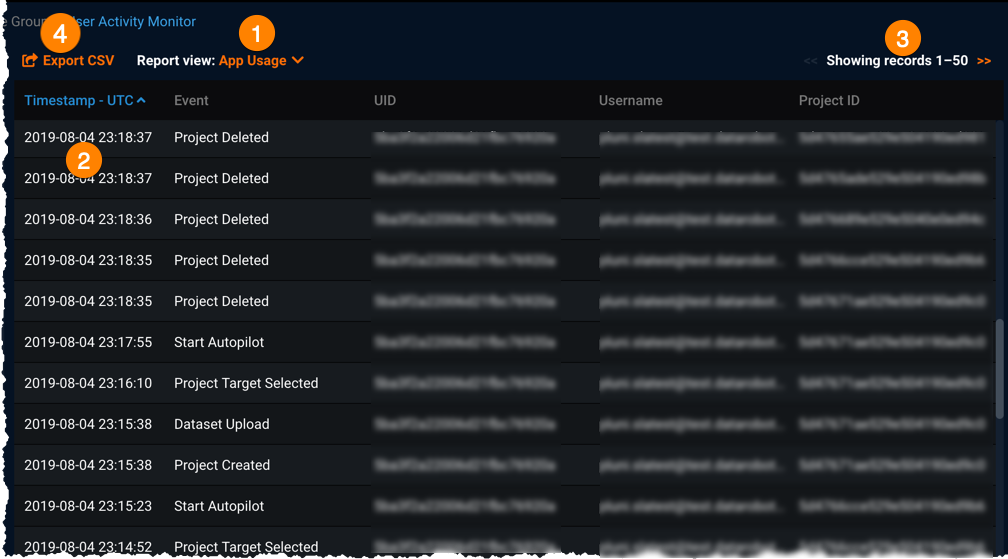
When you open the User Activity Monitor, you see the 50 most recently recorded application events. (By default, the User Activity Monitor displays data in descending timestamp order). You can change the displayed report and view different report data.

| Component | Description of use |
|---|---|
| Report view (1) | Selects the report view: App usage, Admin usage, or Prediction usage. (The System information report is not available to preview.) |
| Timestamp—UTC (2) | Sorts all records, in all pages, in ascending or descending timestamp order. |
| << or >> (3) | Pages forward or backward through the records. |
| Export CSV (4) | Exports and downloads the user events and system data to CSV files. |
Search report preview
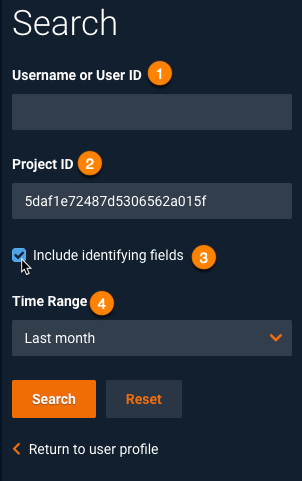
Use values in the Search dialog to filter the data returned for the selected online report view. Specify the filter values and click Search to apply the filter(s); the User Activity Monitor preview updates to show all records matching the filters.
Note
Search values apply to the online report preview only.
Click Reset to remove filters.
Note
The System Information report is not available for online report preview.

| Component | Description of use |
|---|---|
| Username or User ID (1) | Filters by username or user ID. For App Usage and Prediction Usage reports, you can additionally apply Project ID. If needed, you can copy the username, UID, or project ID values from the report preview and paste in the related search field. |
| Project ID (2) | Filters by project; for App Usage and Prediction Usage reports, you can additionally apply Username or User ID. The Project ID field is disabled for the Admin Usage report. |
| Include identifying fields (3) | Uncheck to hide "sensitive" information (columns display in the report without values). |
| Time Range (4) | Limits the number of records shown in the preview (previous year of records by default). You can select one of the predefined time ranges or specify a custom time range using the date picker*. (See restrictions when previewing the Prediction Usage activity report.) |
| Search or Reset | Generates the online preview of the report using the selected search filters or clears filters to view all available records. |
* To specify a custom range, use the calendar controls to select the start and/or end dates for the records. All time values use the UTC standard.
Prediction Usage preview
DataRobot can display up to 24 hours of data for the Prediction Usage online report preview. When applying a time range search filter for this report, select Last day or Custom range (and select a specific day). Note that this applies only when previewing the Prediction Usage activity report online; when downloading Prediction Usage activity report data, you can select any of the Time Range values provided in the Export reports as CSV dialog.
Download activity data
Clicking Export CSV to generate and download selected usage activity reports prompts you to filter which records to include when downloading reports. You can apply the same filters you created for online report preview or set new filters.


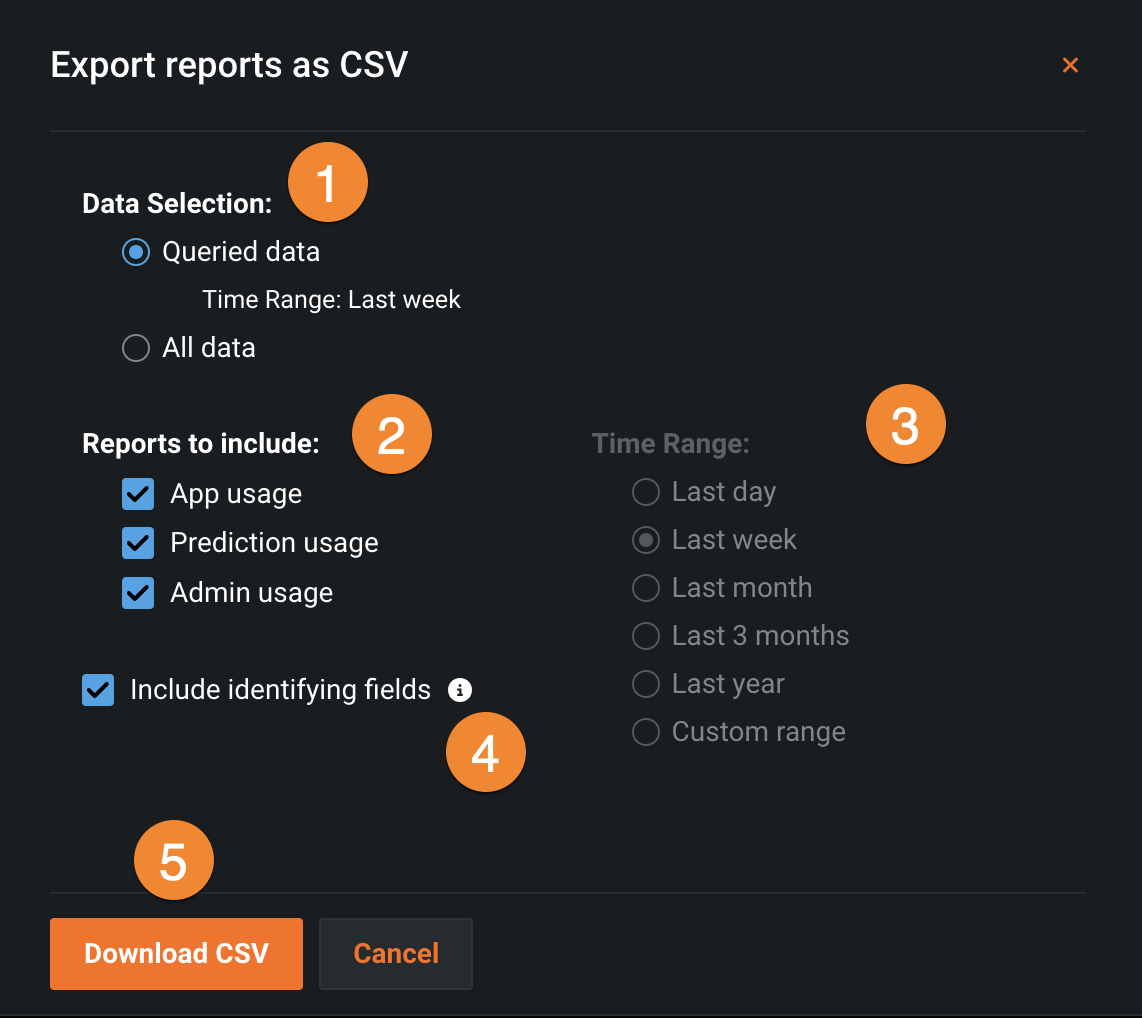
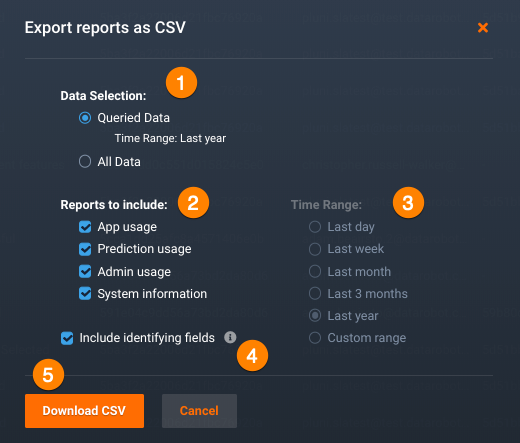
The Export reports as CSV dialog prompts you to configure and download reports of user activity data.
| Component | Description |
|---|---|
| Data Selection* (1) | Select Queried Data to apply the same time range filters you set when previewing reports or All Data to ignore any time range filters set for online preview. If you select All Data, you can then set new time range filters for downloading data. |
| Reports to include (2) | Select one or more reports to download. |
| Time Range* (3) | If you select All Data, you can set this filter: Specify the time range of records you want to include in the reports. The end time for each of these ranges is the current day. For example, Last day creates reports with data recorded starting 24 hours ago and ending at the current time. The default selection downloads records generated over the past year. |
| Include identifying fields (4) | If checked, downloaded reports include identifying information. |
| Download CSV (5) | Click Download CSV to save the selected report(s) to your local machine. The file is named with a randomly generated hash value and the current date (year-month-day).The filename for each report includes the DataRobot Platform version number, current date, and type of data for the report. |
* Fields do not apply to the System Information report.
When DataRobot indicates the selected report(s) are ready, click the link at the top of the application window to download a ZIP archive of the usage report CSV files to your local machine.

Note
The time to create and download reports depends on the time range for the data and number of reports. DataRobot creates the reports for export in the background and notifies you when the reports are ready for download.