Data science agent
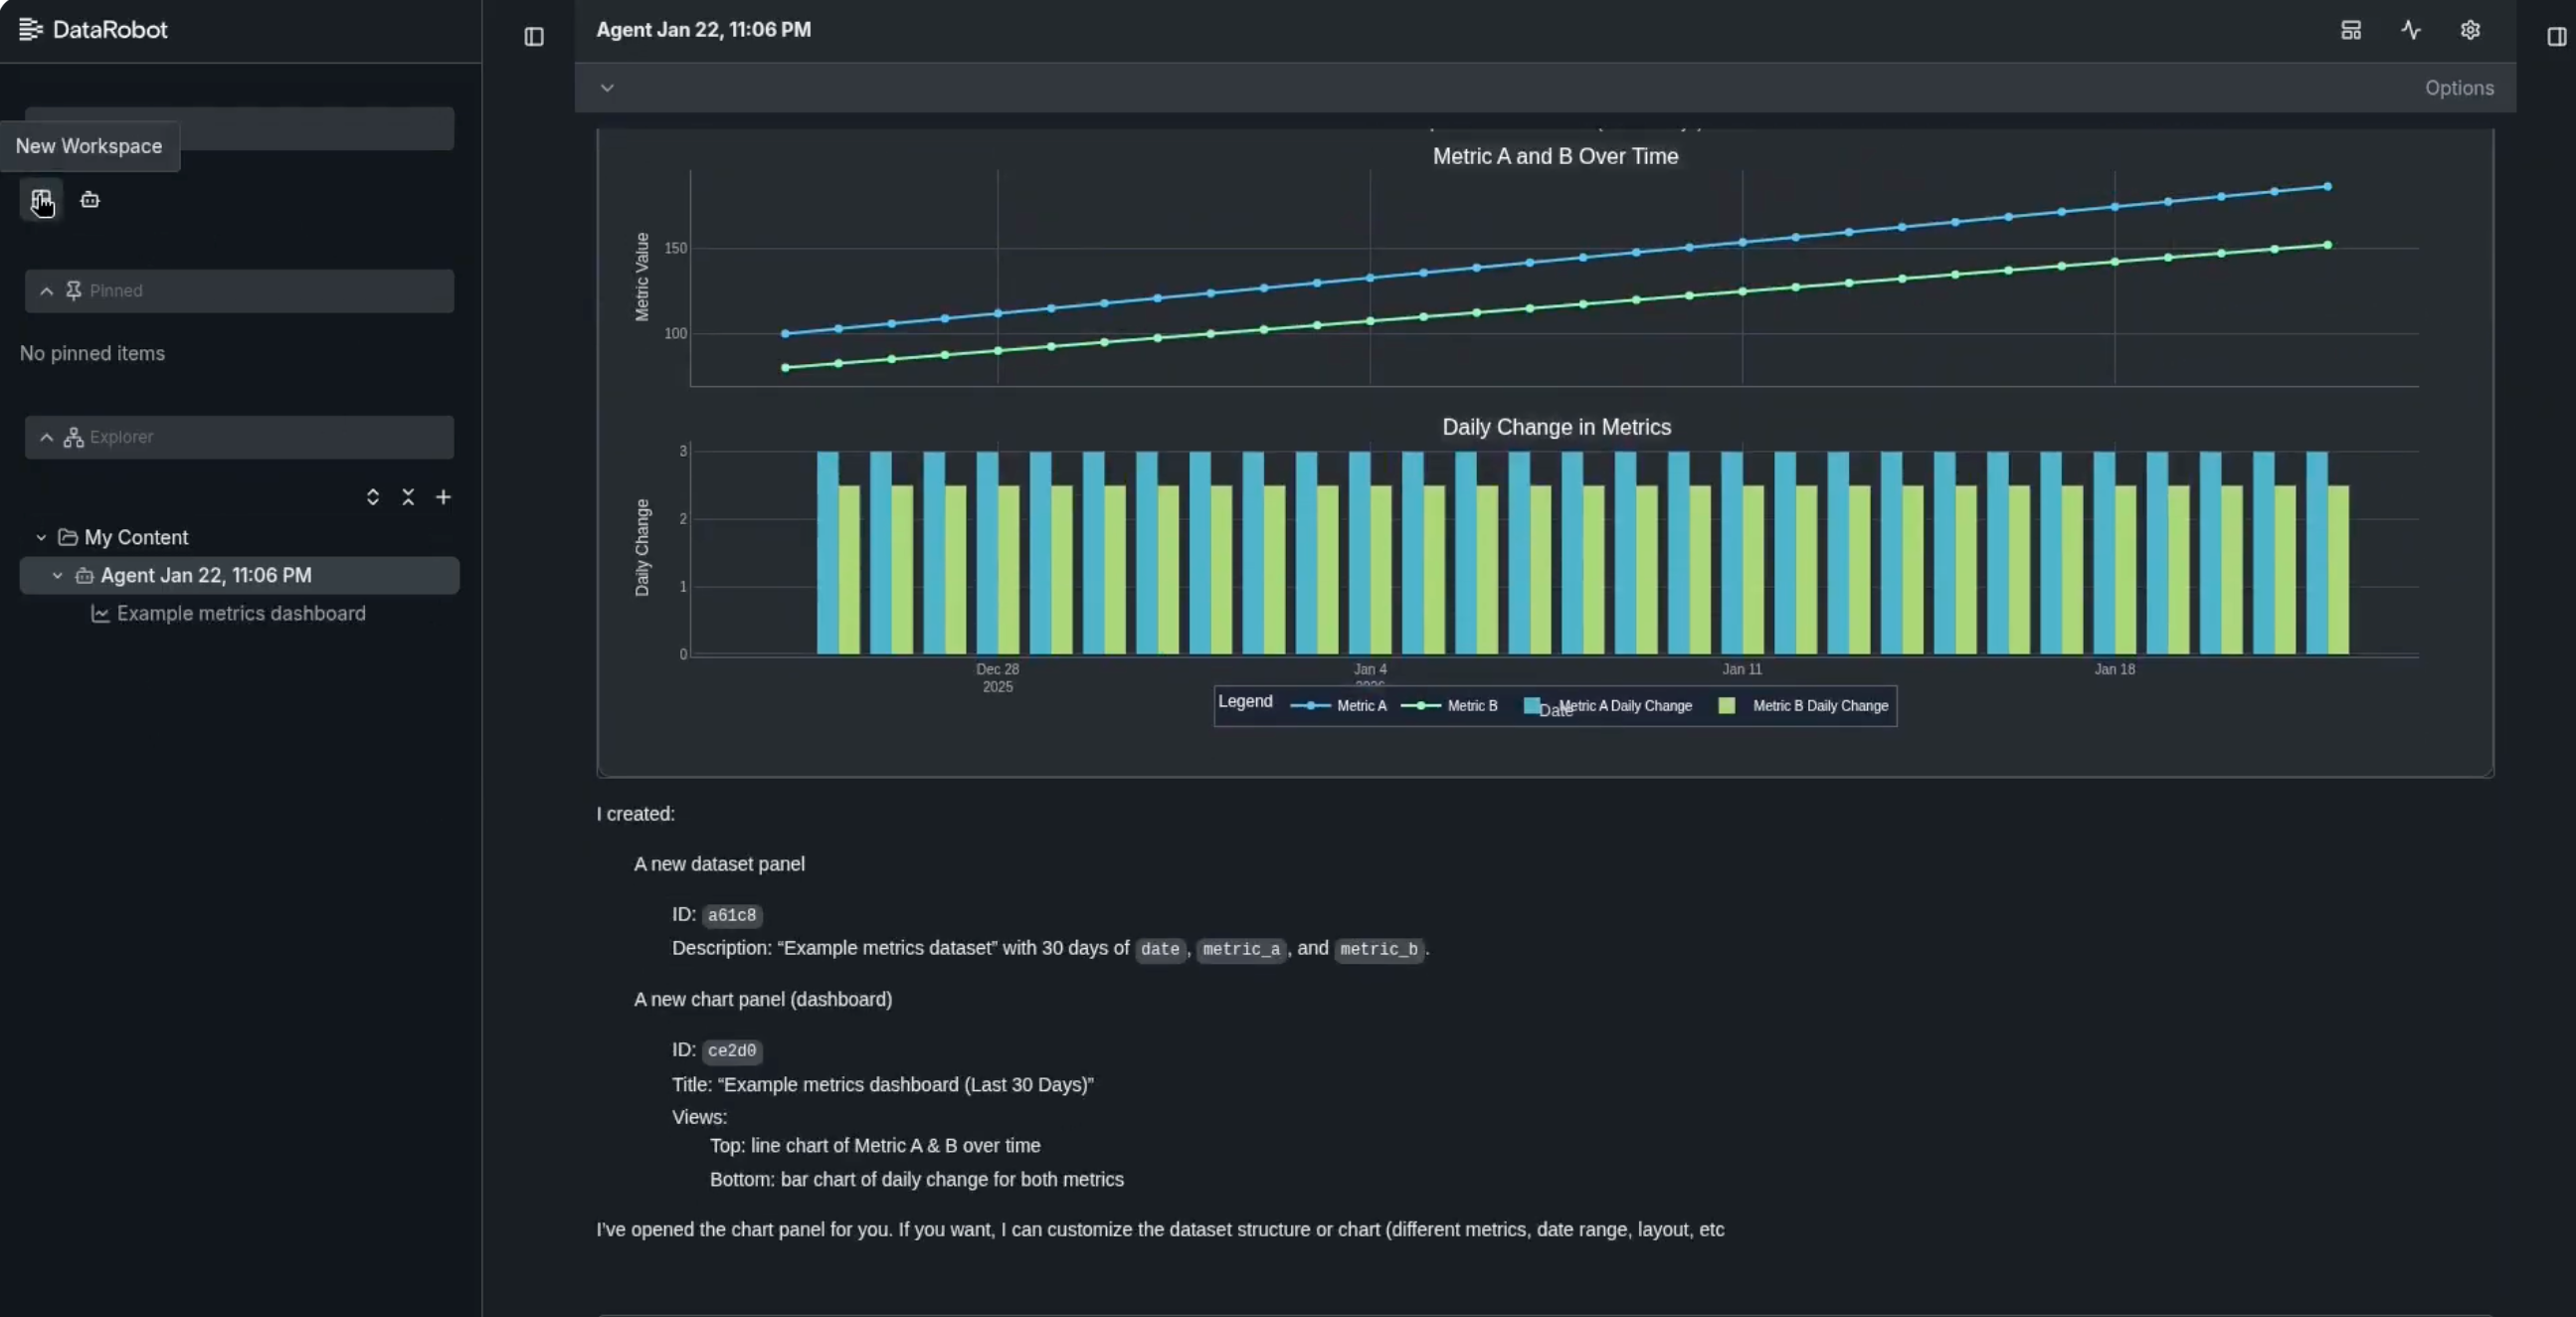
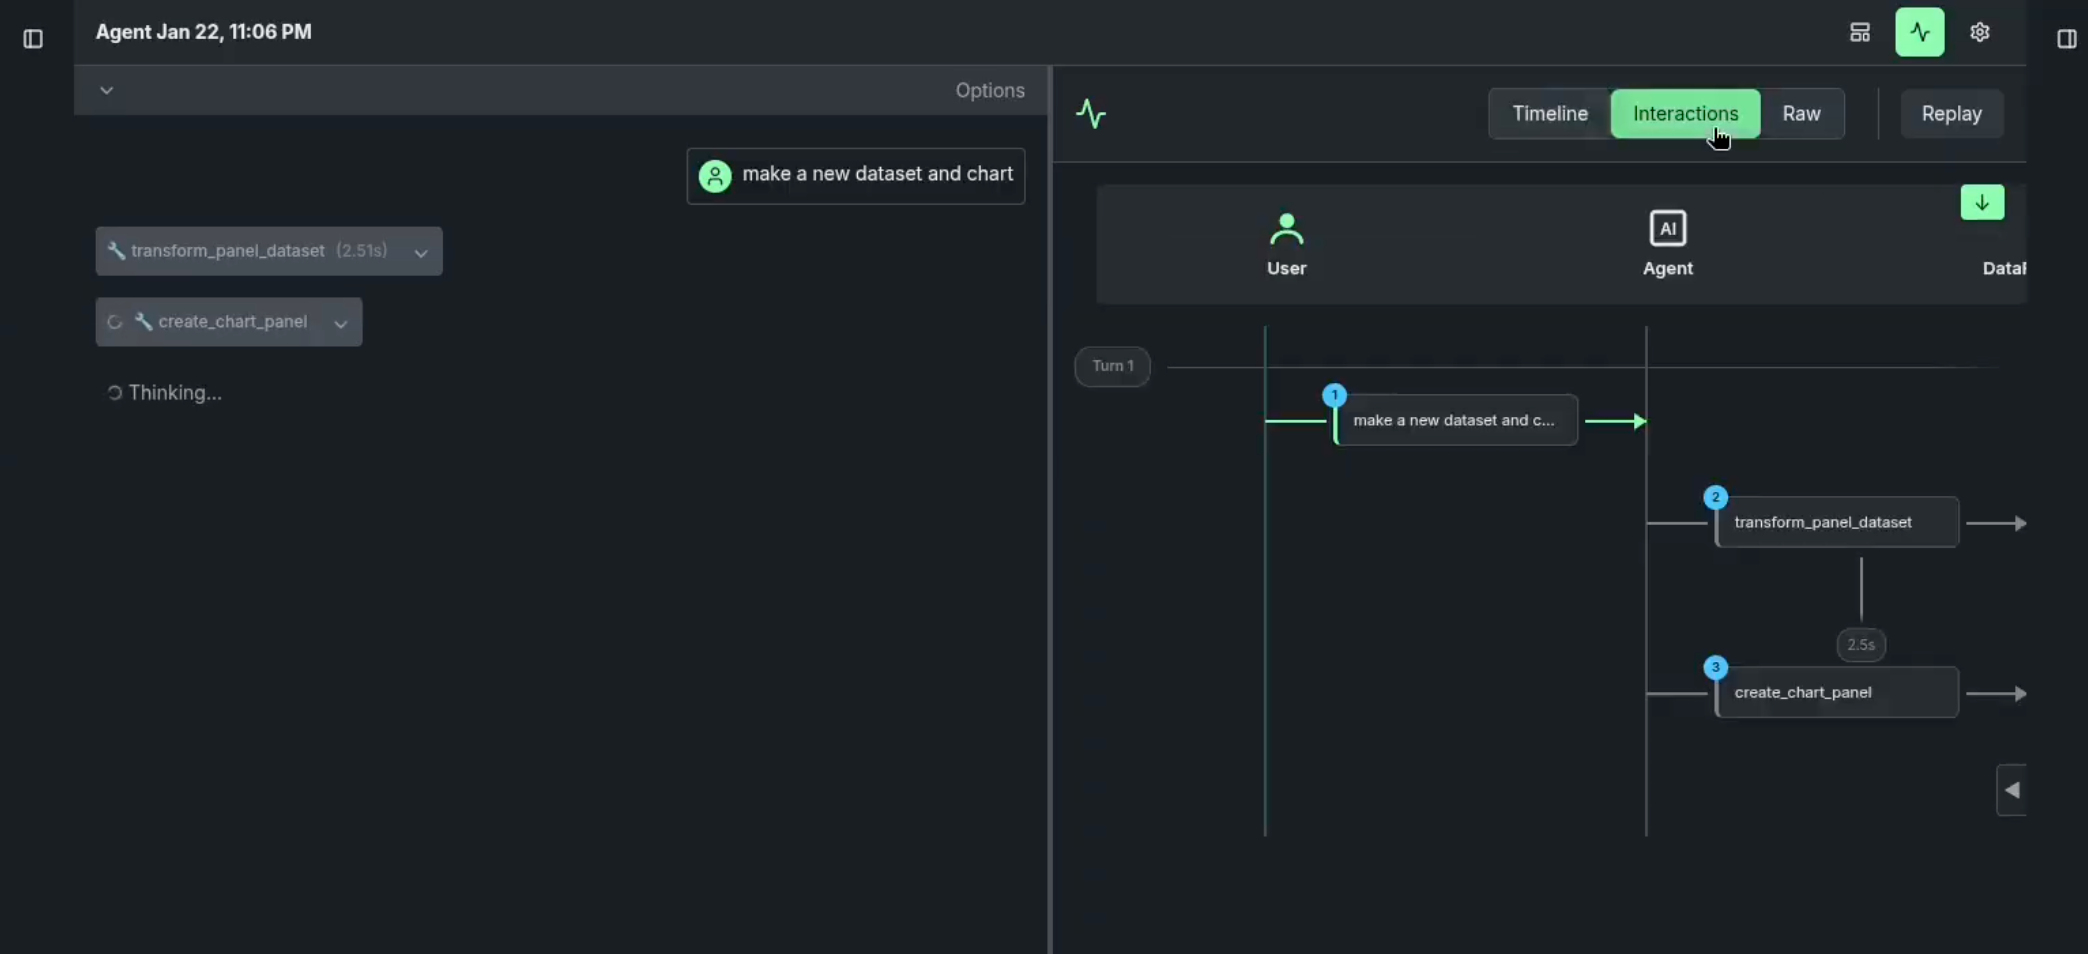
The data science agent provides an audit trail of data preparation actions that the agent took on your behalf. As it iterates, it creates an audit trail that not only allows you to find and modify based on output, but enhances agent governance by creating snapshots of the data as each tool in the agent makes changes. The result is a data panel artifact—the output created by the agent. The panels create a metadata record that represent each point in the agent's data transformation lifecycle. An artifact can move between steps of a machine learning pipeline, without having to hard-code file paths. In this way, for reproducibility purposes, you don't have to find the original data but can instead use the agent to recreate it based on snapshot IDs.
Agent overview
You can build the Data Science Agent application using a low-code/no-code approach that then allows you to create and deploy autonomous AI agents that can:
-
Execute multistep tasks. The agent creates workspaces, navigates dashboards, adjusts settings, and saves configurations without step-by-step prompting.
-
Persist states. Workspaces and agent configurations survive application restarts, maintaining context across sessions.
-
Interact with data. Agents can connect to datasets and data stores, and run machine learning models to make predictions.
-
Operate through natural language. Simply describe what you want and the agent calculates the implementation steps.
Consider this high-level overview workflow:
-
Create a codespace.
-
Tell the agent what you want to do (creation).
-
Point to the tools on the MCP server that will implement data prep steps.
-
Review the agent output and adjust as necessary.
The sections below broadly outline the process in DataRobot, using an MCP server for tool calls and human-in-the-loop review for authentication and governance.
Technical implementation
The agent system is powered by:
- An underlying LLM.
- MCP servers for extensibility.
- A backend system with configurable system prompts that define agent behavior.
- A workspace-based architecture where agents can be created, customized, and managed through a UI.
Creation and persistence
The Data Science Agent process allows you to spin up an environment where you can instantiate new agents with a single click.
-
Memory: Unlike a basic LLM, these agents are persistent. That is, if you shut down the session and restart it, the agent and its associated "workspace" remain intact.
-
Customization: You can modify the system prompt in the backend code to change how the agent behaves, what its goals are, and how it interacts with the user.
Use tools
Agents do more than just respond to prompts. They integrate into an ecosystem, which allows them to:
-
Leverage MCP servers: With code that includes an MCP (Model Context Protocol) server call, the agent has a standardized way to connect to external tools and data sources securely.
-
Interact with data: Using the MCP tools, the agent "talks" to data stores, data sets, and even DataRobot.
-
Execute tasks: The agent can then run machine learning models, make predictions, and manage a "workspace" or dashboard.
Human/agent collaboration
The agent acts as a bridge between the user and complex technical tasks:
-
UI management: The agent can help build or modify the layout of the results dashboard.
-
Code-level access: Because the entire agent stack is running in a codespace, the user can go "under the hood" to edit the agent's logic in or change its instructions, while the agent handles the high-level execution.
-
Panel review: With each snapshot having a unique ID, a review of the output against the snapshots helps identify areas for improvement.
End-to-end example
Consider the following simple agentic workflow:
| User input | Agent response | Panel artifact |
|---|---|---|
| What are the most recently received products? | Based on our product database in 2025, we released 4 color variations of our crew neck t-shirt: Lavender, Jade Green, Mauve, and Burnt Sienna | None |
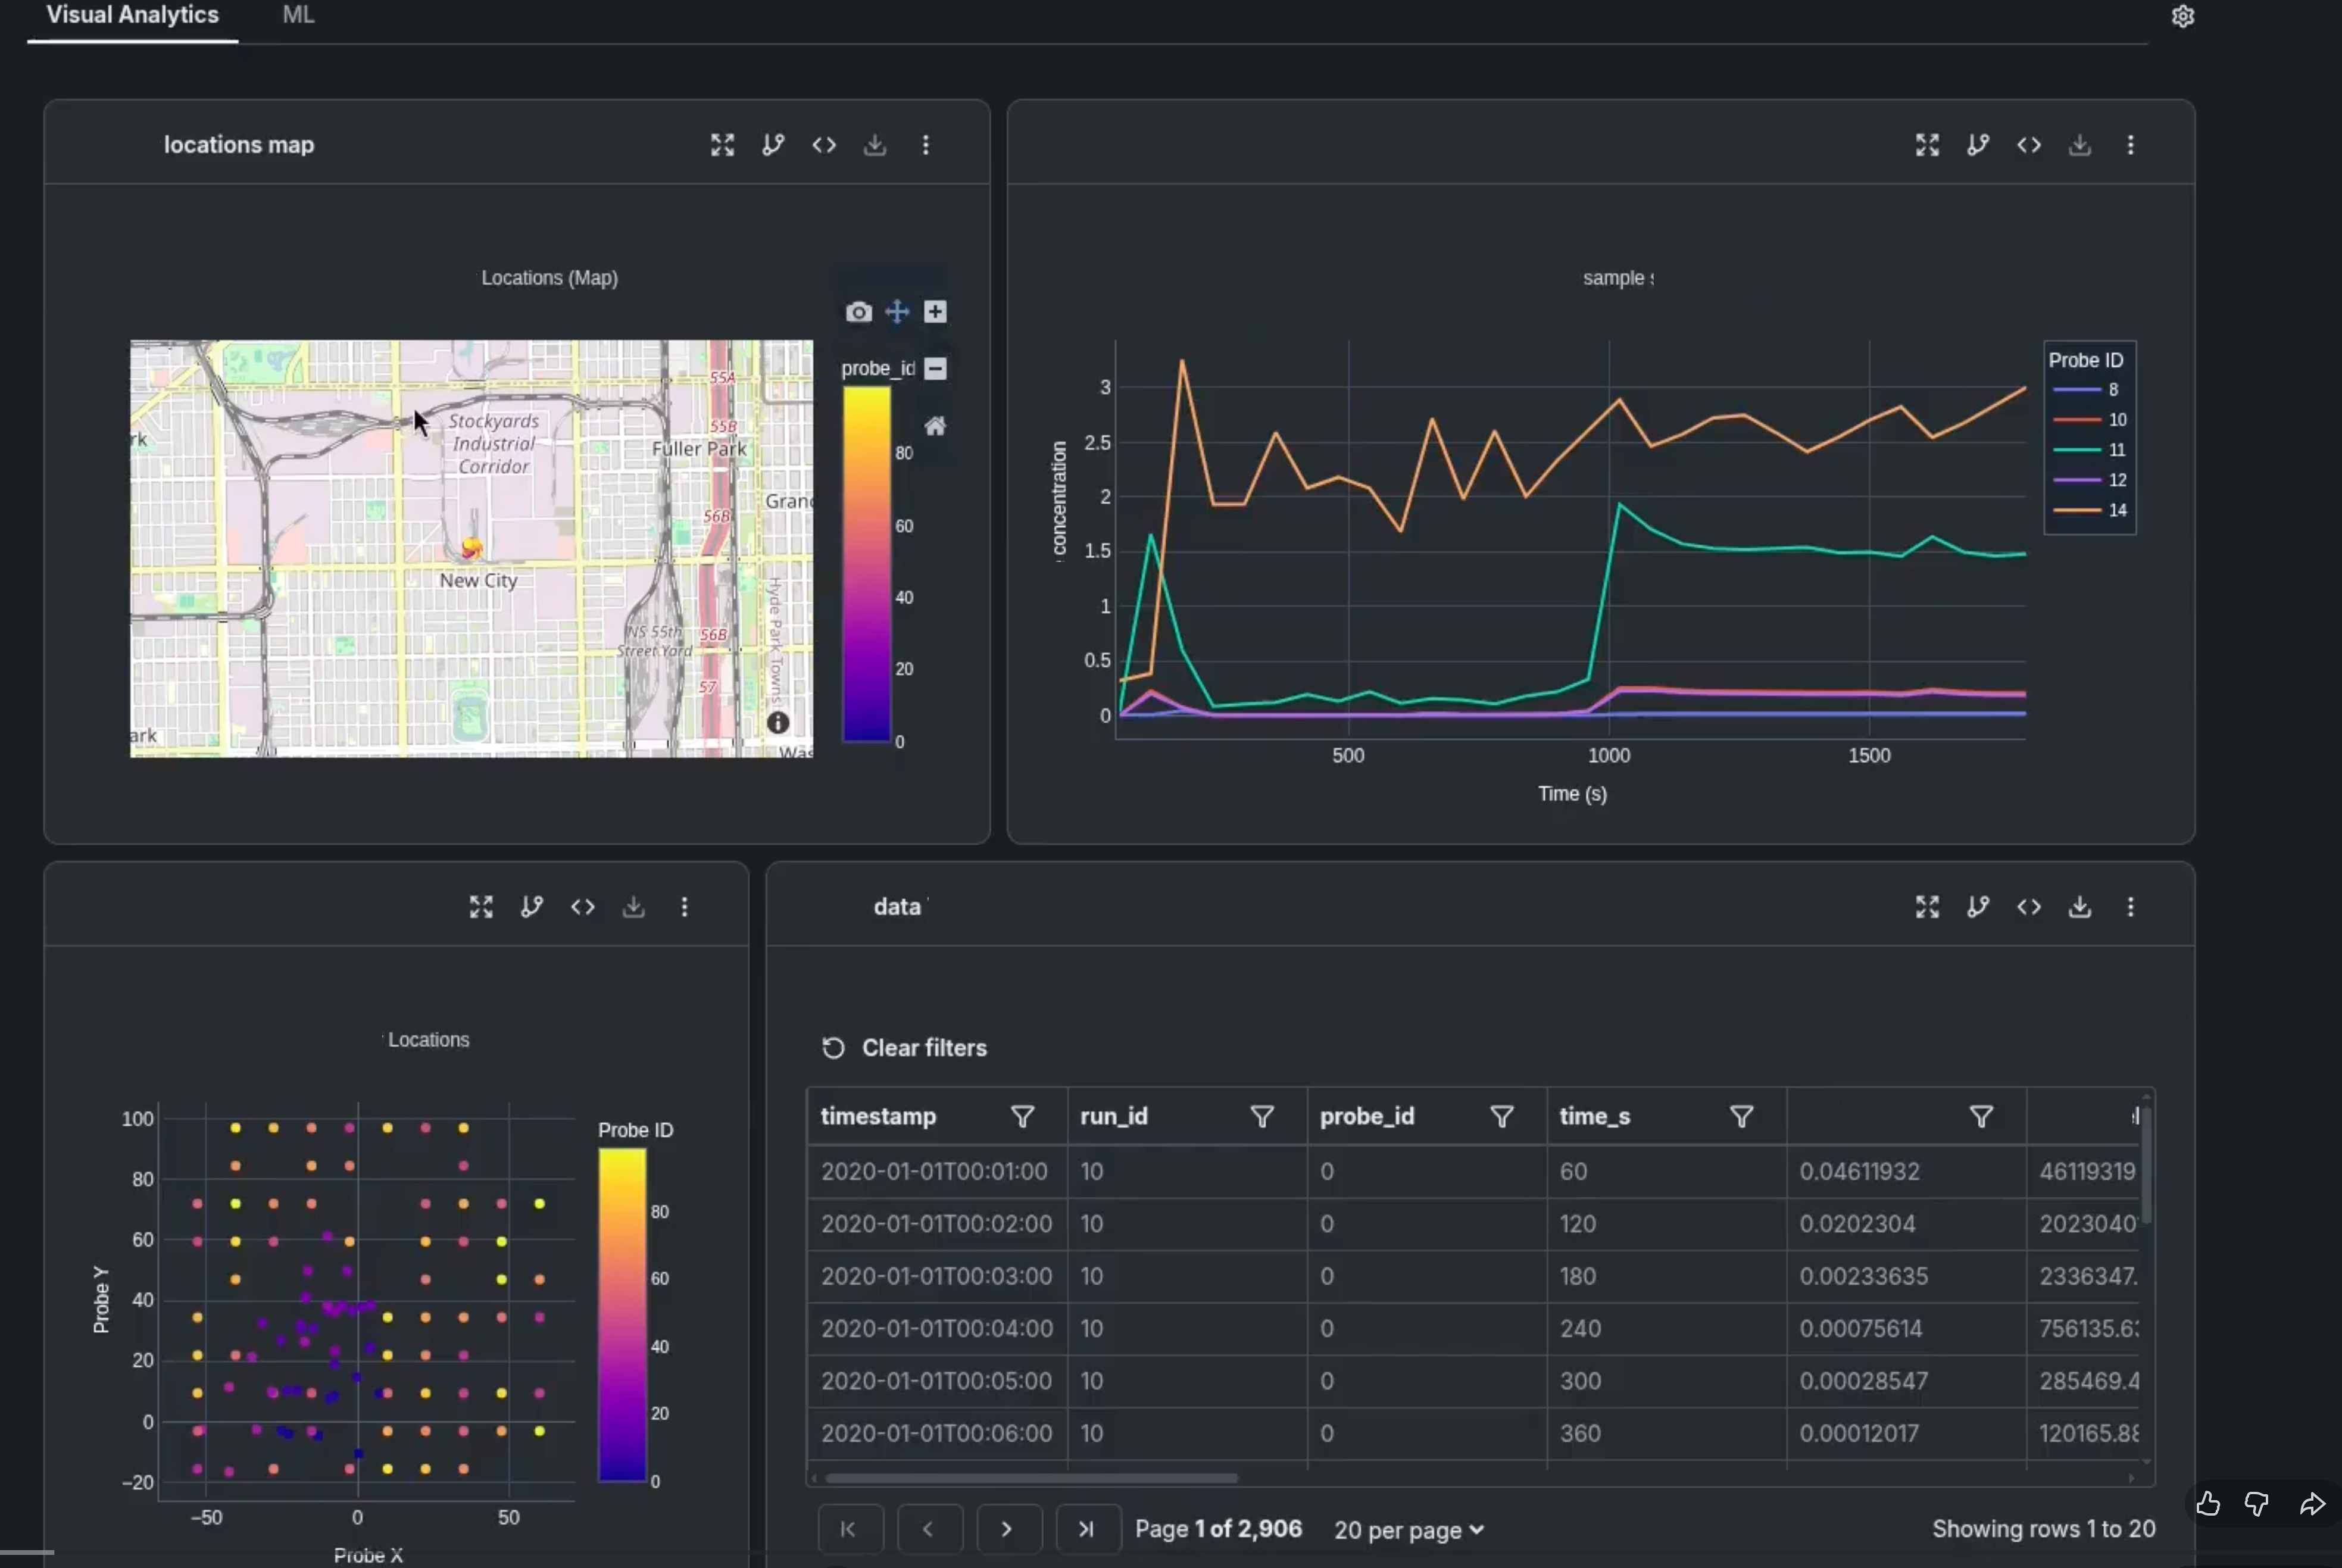
| How are sales? | Sales are good for Lavender but lower for the other new colors | Data table: Results from querying the sales of the four products. Chart: Bar chart of total sales by each new color released. |
This two-question inquiry yields two panels. First a data table that shows the sales of each new variation, and second, a chart that shows the results.
Fundamentally, a panel is simply YAML output in a specific format that, when recognized by a client, renders the output in particular display format. Here is sample code of the dataset panel referenced above:
id: 6531c
type: dataset
payload_path: resources/6531c.parquet
parents: []
title: |
  Mexican perishable goods import data with tariff impact calculations - updated
  query
description: null
src: |-
 SELECT "p"."id" AS "product_id", "p"."name" AS "product_name", "p"."category", "s"."id" AS "supplier_id",
        "s"."name" AS "supplier_name", "s"."country" AS "supplier_country",
        sum("isi"."quantity") AS "total_import_volume", sum("isi"."total_cost") AS "total_import_cost",
        avg("isi"."unit_cost") AS "avg_unit_cost", avg("isi"."unit_cost") * 1.25 AS "unit_cost_with_tariff",
        sum("isi"."total_cost") * 1.25 AS "total_cost_with_tariff", sum("isi"."total_cost") * 0.25 AS "tariff_cost_increase",
        "s"."lead_time_days" AS "supplier_lead_time", "s"."reliability_score" AS "supplier_reliability",
        substring("isi"."order_date", 1, 7) AS "order_month"
 FROM "products" "p"
 JOIN "inbound_shipment_items" "isi" ON "p"."id" = "isi"."product_id"
 JOIN "suppliers" "s" ON "isi"."supplier_id" = "s"."id"
 JOIN "inbound_shipments" "ins" ON "isi"."shipment_id" = "ins"."id"
 WHERE "s"."country" = 'Mexico'
     AND "p"."is_perishable" = 1
 GROUP BY "p"."id", "p"."name", "p"."category", "s"."id", "s"."name", "s"."country",
          "s"."lead_time_days", "s"."reliability_score", substring("isi"."order_date",
                                                             1, 7)
 ORDER BY "total_import_cost" DESC
src_type: sql
vspan: 1
hspan: 2
An agent can invoke the panel display by including conformant YAML in its response. In the reference implementation, YAML in responses is identified in three ways:
- Identify
xml tags in the response. - Identify three backticks denoting a code block where the content validates as YAML.
- Identify a block denoted by two consecutive new lines where the block content validates as YAML.
Panel class hierarchy
All panels derive from a BasePanel base class and must contain the following base attributes:
interface BasePanel {
  id: string;
  type: "chart" | "dataset" | "text" | "video";
  src: string;
  author: string;
  created_at: string; // ISO-formatted creation datetime.
  parents: string[]; // References the parent or linked panel.
}
Each panel type extends this base interface with additional properties specific to that panel type.
Installation
Add panels with npm or yarn. Import only the components you need for a minimal bundle size. Then, create your first panel with just a few lines of code.
npm install agent-panels
# or
yarn add agent-panels
Once installed, you can import the components you need:
import {
  DatasetPanel,
  TextPanel,
  ChartPanel,
  VideoPanel,
  usePanel,
} from "agent-panels";
Chart and dataset panels can reference payloads that are required to render the panel correctly. Payloads should refer to a file location accessible to the client (like an S3-backed URL) or should reference an MCP resource URI.
Panel types
Text panel
The text panel component is used for displaying formatted text content with markdown support. It is a good choice for summarizing research or providing a record of agent activity:
<TextPanel
  panelSpec={{
    id: "text-example",
    type: "text",
    title: "Research Summary",
    text: "# Research Findings\n\nOur analysis shows that **customer satisfaction** increased by 27% after implementing the new feedback system.",
  }}
/>
For example:
<TextPanel panelSpec={{ id: "text-example", type: "text", title: "Text Panel Example", text: "# Hello World\nThis is a markdown example with formatting." }} />
Dataset panel
The dataset panel is for displaying and interacting with tabular data with filtering, sorting, and pagination capabilities:
<DatasetPanel
  panelSpec={{
    id: "dataset-example",
    type: "dataset",
    title: "Sales Performance Data",
    description: "Quarterly sales data by region and product category",
  }}
  dataUrl="https://storage.googleapis.com/public-image-assets/public_panels/sample-data.parquet"
/>
Chart panel
The chart panel represents a graphic that will be presented on the client. Specifically, a chart should reference both its graphical representation (by linking to a payload) and a dataset panel (through a parent panel reference). The chart panel creates visualizations of your data using libraries like Plotly:
<ChartPanel
  panelSpec={{
    id: "chart-example",
    type: "chart",
    title: "Monthly Revenue Trends",
    chartType: "bar",
    data: {
      labels: ["Jan", "Feb", "Mar", "Apr", "May"],
      datasets: [
        {
          label: "Sales 2023",
          data: [65, 59, 80, 81, 56],
        },
      ],
    },
  }}
/>
Video panel
The video panel is used to display video content with playback controls and annotation markers:
<VideoPanel
  panelSpec={{
    id: "video-example",
    type: "video",
    title: "Product Demo",
    src: "https://example.com/product-demo.mp4",
    src_type: "video",
    annotations: [
      { timestamp: "00:45", content: "Interface overview" },
      { timestamp: "02:30", content: "Advanced features demonstration" },
    ],
  }}
/>
The usePanel hook
The usePanel hook simplifies data fetching and state management for all panel types:
import { usePanel } from "agent-panels";

function MyComponent() {
  const panelProps = usePanel({
    specUrl: "path/to/panel-spec.yaml",
    dataUrl: "path/to/data.parquet",
  });

  return <DatasetPanel {...panelProps} />;
}