DataRobotエクスペリメントプラグイン
The DataRobot experimentation plugin (dr xp) exposes a local dashboard during agentic application development. The dashboard runs on port 8090 by default and organizes observability into tabs. The Traces tab is available as soon as the plugin is installed; additional tabs require feature flags and optional components.
The plugin uses the same OpenTelemetry standard that carries telemetry across the rest of the stack. Local traces follow the same tracing model as deployed agents on the DataRobot platform, so local inspection reflects what the agent actually did during development without deploying to the platform or switching to a separate UI tab.
Access the dashboard
Complete these steps to open the local experimentation dashboard:
- Install the CLI—
curl https://cli.datarobot.com/install | sh; verify withdr self version. See Install the CLI and authenticate. - Authenticate—
dr auth login. - Install the plugin—
dr plugin install xp; verify withdr plugin list. See Install the experimentation plugin. - Create or open a project—
dr startfrom an Agentic Starter template; confirmDATAROBOT_USE_CASE_IDinpulumi_config.json. See Set up the App Framework project. - Start the agent and dashboard—Run
dr run devfrom the project root. To launch the dashboard separately, start the agent withtask agent:devin one terminal, then rundr xp --entity-id <USE_CASE_ID>in another. See Start the experimentation dashboard. - Open the GUI—browse to
http://localhost:8090. See Open the GUI in a browser. - Confirm traces—send a test message to the agent, refresh the Traces tab. See Confirm end-to-end behavior.
For batch evaluation workflows, also install the evaluation component and set DR_EXPERIMENT_ENABLE_EVALUATION=true in .env. See Batch agent evaluation.
Choose your path
| Goal | ここから開始 |
|---|---|
| Inspect agent traces during local development | Local tracing—Traces tab (default). |
| Score agent responses on a fixed benchmark dataset | Batch agent evaluation—Evaluation tab (preview; requires --enable-evaluation). |
Both paths share the same setup: install the CLI, install the xp plugin, set up an App Framework project, and open the GUI.
機能
| Tab / capability | Doc | 要件 |
|---|---|---|
| Traces | Local tracing | Plugin installed; agent running. |
| 評価 | Batch agent evaluation | --enable-evaluation, evaluation component installed (preview). |
Future tabs (logs, metrics, MCP tool collections) follow the same pattern: one doc page per tab, enabled by a feature flag. Run dr xp --help for the current flag list.
Local development stack
Agentic Starter templates run several services during local development. The commands and ports referenced throughout this page assume this stack:
| ポート | サービス |
|---|---|
8090 |
Experimentation dashboard (dr xp GUI). |
8842 |
Local agent OpenAI-compatible endpoint. |
5173 |
Frontend dev server. |
8080 |
FastAPI backend. |
9000 |
MCP server (configurable via MCP_SERVER_PORT). |
Ports 8090, 8080, and 5173 are fixed in Agentic Starter templates. The agent port (8842) is set during the dr start wizard.
クイックスタート
<USE_CASE_ID> below is your App Framework project's use case ID—see Prerequisites.
# Install the plugin
dr plugin install xp

# Show available options
dr xp --help

# Start with a use case (traces only)
dr xp --entity-id <USE_CASE_ID>

# Enable batch evaluation workflows in the GUI
dr xp --enable-evaluation --entity-id <USE_CASE_ID>

# Start with a deployment on a custom port
dr xp --entity-type deployment --entity-id <DEPLOYMENT_ID> --port 8091
重要
Batch evaluation workflows in the GUI are off by default. Pass --enable-evaluation (or set DR_EXPERIMENT_ENABLE_EVALUATION=true) when starting dr xp to expose the Evaluation tab and evaluation API routes. Traces work without this flag. See Enable batch evaluation workflows.
When dr run dev runs from an Agentic Starter project, the local tracing dashboard starts automatically on port 8090. The bundled dashboard starts with traces only unless DR_EXPERIMENT_ENABLE_EVALUATION=true is set in .env.
Access the GUI
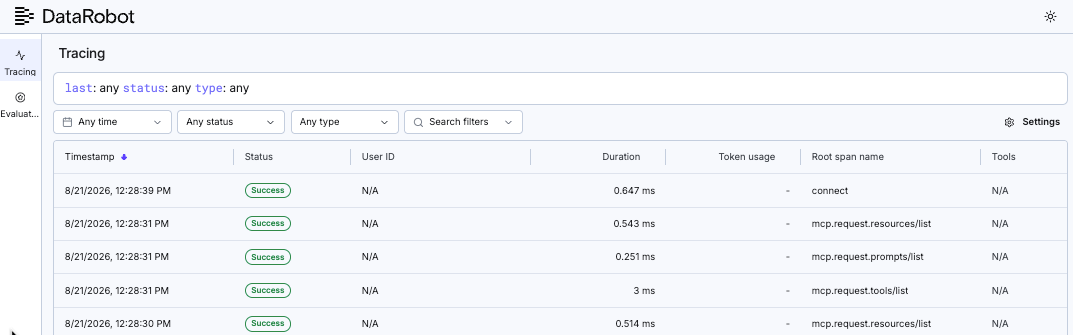
The experimentation plugin serves a web UI from a local HTTP server. The CLI installs and launches the plugin; the browser connects to the server URL after startup completes.
前提条件
Before starting the dashboard, confirm the following:
| 要件 | 備考 |
|---|---|
| DataRobot CLI | Install with the getting started guide; verify with dr self version. |
| CLI authentication | Run dr auth login or configure credentials in ~/.config/datarobot/drconfig.yaml. |
| Experimentation plugin | Install with dr plugin install xp; verify with dr plugin list. |
| App Framework project | Required for entity context; create with dr start or clone an Agentic Starter template. |
| Use case ID | Stored in pulumi_config.json as DATAROBOT_USE_CASE_ID, or pass --entity-id explicitly. |
After confirming the prerequisites, complete the following sections in order (or jump straight to a step using the links in Access the dashboard above).
Install the CLI and authenticate
- Install the DataRobot CLI:
curl https://cli.datarobot.com/install | sh
- Verify the installation:
dr self version
- Authenticate with DataRobot:
dr auth login
The plugin requires authentication. The CLI passes DATAROBOT_ENDPOINT and DATAROBOT_API_TOKEN to the plugin process at launch.
Install the experimentation plugin
Install the xp plugin once per machine:
dr plugin install xp
Verify discovery:
dr plugin list
Confirm the list includes xp with a path under ~/.config/datarobot/plugins/xp/ (Linux and macOS) or the equivalent Windows config directory.
Set up the App Framework project
-
Create or open an Agentic Starter project:
dr start -
Confirm
pulumi_config.jsonat the project root contains a use case ID:"DATAROBOT_USE_CASE_ID": "<USE_CASE_ID>" -
(Optional)
dr component add https://github.com/datarobot-community/af-component-evaluation . -
From the evaluation component directory (for example
evaluations/), install dependencies:task install
See Batch agent evaluation for prerequisites and setup details.
Configure the dashboard
Set options with flags, environment variables, or a project-level .dr-xp.yaml file. Flag values take precedence over environment variables, then config files, then pulumi_config.json.
The following table summarizes the most common settings:
| 設定 | Flag | 環境変数 | デフォルト |
|---|---|---|---|
| ポート | --port |
DR_EXPERIMENT_PORT |
8090 |
| エンティティタイプ | --entity-type |
DR_EXPERIMENT_ENTITY_TYPE |
experiment_container (use case) |
| エンティティID | --entity-id |
DR_EXPERIMENT_ENTITY_ID |
DATAROBOT_USE_CASE_ID from pulumi_config.json |
| Evaluation workflows | --enable-evaluation |
DR_EXPERIMENT_ENABLE_EVALUATION=true |
Off; pass the flag to enable batch evaluation workflows. |
| Plain terminal output | --plain-output |
— | Off (TUI panel shown by default). |
Example project-level config file:
# .dr-xp.yaml (project root)
entity_type: experiment_container
port: 8090
# enable_evaluation: true   # or set DR_EXPERIMENT_ENABLE_EVALUATION=true in .env
For Agentic Starter projects, add evaluation support to .env:
# .env (project root) — enables Evaluation tab with dr run dev / task infra:dev
DR_EXPERIMENT_ENABLE_EVALUATION=true
For judge-based evaluations, also set credentials in .env:
DATAROBOT_API_TOKEN=<API_TOKEN>
DATAROBOT_ENDPOINT=https://app.datarobot.com/api/v2
Judge-free benchmarks run without judge credentials. See Batch agent evaluation.
Start the local agent
The dashboard visualizes traces from agent activity. Batch evaluations require a running agent endpoint.
Start the full development stack from the project root:
dr run dev
This typically starts the agent on http://localhost:8842/v1 and may also launch the dashboard on port 8090. See Quick start for the flag/env var that enables the Evaluation tab.
To start services individually:
task agent:dev      # Agent on port 8842.
task infra:dev      # Dashboard on port 8090.
When task dev runs, dr xp may start from both agent:dev and infra:dev. The message Already running at http://127.0.0.1:8090 is expected.
Start the experimentation dashboard
Choose one of the following options.
Standalone start
From the App Framework project root:
dr xp --entity-id <USE_CASE_ID>
Add --enable-evaluation when the Evaluation tab is needed. See Enable batch evaluation workflows.
Infra task (Agentic Starter projects)
task infra:dev
This runs dr xp --plain-output without --enable-evaluation. To enable batch evaluation workflows, set DR_EXPERIMENT_ENABLE_EVALUATION=true in the project .env.
Bundled with full dev
dr run dev
Expected startup output:
Starting server...
Local Experimentation running on http://127.0.0.1:8090 for experiment_container:<USE_CASE_ID>
If a server is already listening on the port, the CLI prints:
Already running at http://127.0.0.1:8090 — no new server started.
The server runs in the foreground. Stop it with Ctrl+C.
Verify the server (optional)
Confirm the dashboard responds:
curl -s http://127.0.0.1:8090/api/info
Example response with evaluation enabled:
{"entity_type":"experiment_container","entity_id":"<USE_CASE_ID>","features":["traces","evaluation"]}
When evaluation is disabled, features contains "traces" only and evaluation API routes return 404.
Open the GUI in a browser
Open one of the following URLs:
| 環境 | URL |
|---|---|
| Local machine | http://localhost:8090 or http://127.0.0.1:8090. |
| DataRobot codespace or notebook | Exposed-port URL for port 8090 (shown when dr run dev or task dev completes). |
The page title is Experimentation UI. Available tabs depend on enabled features:
| タブ | Doc | 要件 |
|---|---|---|
| Traces | Local tracing | Plugin installed and agent running. |
| 評価 | Batch agent evaluation | --enable-evaluation (or DR_EXPERIMENT_ENABLE_EVALUATION=true) and the evaluation component installed. |
Confirm end-to-end behavior
- Send a test message to the agent (for example at
http://localhost:5173). - Refresh the dashboard. A new trace appears in the Traces tab. See Local tracing.
- (Optional) See Batch agent evaluation.
GUI access troubleshooting
| 症状 | Fix |
|---|---|
dr: command not found |
Reinstall the CLI or add the binary directory to PATH; see Getting started. |
| Plugin not found | Run dr plugin install xp. |
| Missing entity ID | Run dr start to create pulumi_config.json, or pass --entity-id <USE_CASE_ID>. |
Port 8090 already in use |
List the process with lsof -i :8090 (macOS/Linux), note the PID, and run kill <PID>. On Windows, run netstat -ano | findstr :8090, then taskkill /PID <pid> /F. Alternatively, start on another port with --port 8091. |
| No Evaluation tab | See Evaluation troubleshooting. |
| No traces in the dashboard | See Tracing troubleshooting. |
Evaluation APIs return 404 |
The running instance was started without --enable-evaluation; restart with the flag enabled. |
Configuration reference
Use these options when non-default entity types, ports, or environment-based configuration is required.
Command options
dr xp --entity-type [TYPE] --entity-id [ID] --port [PORT] [--enable-evaluation] [--plain-output]
The server runs in the foreground and logs to the terminal. Stop it with Ctrl+C. For a step-by-step walkthrough, see Access the GUI.
--entity-idは必須です(存在する場合、pulumi_config.json内のDATAROBOT_USE_CASE_IDにフォールバックします)。--entity-typedefaults toexperiment_container(use case). Also accepts the aliasuse_case.--enable-evaluationenables batch evaluation workflows in the GUI when the evaluation component is present in the project. Without this flag, the dashboard exposes traces only.--plain-outputstreams logs directly without the persistent TUI panel (used bytask infra:dev).- 値の優先順位:フラグ > 環境変数 > 設定ファイル(
.dr-xp.yaml) >pulumi_config.json> デフォルト。
Run dr xp --help for the full flag list, including optional feature gates (--enable-logs, --enable-metrics, --enable-mcp-inspector, and others).
環境変数
必要に応じて、これらの変数を.envファイルに追加します。
DR_EXPERIMENT_ENTITY_TYPE(default:experiment_container)DR_EXPERIMENT_ENTITY_IDDR_EXPERIMENT_PORT(デフォルト:8090)DR_EXPERIMENT_ENABLE_EVALUATION(set totruefor evaluation workflows)
サポートされているエンティティタイプ
| エンティティタイプ | 説明 |
|---|---|
experiment_container(エイリアス:use_case) |
ユースケースエクスペリメントコンテナ(デフォルト)。 |
deployment |
モデルデプロイ。 |
custom_application |
カスタムアプリケーション。 |
workload |
ワークロード。 |
See also
- Local tracing—inspect OpenTelemetry spans during development.
- Batch agent evaluation—score agent responses on a fixed dataset.
- Implement tracing—add custom spans and attributes.
- DataRobot CLI getting started—install and configure the CLI.
- af-component-evaluation repository—evaluation component source and reference docs.