Local tracing
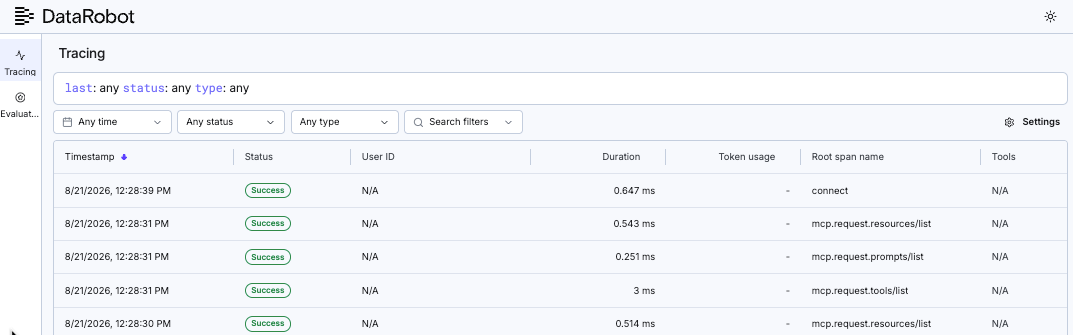
The Traces tab in the local experimentation dashboard lists every request the agent handled during a development session. Use it to inspect spans, tool calls, latency, token counts, and errors without deploying to the DataRobot platform.
For installation, GUI access, and port configuration, see the DataRobot experimentation plugin landing page.
ローカルトレースを使用する理由
ローカルトレースは、次のようないくつかの方法でエージェント開発をサポートします。
- Faster iteration. Review traces, logs, and spans without leaving the local environment or breaking the development flow.
- Behavior verification. Validate agent behavior across multiple real requests before deployment, not only on a single demo input.
- Span-level debugging. Inspect individual spans to explain agent decisions instead of inferring them from the final response.
- Earlier issue detection. Catch errors, guardrail violations, and performance problems while changes are still local, before they reach production.
ローカルおよびデプロイされたトレースに表示されるカスタムスパンと属性を追加する方法については、トレースの実装を参照してください。 デプロイ後、DataRobot UIでトレースを確認します。カスタムアプリケーションのトレースを参照してください。
Inspect OpenTelemetry traces
After installing the plugin, start the agent locally with task agent:dev. If the dashboard did not start automatically, run dr xp in another terminal. By default, it is available at http://localhost:8090. --portまたはDR_EXPERIMENT_PORTを使用してポートを設定します。
The dashboard lists every request the agent handled during the session. 各行は1つのトレースに対応しています。 Select a trace to open a detailed breakdown of its spans, including:
- ツールの呼び出しとその実行順序。
- 各スパンの所要時間とレイテンシー。
- 計装によって報告された場合は、トークン数。
- スパンまたはトレースが失敗した場合は、関連するエラーログ。
This is the same class of observability normally available only after deployment. With the experimentation plugin, it is available on the local machine from the start of development.
トレースのフィルターと検索
リクエスト数が増加した場合は、ダッシュボードのコントロールを使用して結果を絞り込みます。
| コントロール | 説明 |
|---|---|
| 属性フィルター | ツール名、モデル、またはカスタムスパン属性でトレースを絞り込みます。 |
| ステータスフィルター | 正常に完了した実行と、エラーで終了したトレースを区別します。 |
| 日付範囲 | テーブルの表示範囲を特定のアクティビティ期間に限定します。 |
| 検索 | リクエストまたはトレース識別子を使用して、特定のトレースに直接移動します。 |
Tracing troubleshooting
| 症状 | Fix |
|---|---|
| No traces in the dashboard | Start the agent with dr run dev or task agent:dev, send requests to the agent, then refresh the Traces tab. |
| Dashboard not reachable | Confirm the server is running; see GUI access troubleshooting. |
Port 8090 already in use |
List the process with lsof -i :8090 (macOS/Linux), note the PID, and run kill <PID>. On Windows, run netstat -ano | findstr :8090, then taskkill /PID <pid> /F. Alternatively, start on another port with --port 8091. |
| Duplicate startup message | When task dev runs, dr xp may start from both agent:dev and infra:dev. The message Already running at http://127.0.0.1:8090 is expected. |
See also
- DataRobot experimentation plugin—install, configure, and open the GUI.
- Batch agent evaluation—score agent responses on a fixed dataset.
- Implement tracing—add custom spans and attributes.