Monitor workflows
After you've deployed an agentic workflow or RAG to Console, monitor the deployment's performance and behavior. コンソールのデプロイページで、エージェントのワークフロータブをクリックし、エージェントワークフローのデプロイのリストを表示します。
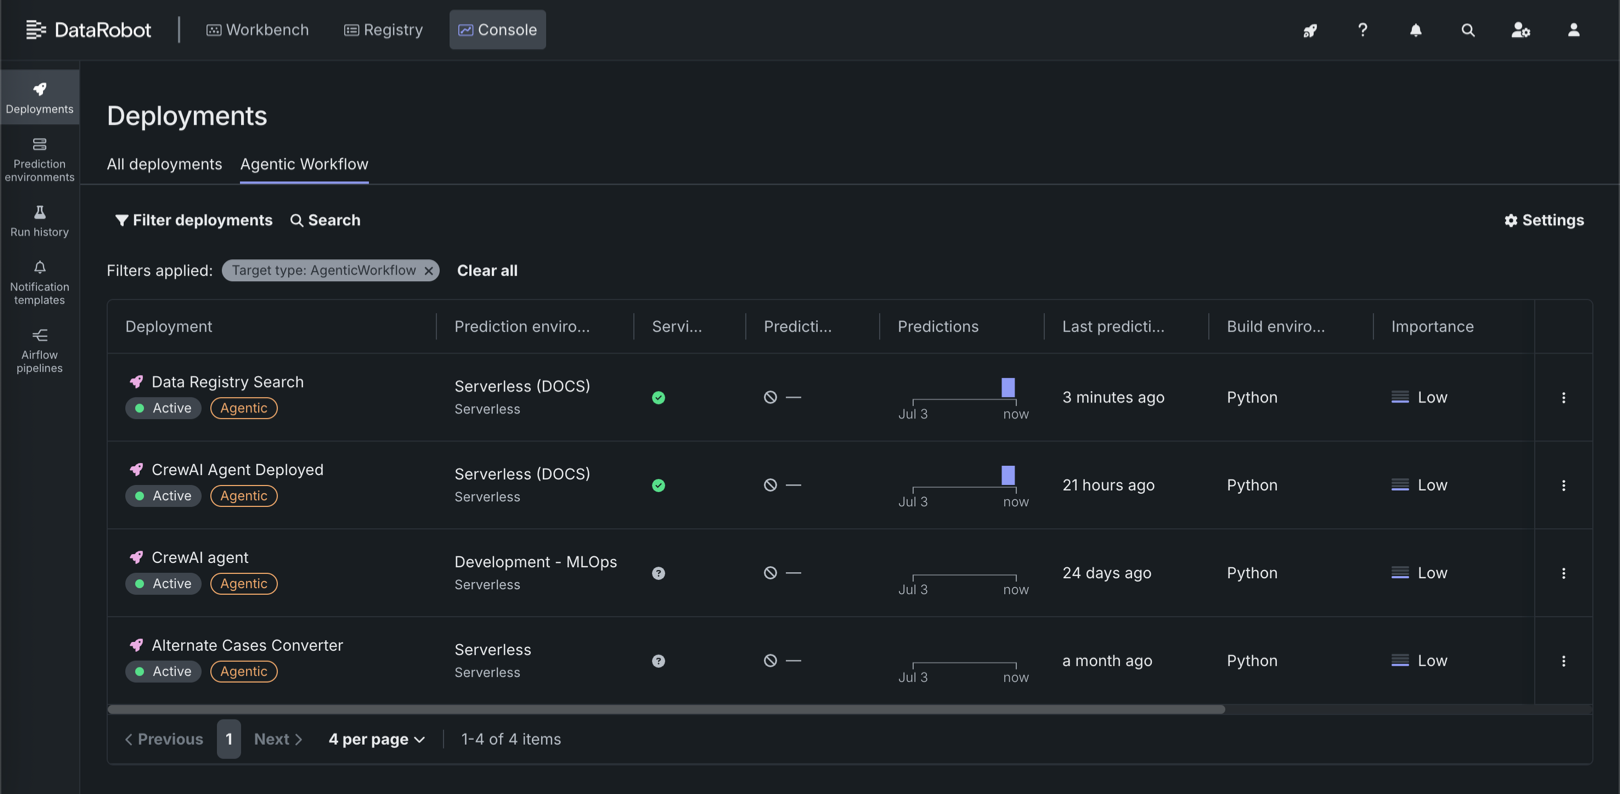
A fully configured agentic workflow deployment has access to the following Console features:
| 特徴量 | 説明 |
|---|---|
| 概要 | |
| 概要 | Review deployment details, lineage, tags, runtime parameters, and—when guardrails are configured—evaluation and moderation summary information. |
| モニタリング | |
| サービスの正常性 | モデル固有のデプロイのレイテンシー、スループット、および誤差率の追跡。 |
| 使用状況 | 予測処理の進捗を追跡して、精度、データドリフト、時間経過に伴う予測の分析に使用します。 For agentic workflow deployments, includes quota usage monitoring segmented by user or agent. |
| カスタム指標 | カスタムビジネスまたはパフォーマンス指標を作成して監視するか、既成の指標を追加します。 When you configure evaluation and moderation for the workflow, guard metrics (for example, guard latency and blocked counts) are reported here. |
| データ探索 | Explore and export stored prediction data, actuals, and training data; assess response quality; and use Tracing to inspect agent traces and timelines. |
| デプロイレポート | 即座に、またはスケジュールに従ってレポートを生成し、モデルのオーナー、モデルの構築方法、モデル年齢、信頼性の監視ステータスなどのデプロイの詳細を要約します。 |
| リソース監視 | Monitor CPU, memory, and replica utilization for the serverless deployment. |
| OTel指標 | Visualize OpenTelemetry metrics from your application alongside DataRobot native metrics. |
| 予測 | |
| 予測API | Use downloadable snippets to call the deployment's prediction and chat completion APIs from your application (including real-time scoring integrations). |
| アクティビティログ | |
| 標準出力 | View runtime logs from the custom model container to debug scoring and request failures. |
| ログ | View OpenTelemetry log events for troubleshooting and deeper analysis (span-related logs can also be filtered from Data exploration). |
| モデレーション | When evaluation and moderation guardrails are enabled, review guard-related events to diagnose blocked requests and guard failures. |