リソース監視
モニタリング > リソース監視タブでは、デプロイされたカスタムモデルとエージェントワークフローのリソース使用率指標が表示されます。これにより、パフォーマンスの監視、ボトルネックの特定、自動スケーリング動作の把握が容易になります。 このタブを使用して、リソースの使用状況を評価し、速度とコストのバランスを調整して、使用可能なハードウェアリソースをデプロイで効率的に活用できるようにします。
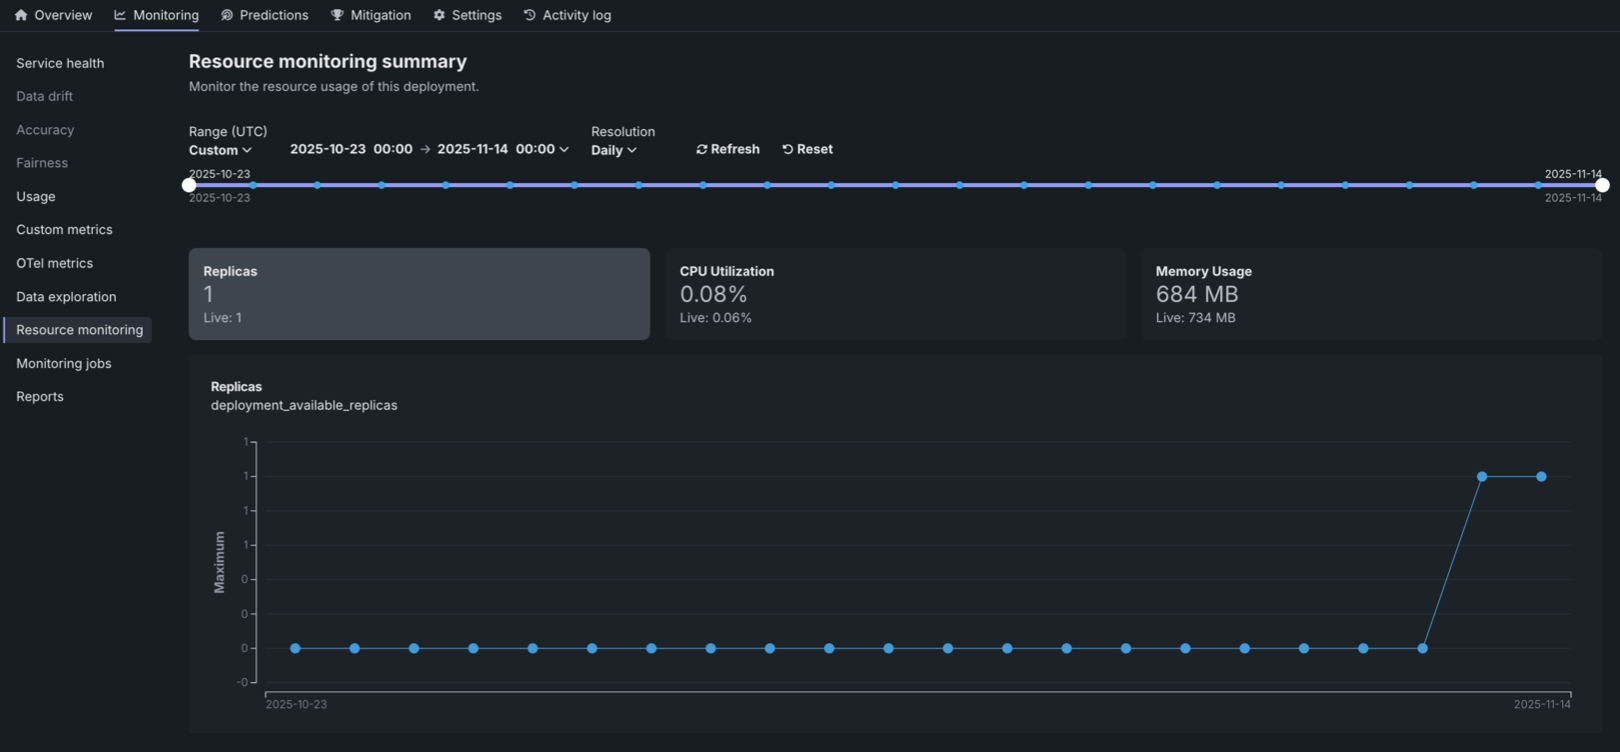
リソース監視にアクセスするには、デプロイインベントリからデプロイを選択し、監視 > リソース監視をクリックします。 このタブには、主要な指標の集計値と現在値を示すサマリータイルと、時間経過に伴うリソース使用率を視覚化する対話型チャートが表示されます。
Resource utilization summary tiles
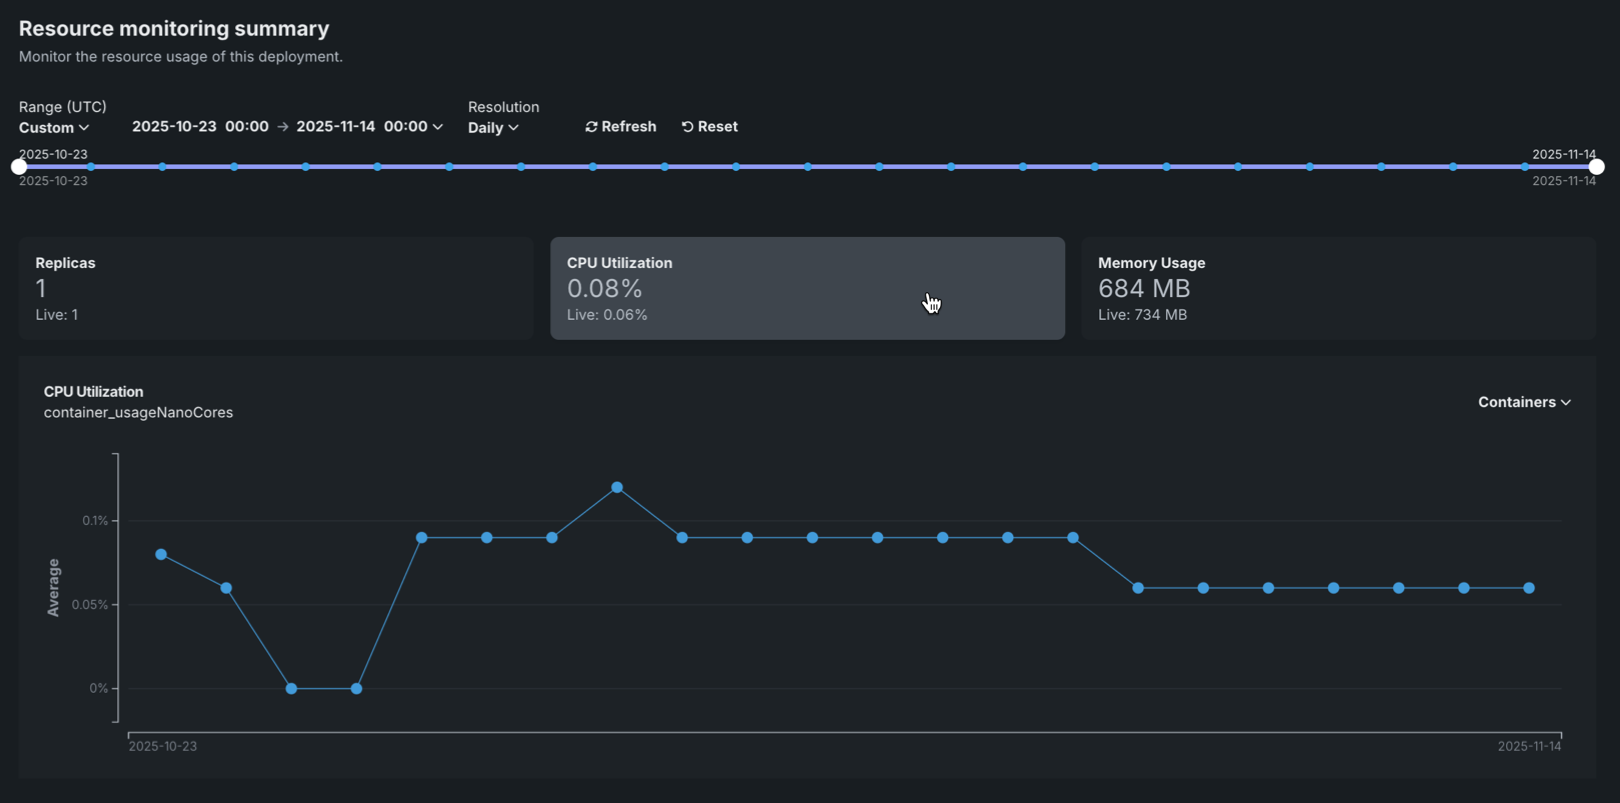
The Resource monitoring tab displays summary tiles at the top of the page, showing both the aggregated value over the selected timespan (the primary value) and the current Live value at the time of the request. The aggregated value represents the average value over the selected timespan. Clicking on a metric tile updates the chart below to display that metric over time.
The following metrics are displayed as summary tiles:
| 指標 | 説明 |
|---|---|
| レプリカ | The number of active compute instances (replicas) out of the maximum available for the deployment. For native models, this counts prediction server pods. For custom models, this counts the number of custom model pods. |
| CPU utilization | The percentage of CPU cores being used across all compute instances for the deployment. |
| メモリー使用量 | The amount of memory (in bytes or appropriate units) being used across all compute instances for the deployment. |
Resource utilization charts
The Resource monitoring tab displays interactive charts that visualize resource utilization metrics over time, helping you identify patterns and understand resource consumption trends.
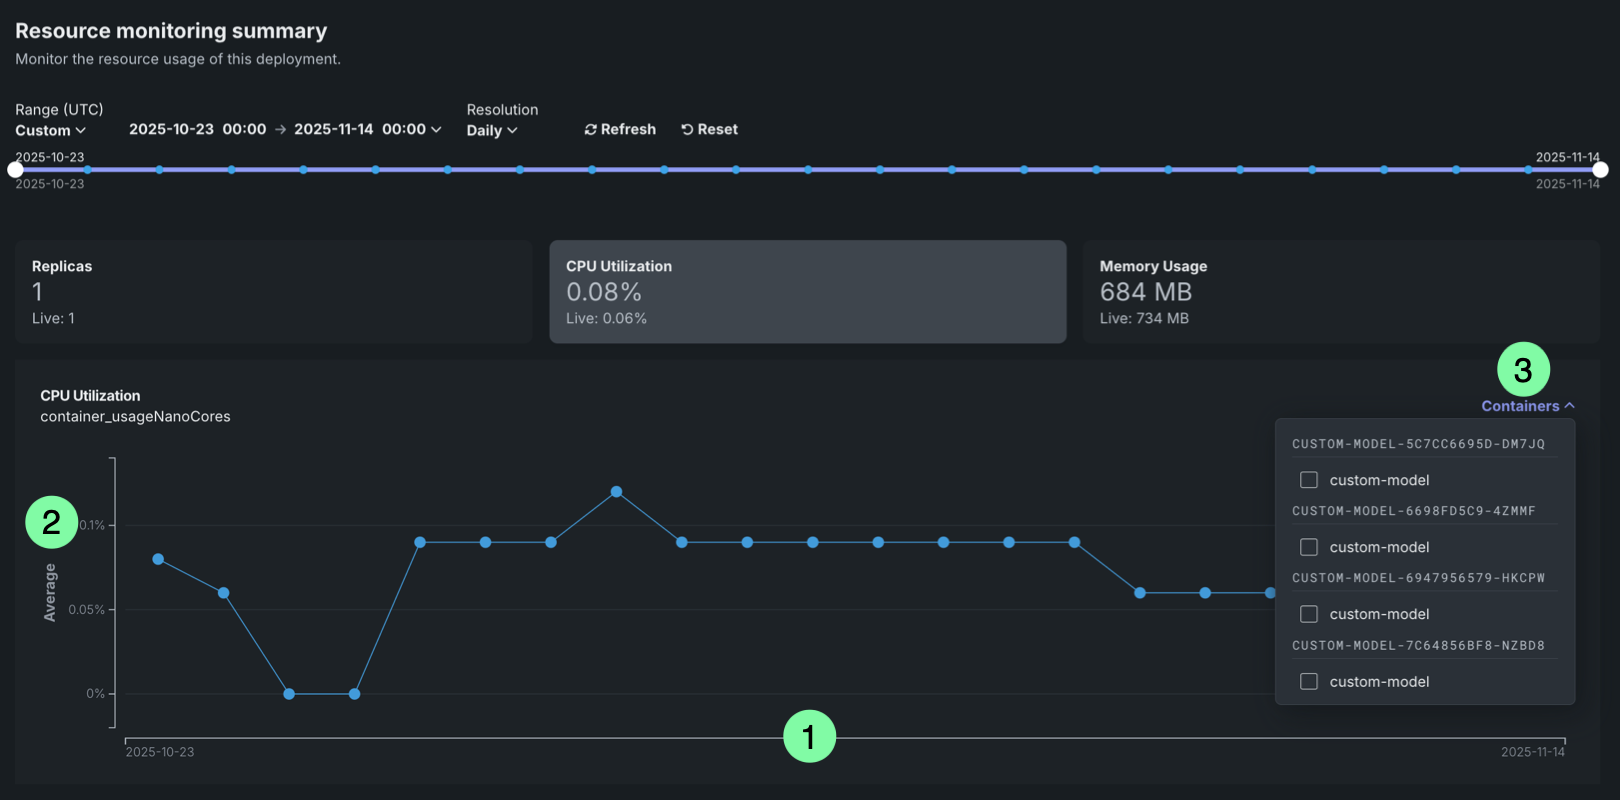
The chart displays the selected metric over time, with the following elements:
| チャートの要素 | 説明 | |
|---|---|---|
| 1 | Time (X-axis) | Displays the time represented by each data point, based on the selected resolution (1 minute, 5 minutes, hourly, or daily). |
| 2 | Metric value (Y-axis) | Displays the value (cardinality for Replicas and average for all other metrics) of the selected metric (Replicas, CPU utilization, or Memory usage) for each time period. |
| 3 | コンテナ | For deployments with multiple compute instances, you can filter resource utilization metrics by specific compute instance. |
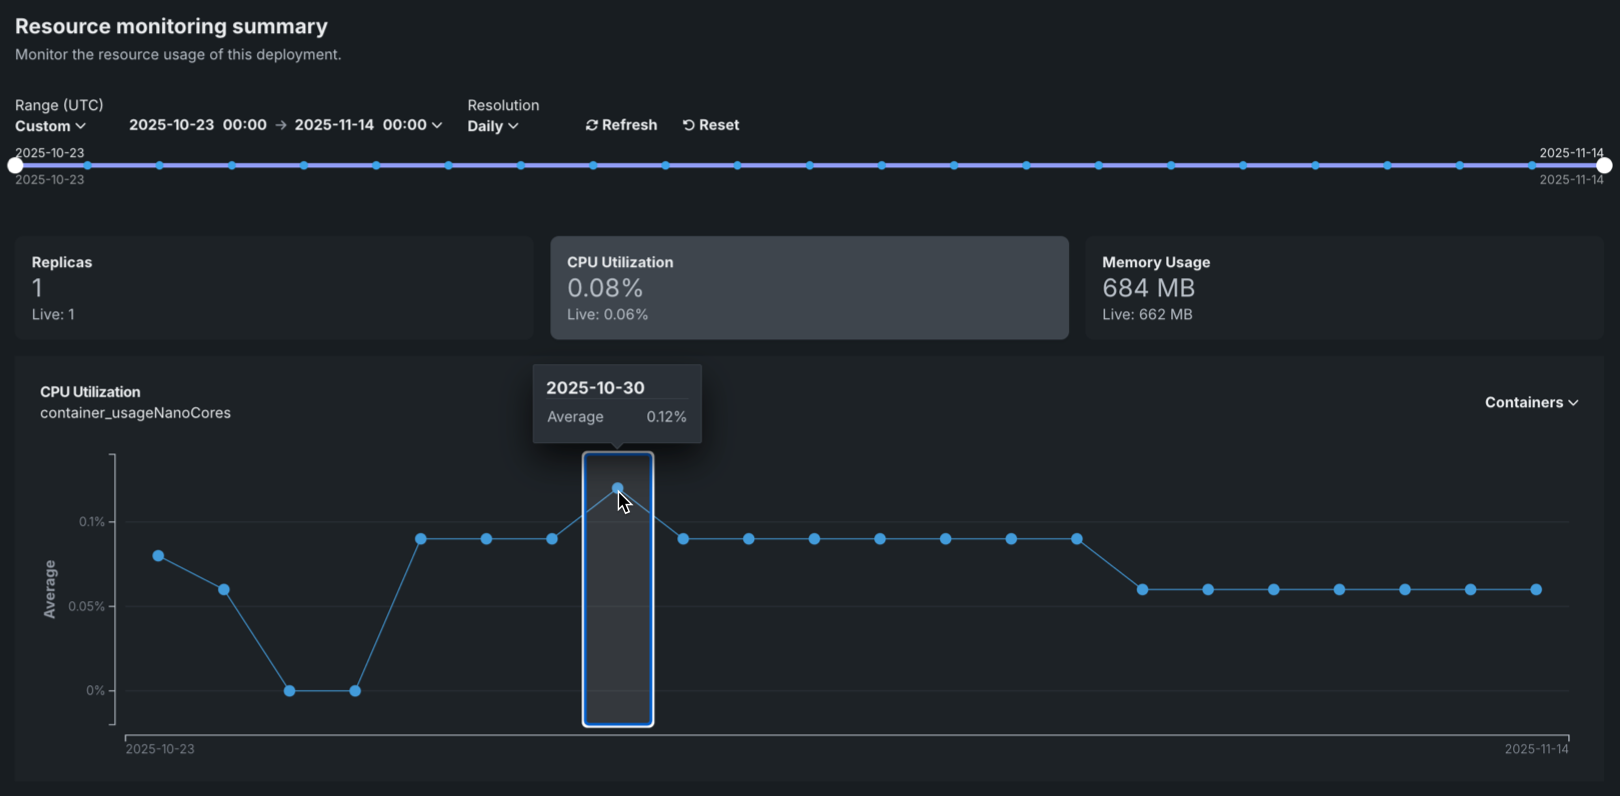
To view additional information on the chart, hover over a data point to see the time range and metric value:
You can configure the Resource monitoring dashboard to focus on specific time frames and metrics. 次のコントロールを使用できます。
| コントロール | 説明 |
|---|---|
| 範囲 (UTC) | デプロイ日付スライダーに表示する日付範囲を設定します。 日付スライダーをドラッグして範囲を設定することもできます。 範囲セレクターで選択できるのは、モデルのデプロイの現在のバージョンの開始日と現在の日付だけです。 |
| 単位 | デプロイ日付スライダーの時間のきめ細かさを設定します。 選択した範囲に基づいて、次の時間単位が使用可能です。
|
| 表示を更新 | 新しいデータを使用してダッシュボードのオンデマンド更新を開始します。 このボタンを使用しなくても、ダッシュボードは15分ごとに自動更新されます。 |
| リセット | ダッシュボードコントロールをデフォルト設定に戻します。 |
Time range limitations
The Resource monitoring tab is limited to displaying data from the last 30 days. This limitation ensures optimal performance when querying and displaying resource utilization metrics.
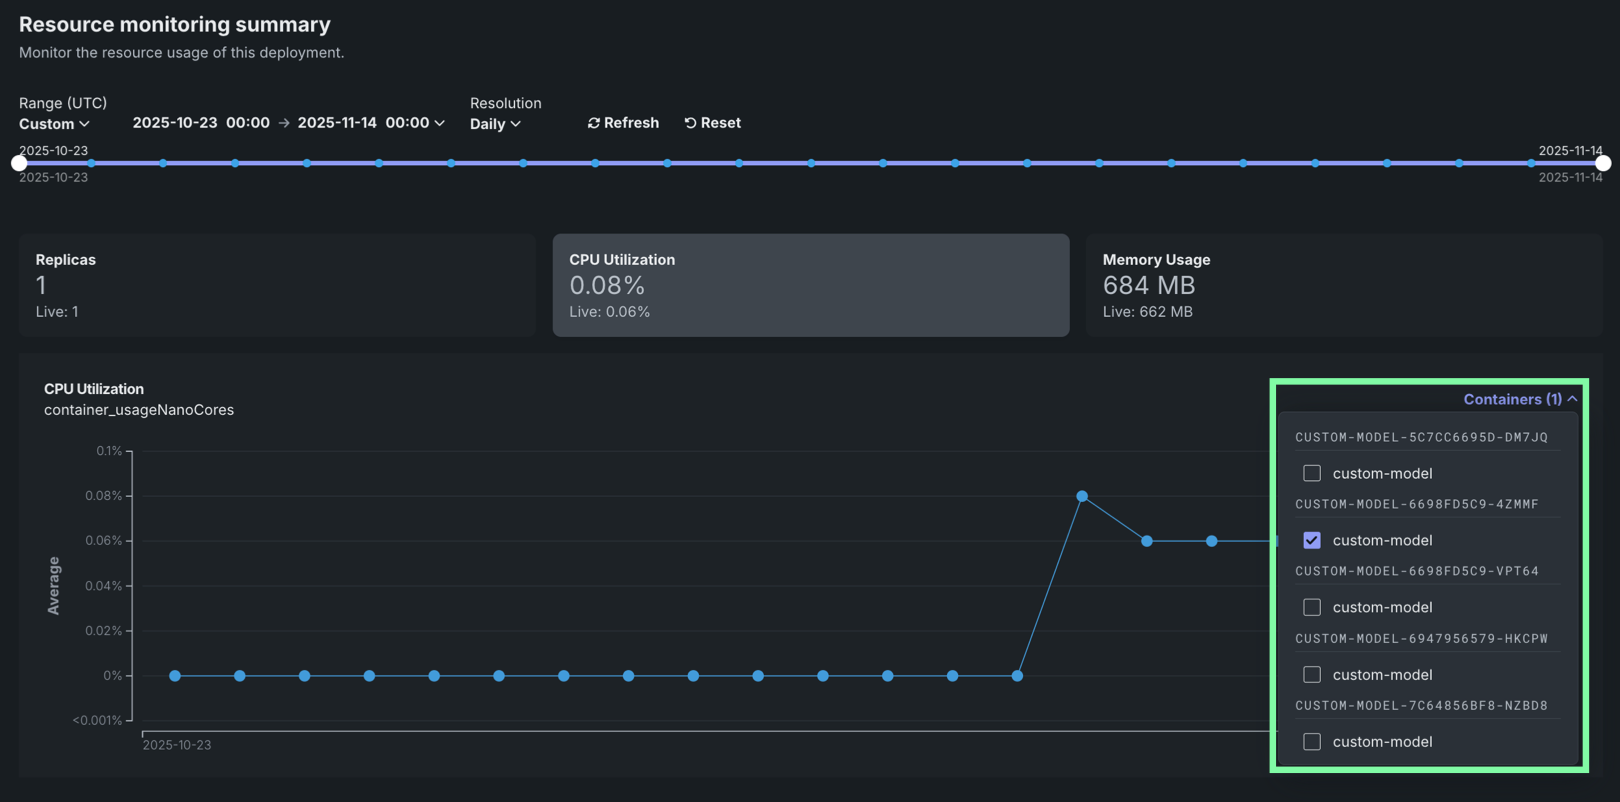
Filter by compute instance
For deployments with multiple compute instances, you can filter resource utilization metrics by specific compute instances. Filtering by compute instance allows you to:
- Identify which instances are experiencing high resource utilization.
- Troubleshoot issues affecting specific instances.
- Understand resource distribution across instances.
To filter by compute instance, use the Containers selector in the dashboard controls. Metrics are grouped by compute instance and are filtered by LRS ID or inference ID.
Compute instance filtering
Compute instance filtering is available for deployments with multiple instances. For single-instance deployments, the filtering selector is not available.
Understanding resource utilization metrics
The following sections provide detailed explanations of each resource utilization metric displayed on the Resource monitoring tab. Understanding these metrics helps you evaluate resource usage, identify bottlenecks, and make informed decisions about resource bundle sizing.
レプリカ
The Replicas metric shows the number of active compute instances (replicas) currently running for your deployment, out of the maximum available. This metric helps you:
- Monitor changes in the number of replicas over time to understand scaling behavior.
- Correlate the number of replicas with resource utilization metrics.
- Identify when additional capacity is needed or when resources are underutilized.
For native models, this metric counts prediction server pods. For custom models, this metric counts custom model pods.
CPU utilization
The CPU utilization metric shows the percentage of CPU cores being utilized across all compute instances. This metric helps you:
- Identify CPU bottlenecks that may be affecting model performance.
- Understand CPU usage patterns over time.
- Make informed decisions about CPU resource bundle sizing.
High CPU utilization may indicate that your deployment needs more CPU resources or that the workload is CPU-intensive. Low CPU utilization may suggest that you can reduce the CPU resource bundle size to optimize costs.
メモリー使用量
The Memory usage metric shows the amount of memory being used across all compute instances. This metric helps you:
- Monitor memory usage to prevent out-of-memory errors.
- Identify memory leaks or excessive memory consumption.
- Make informed decisions about memory resource allocation.
Memory usage is displayed in bytes or appropriate units (KB, MB, GB) based on the scale of usage.