予測距離ごとの精度
| タブ | 説明 |
|---|---|
| パフォーマンス | エクスペリメントの予測ウィンドウ内の各予測距離において、モデルがどの程度正しく予測するかを視覚的に示します。 Time-aware only |
Use Forecasting Accuracy to help determine, for example, how much harder it is to accurately forecast four days out as opposed to two days out. チャートには、将来における時間経過に伴う精度の変化が示されます。 このインサイトは、すべての時系列エクスペリメント(単一系列と複数系列の両方)で利用可能です。
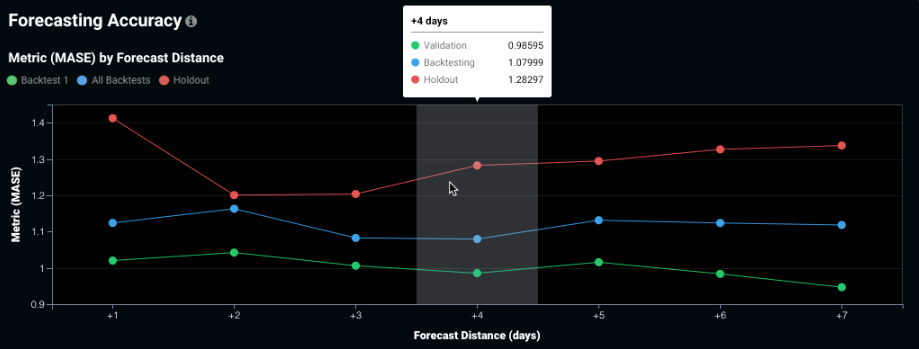
各予測距離に対して、ポイントは以下の内容を表します。
-
緑(バックテスト1): リーダーボードに表示される検定スコア。最初(最も最近)のバックテストの検定スコアを表します。
-
青(すべてのバックテスト):リーダーボードに表示されるバックテストスコア。すべてのバックテストにわたる平均検定スコアを表します。
-
赤(ホールドアウト):ホールドアウトスコア。
表示を変更するには、リーダーボードから最適化指標を変更します。
次のステップ
Continue evaluating time-aware model performance with these related insights.
- Forecast vs Actual: Compare how predictions from different forecast points behave against actuals over time.
- Period Accuracy: Compute aggregate error metric values for specific, important periods within the training dataset.
- Series Insights: Review series clustering information for multiseries projects in charted and tabular format.