時間経過に伴う異常
| タブ | 説明 |
|---|---|
| パフォーマンス | データのタイムライン全体でいつ異常が発生するかを把握するのに役立ちます。 Time-aware only |
Anomaly Over Time functions similarly to the non-anomaly Accuracy Over Time insight. See the that documentation for details of the configurable elements (backtest, forecast distance, etc.) and controlling the display.
備考
複数系列プロジェクトには最大100万の系列と最大1000の予測距離を含めることができるため、すべての系列データの精度チャートを計算すると、計算量が非常に多くなり、不要であることもよくあります。 これを回避するために、DataRobotでは 代わりの計算オプションを用意しています。
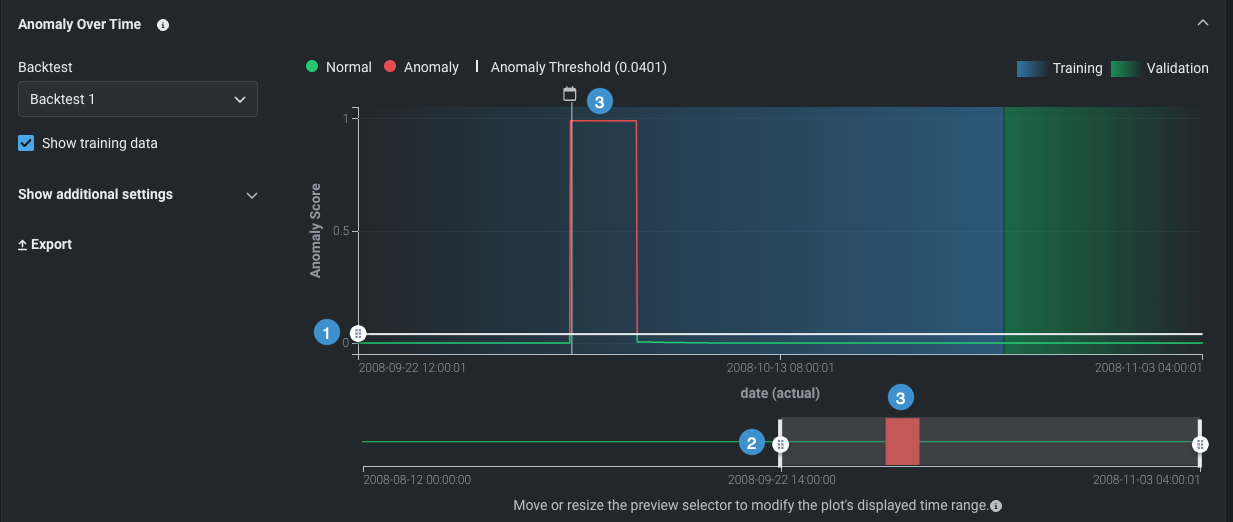
Anomaly Over Time provides the following chart controls:
| ラベル | 説明 | |---|---|---| | 1 | Sets the time frame of the preview. | | 2 | Controls the anomaly threshold. ハンドルを上下にドラッグして、プロット値を異常と見なすかどうかを定義するしきい値を設定します。 | | 3 | Indicates, in red, points that fall above the threshold. |