Predictions and deployments
What is MLOps?
Machine learning operations (MLOps) is a derivative of DevOps; the thought being that there is an entire “Ops” (operations) industry that exists for normal software, and that such an industry needed to emerge for ML (machine learning) as well. Technology (including DataRobot AutoML) has made it easy for people to build predictive models, but to get value out of models, you have to deploy, monitor, and maintain them. Very few people know how to do this and even fewer than know how to build a good model in the first place.
This is where DataRobot comes in. DataRobot offers a product that performs the "deploy, monitor, and maintain" component of ML (MLOps) in addition to the modeling (AutoML), which automates core tasks with built in best practices to achieve better cost, performance, scalability, trust, accuracy, and more.
Who can benefit from MLOps? MLOps can help AutoML users who have problems operating models, as well as organizations that do not want AutoML but do want a system to operationalize their existing models.
Key pieces of MLOps include the following:
- The Model Management piece in which DataRobot provides model monitoring and tracks performance statistics.
- The Custom Models piece makes it applicable to the 99.9% of existing models that weren’t created in DataRobot.
- The Tracking Agents piece makes it applicable even to models that are never brought into DataRobot—this makes it much easier to start monitoring existing models (no need to shift production pipelines).
Learn more about MLOps.
What are stacked predictions?
DataRobot produces predictions for training data rows by making "stacked predictions," which just means that for each row of data that is predicted on, DataRobot is careful to use a model that was trained with data that does not include the given row.
ELI5 example
You're a teacher teaching five different math students and want to be sure that your teaching material does a good job of teaching math concepts.
So, you take one hundred math problems and divide them up into five sets of question-answer pairs. You give each student a different collection of four sets to use as study material. The remaining fifth set of math problems you use as the exam for that student.
When you present your findings to the other teachers, you don't want to present the student's answers on the study material as evidence of learning—the students already had the answers available and could have just copied them without understanding the concepts. Instead you show how each student performed on their exam, where they didn't have the answers given to them.
In this analogy, the students are the models, the question-answer pairs are the rows of data, and the different sets of question-answer pairs are the different cross-validation partitions. Your presentation to the other teachers is all the charts DataRobot makes to understand model performance (Lift Charts, ROC curve, etc). The student's answers on their exams are the stacked predictions.
Learn more about stacked predictions.
Dedicated Prediction Server vs. Portable Prediction Server
-
Dedicated Prediction Server (DPS): You have a garage attached to your house, allowing you to open the door to check in on your car whenever you want.
-
Portable Prediction Server (PPS): You have a garage but it's down the street from your house. You keep it down the street because you want more space to work and for your car collection to be safe from damage when your teenage driver tries to park. However, if you want to regularly check in on your collection, you must install cameras.
-
Dedicated Prediction Server (DPS): A service built into the DataRobot platform, allowing you to easily host and access your models. This type of prediction server provides the easiest path to MLOps monitoring since the platform is handling scoring directly.
-
Portable Prediction Server (PPS): A containerized service running outside of DataRobot, serving models exported from DataRobot. This type of prediction server allows more flexibility in terms of where you host your models, while still allowing monitoring when you configure MLOps agents. This can be helpful in cases where data segregation or network performance are barriers to more traditional scoring with a DPS. The PPS might be a good option if you're considering using scoring code but would benefit from the simplicity of the prediction API or if you have a requirement to collect Prediction Explanations.
Dynamic time warping (DTW)
Robot 1
It is my understanding that dynamic time warping attempts to align the endpoint of series that may not be entirely overlapping.
Consider my client's use case, which involves series of movie KPIs from upcoming releases. They get 10-20 weeks of KPIs leading up to a movie's opening weekend. Clearly many time series are not overlapping, but relatively they could be lined up (like 1 week from opening, 2 weeks from opening, etc.). They could do this in R/Python, but I was thinking time series clustering might be able to handle this.
What do I need to know—like series length limitations or minimal overlapping time periods, etc.? Is my understanding of dynamic time warping even correct?
Robot 2
Well it would be more about the points in the middle generally rather than the ends.
Robot 3
For running time series clustering, you need:
-
10 or more series.
-
If you want K clusters, you need at least K series with 20+ time steps. (So if you specify 3 clusters, at least three of your series need to be of length 20 or greater.)
-
If you took the union of all your series, the union needs to collectively span at least 35 time steps.
Robot 3
In DR, the process of DTW is handled during model building—it shouldn’t require any adjustment from the user. If it errors out, flag it for us so we can see why.
Under the hood
- When you press Start in clustering for time series, some k-means blueprints involve DTW (others involve a related technique called Soft-DTW) and then k-means is applied to cluster the series.
-
The goal of DTW is to align the series. For example,
sin(x), -sin(x), andcos(x)are all different functions, but follow the same pattern. DTW will (trivially) shift these functions so their peaks and valleys line up. Their distance would effectively be zero, after applying DTW. -
But... DTW can do more than shifting; it can impute repeated values in the middle of a series, like Robot 2 mentioned.
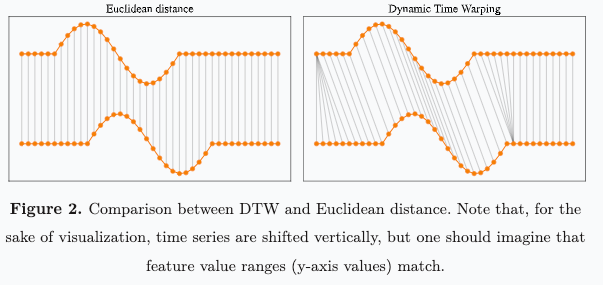
(Image pulled from here. That site has lots of good moving images; I’m texting from the car so can’t get them to copy over.)
In the image, the left example is straight up Euclidean distance. You just take each time point, calculate the distance between the two series at that moment in time, then square and add them. That’s your Euclidean distance.
In DTW, the top series (I’ll call it T) is mapped to the bottom (B) in a more complicated way.
- We’re gonna create 2 new series:
T*andB*, and calculate the Euclidean distance between those.
T1 (the first observation in T) is mapped to B1 through B6. This means, to “match up” T and B, T1 is going to be copied 6 times. So, T*1 = T1, T*2 = T1, … T*6 = T1.
- That is, DTW takes
Tand stretches it out by making five copies of T1, so for thatregion-of-time, T and B are aligned. It’s kind of like shifting part of the series, but using “last value carried forward imputation” to do it. (I’m sure the video on the site will show it better than I’ve described, sorry.)
Then, T*7 = T2, T*8 = T3 and so on.
So far, B* = B for like the first 25 steps or so. Fast forward to the right side of the valley. Since B is mapped to multiple places in T, we’re gonna define B here to take on multiple copies of B.
B*25 = B25
B*26 = B25
...
B*30 = B25
Then, B31 = B26, B32 = B27, and so on.
At the end, this should mean that B* and T* are the same length. Then, we calculate the Euclidean distance between B* and T*.
Robot 3
So, Robot 1, in more detail than you wanted (and almost surely way sloppier!), the starting and ending points get aligned but there’s additional imputation operations that happen inside that stretch the series.
Robot 3
And in DataRobot all this happens under the hood. So, thank a developer 😉
Robot 1
Hey Robot 3, the client was very appreciative of this information, so thank you! They did ask if there was any documentation on the guardrails/constraints around time series clustering. Do we have them published somewhere?
Robot 4
We have that information in the documentation!