Data science
General data science
As you can imagine, there are a lot of general questions that come through.
What is a sidecar model?
ELI5: Imagine you have a motorcycle driver who is navigating just by what they see on the road. Sometimes, the driver gets a bit confused and needs some help to make the right decisions. That’s where the sidecar comes in. The sidecar is like having a passenger sitting beside the motorcycle driver. This passenger has a different perspective (or maybe even a map) and can give advice or guidance to the driver. They might notice things that the driver doesn’t see, like a pothole, a shortcut, or a prompt injection attack.
I would also probably consider guard models to be a kind of sidecar model, but idk if we refer to them that way internally.
With DataRobot's hosted custom metrics, the sidecar model is a different model from the LLM that’s serving back the actual responses, but it can make a determination about whether the prompt was toxic, an injection attack, etc.
What are rating tables and GAMs?
A rating table is a ready-made set of rules you can apply to insurance policy pricing, like, "if driving experience and number of accidents is in this range, set this price."
A GAM model (generalized additive models) is interpretable by an actuary because it models things like, "if you have this feature, add $100; if you have this, add another $50."
GAMs allow you to automatically learn ranges for the rating tables.
Learn more about rating tables.
Loss reserve vs. loss cost modeling
In insurance, loss reserving is estimating the ultimate costs of policies that you've already sold (regardless of what price you charged). If you sold 1000 policies this year, at the end of the year lets say you see that there have been 50 claims reported and only $40k has been paid. They estimate that when they look back 50 or 100 years from now, they'll have paid out a total of $95k, so they set aside an additional $55k of "loss reserve". Loss reserves are by far the biggest liability on an insurer's balance sheet. A multi-billion dollar insurer will have hundreds of millions if not billions of dollars worth of reserves on their balance sheet. Those reserves are very much dependent on predictions.
ELI5: You just got paid and have $1000 in the bank, but in 10 days your $800 mortgage payment is due. If you spend your $1000, you won't be able to pay your mortgage, so you put aside $800 as a reserve to pay the future bill.
Algorithm vs. model
ELI5: An example model for sandwiches: a sandwich is a savory filling (such as pastrami, a portobello mushroom, or a sausage) and optional extras (lettuce, cheese, mayo, etc.) surrounded by a carbohydrate (bread). This model allows you to describe foods simply (you can classify all foods as "sandwich" or "not sandwich"), and allows you to predict new sets of ingredients to make a sandwich.
Robot 1
Not the "is it a sandwich?" debate!!
An algorithm for making a sandwich would consist of a set of instructions:
- Slice two pieces of bread from a loaf.
- Spread chunky peanut butter on one side of one slice of bread.
- Spread raspberry jam on one side of the other slice.
- Place one slice of bread on top of the other so that the sides with the peanut butter and jam are facing each other.
PCA and K-Means clustering
Robot 1
What is the impact of principal component analysis (PCA) on K-Means clustering?
Hi team, a customer is asking how exactly a PCA > k-means is being used during modeling. I see that we create a CLUSTER_ID feature in the transformed dataset and I am assuming that is from the k-means. My question is, if we are creating this feature, why aren't we tracking it in, for example, feature impact?
Robot 2
Feature impact operates on the level of dataset features, not derived features. If we have one-hot encoding for categorical feature CAT1—we also calculate feature impact of just CAT1, not CAT1-Value1, CAT1-Value2,...
Permutation of original features would also produce permutation of KMeans results—so if those are important for the modeling result, its impact will be assigned to the original columns.
Robot 3
Some blueprints use the one-hot-encoded cluster ID as features, and other blueprints use the cluster probabilities as features.
If you wish to assess the impact of the kmeans step on the outcome of the model, delete the kmeans branch in composable ML and use the Leaderboard to assess how the model changed.
As Robot 2 says, feature impact operates on the RAW data and is inclusive of both the preprocessing AND the modeling.
What does monotonic mean?
Examples
Let's say you collect comic books. You expect that the more money you spend, the more value your collection has (monotonically increasing relationship between value and money spent). However, there could be other factors that affect this relationship, like a comic book tears and your collection is worth less even though you spent more money. You don't want your model to learn that spending more money decreases value because it's really decreasing from a comic book tearing or other factor it doesn't consider. So, you force it to learn the monotonic relationship.
Let's say you're an insurance company, and you give a discount to people who install a speed monitor in their car. You want to give a bigger discount to people who are safer drivers, based on their speed. However, your model discovers a small population of people who drive incredibly fast (e.g., 150 MPH or more), that are also really safe drivers, so it decides to give a discount to these customers too. Then other customers discover that if they can hit 150 MPH in their cars each month, they get a big insurance discount, and then you go bankrupt. Monotonicity is a way for you to say to the model: "as top speed of the car goes up, insurance prices must always go up too."
To normalize or not to normalize, that is the question:
Robot 1
- When we apply monotonic Increasing/Decreasing constraints to attributes, is DataRobot doing some kind of normalization (capping amd flooring, binning etc.)?
- When we apply
try only monotonicmodels, will it try GBM, XGBOOST, RF etc.?
Robot 2
No normalization that I know of and just xgboost and gam. You don't really need to normalize data for xgboost models.
Robot 3
For docs you can check out how to configure feature constraints and then the workflow to build them.
What is a ridge regressor?
There are two kinds of penalized regression—one kind of penalty makes the model keep all the features but spend less on the unimportant features and more on the important ones. This is Ridge. The other kind of penalty makes the model leave some unimportant variable completely out of the model. This is called Lasso.
ELI5 example
If you have a group of friends in a room talking about which team is going to win a game, you want to hear multiple opinions and not have one friend dominate the conversation. So if they keep talking and talking, you give them a 'shush' and then keep 'shushing' them louder the more they talk. Similarly, the ridge regressor penalizes one variable from dominating the model and spreads the signal to more variables.
Calibration for XGBoost probabilities
Robot 1
Customer asked a stumper for me. They mentioned that XGBoost probabilities for binary classifiers can sometimes be off base and need to be “calibrated”. I’ll admit this is over my head, but is this just the XGBoost loss function?
Robot 2
Is it important for the probabilities to be properly calibrated, or good to have? What's the use case?
CC @Robot 3, who almost certainly knows the technical answer about the loss function.
Robot 1
It’s 90/10 unbalanced and is likely some sort of medical device failure or bad outcome.
Robot 3
We use Logloss for our XGBoost models, which usually leads to pretty well calibrated models.
If we used a different loss function, we would need to calibrate (but we don’t).
We’ve investigated ourselves and determined that using Logloss is a good solution.
Robot 2
Should we have a DR link that explains "we've thought about this, and here's our answer"?
Robot 1
How about:
There was a great question from this morning on the calibration of the probabilities for XGBoost models. I discussed this with some of the data scientists who work on core modeling. Based on their research on this issue, Using the LogLoss loss function generally produces well-calibrated probabilities and this is the default function for unbalanced binary classification datasets.
For other optimization metrics, calibration may be necessary and is not done by DataRobot at this time.
Robot 4
If they wanted to, they could add a calibration step in the blueprint like here:
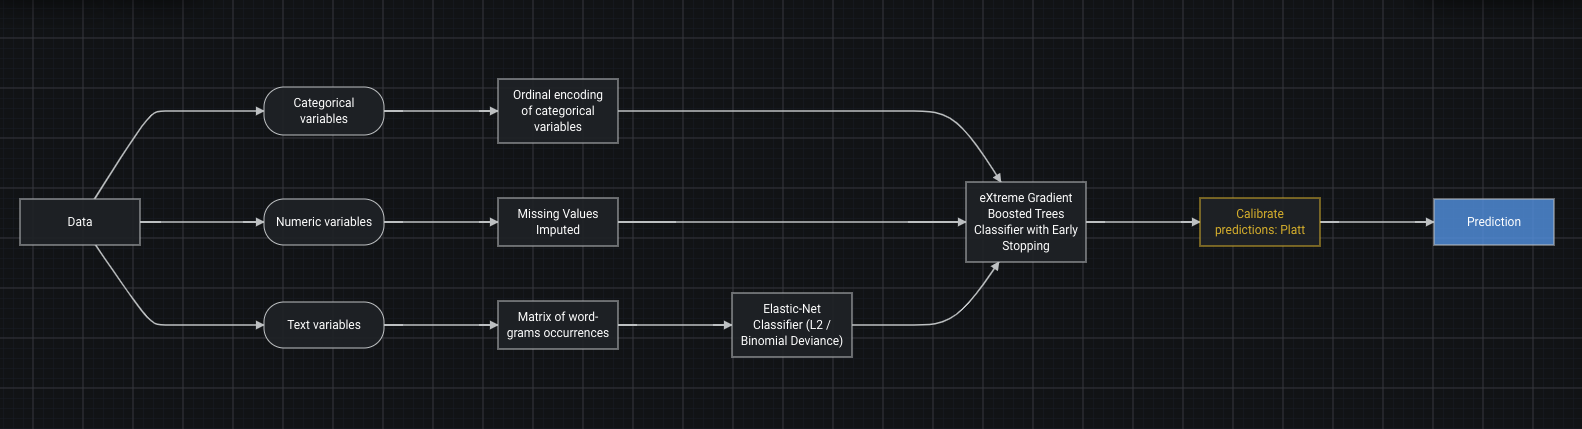
Robot 5
Maybe worth noting that another quick way to check calibration is by looking at the lift chart. Not the 100% answer but still helps.
What are tuning parameters and hyperparameters?
Tuning parameters and hyperparameters are like knobs and dials you can adjust to make a model perform differently. DataRobot automates this process to make a model fit data better.
Say you are playing a song on an electric guitar. The chords progression is the model, but you and your friend play it with different effects on the guitar—your friend might tune their amplifier with some rock distortion and you might increase the bass. Depending on that, the same song will sound different. That's hyperparameter tuning.
Some cars, like a Honda Civic, have very little tuning you can do to them. Other cars, like a race car, have a lot of tuning you can do. Depending on the racetrack, you might change the way your car is tuned.
NPS in DataRobot
Robot 1
Hello NLP team. I was wondering if anyone has implemented an NPS (net promoter scores) solution in DataRobot. I have a customer that wants to use a multilabel project that not only labels Good, Bad, Neutral, but also tags the cause of the bad/good review. Say for example someone responds with:
“I loved the product but the service was terrible.”
How can we use DataRobot to tell us that that is contains both a good and bad comment, the bad comment is assigned to “service” and the good is assigned to “product”?
Robot 2
Multilabel with classes like good_product, bad_product , good_service, etc ?
Robot 3
I would use the raw 1-10 score as a target. A good model should be able to learn something like:
Target: 7 Text: “I loved the product but the service was terrible.”
coefficients: * intercept: +5.0 * "loved the product": +4.0 * "service was terrible": -1.0
prediction: 5 + 4 - 1 = 7
Robot 3
Don't aggregate the data to get a NPS and then try to label and bin. Just use the raw survey scores directly and look at how the words/phrases in the word cloud drive the score up and down. Multilabel (and multiclass) both feel like they are overcomplicating the problem—great for other things but you don't need it here!
Robot 1
“don’t aggregate the data to get a NPS and then try to label and bin”
Can you elaborate a bit more on this ^^ sentence
Robot 3
So a "net promoter score" is an aggregate number. It doesn't exist in individual surveys. This is a great article on it.
Typically, a net promotor score survey has 2 questions:
- On a scale of 1-10, how likely are you to recommend this product to a friend?
- Free form text: Why?
Robot 1
Gotcha, I see what you mean.
Robot 3
ELI5 example
Let's say you get 100 surveys, and the distribution of scores is something like:
- 1: 1 respondent
- 2: 3 respondents
- 3: 5 respondents
- 4: 7 respondents
- 5: 15 respondents
- 6: 25 respondents
- 7: 15 respondents
- 8: 15 respondents
- 9: 10 respondents
- 10: 4 respondents
And the net promotor methodology bins these up:
- Detractors: 1-6
- Passives: 7-8
- Promotors: 9-10
Robot 3
So in our case we have:
- Detractors: 1+3+5+7+15+25 = 56
- Passives: 15+15 = 30
- Promotors: 10+4 = 14
Converting to %'s we get:
- Detractors: 56%
- Passives: 30%
- Promotors: 14%
The net promotor score is (Promotors %) - (Detractors %), or in this case 14-56.
So the NPS for this survey is -42, which is bad.
Robot 3
Ok, now why is it bad? Well, you hire some consultant to read the survey and tell you, or you can use DataRobot to read the surveys instead!
The concept of a net promotor score at the level doesn't apply—you can't look at one person and compute their NPS. NPS is a property of a group of users. At the user level you could bin people up into multiclass "detractor" "passive" and "promotor" but you lose information, particularly in the detractor class.
I personally think a 6 is really different from a 1. A 1 hates your product, and a 6 is pretty much a passive.
So it's useful to build an individual-level model where the target is the direct, raw score from 1-10, and then the predictor is the text of the response. And as I pointed out above, DataRobot's word cloud and coefficients will tell you which pieces of text increase the users score and which pieces decrease their score, adding up to a total predicted score for a user based on what they said.
Robot 2
You can also use text prediction explanations to look at individual reviews.
Robot 3
Oh that’s right! That will give you word level positive/negative/neutral for each review.
Thanks Robot 2 and Robot 3! This is all great information. I’ll see what we can come up with, but I’d definitely like to leverage the text prediction explanations for this one.
Scoring data vs. scoring a model
You want to compete in a cooking competition, so you practice different recipes at home. You start with your ingredients (training data), then you try out different recipes on your friend to optimize each of your recipes (training my models). After that, you try out the recipes on some external guests who you trust and are somewhat unbiased (validation), ultimately, choosing the recipe that you will try in the competition. This is the model that you will be using for scoring.
Now you go to the competition where they give you a bunch of ingredients—this is your scoring data (new data that you haven't seen). You want to run these through your recipe and produce a dish for the judges—that is making predictions or scoring using the model.
You could have tried many recipes with the same ingredients—so the same scoring data can be used to generate predictions from different models.
Bias vs. variance
You're going to a wine tasting party and are thinking about inviting one of two friends:
- Friend 1: Enjoys all kinds of wine, but may not actually show up (low bias/high variance).
- Friend 2: Only enjoys bad gas station wine, but you can always count on them to show up to things (high bias/low variance).
Best case scenario: You find someone who isn’t picky about wine and is reliable (low bias/low variance). However, this is hard to come by, so you may just try to incentivize Friend 1 to show up or convince Friend 2 to try other wines (hyperparameter tuning). You avoid friends who only drink gas station wine and are unreliable about showing up to things (high bias/high variance).
Log scale vs. linear scale
In log scale the values keep multiplying by a fixed factor (1, 10, 100, 1000, 10000). In linear scale the values keep adding up by a fixed amount (1, 2, 3, 4, 5).
Going up one point on the Richter scale is a magnitude increase of about 30x. So 7 is 30 times higher than 6, but 8 is 30 times higher than 7, so 8 is 900 (30x30) times higher than 6.
The octave numbers increase linearly, but the sound frequencies increase exponentially. So note A 3rd octave = 220 Hz, note A 4th octave = 440 Hz, note A 5th octave = 880 Hz, note A 6th octave = 1760 Hz.
Interesting facts:
- In economics and finance, log scale is used because it's much easier to translate to a % change.
- It's possible that a reason log scale exists is because many events in nature are governed by exponential laws rather than linear, but linear is easier to understand and visualize.
- If you have large linear numbers and they make your graph look bad, then you can log the numbers to shrink them and make your graph look prettier.
Offset/exposure with Gamma distributions
Robot 1
How does DataRobot treat exposure and offset in model training with the target following a Gamma distribution?
The target is total claim cost while exposure = claim count. So, in DataRobot, one can either set exposure equal to “claim count” or set offset = ln(“claim count”). Should I reasonably expect that both scenarios are mathematically equivalent?
Thanks!
Robot 2
Yes, they are mathematically equivalent. You either multiply by the exposure or add the ln(exposure).
Robot 1
Thanks, that was my impression as well. However, I did an experiment, setting up projects using the two approaches with the same feature list. One project seems to overpredict the target, while the other underpredicts. If they are mathematically equal, what might have caused the discrepancy?
Robot 2
Odd. Are you using the same error metric in both cases?
Robot 1
Yes, both projects used the recommended metric—Gamma Deviance.
Robot 2
Can you manually compare predictions and actuals by downloading the validation or holdout set predictions?
Robot 1
Upon further checking, I see I used the wrong feature name (for the exposure feature) in the project with the exposure setting. After fixing that, predictions from both projects match (by downloading from the Predict tab).
I did notice, however, that the Lift Charts are different.
Robot 2
That is likely a difference in how we calculate offset vs. exposure for Lift. I would encourage making your own Lift Charts in a notebook. Then you could use any method you want for handling weights, offset, and exposure in the Lift Chart.
Robot 3
We do have a great AI Accelerator for customizing lift charts.
Robot 1
Amazing. Thank you!
Target transform
Robot 1
How does transforming your target (log(target), target^2, etc.) help ML models and when should you use each?
Robot 2
This is not going to be an ELI5 answer, but here is a reason you log transform your target.
TL;DR: When you run a linear regression, you try to approximate your response variable (e.g., target) by drawing a line through a bunch of points and you want the line to be as close to the response variable for those points as possible. Sometimes though, those points don’t follow a straight line. They might follow a curvy line, in which case a simple line through the points doesn’t approximate your target very well. In some of those scenarios, you can log transform your target to make the relationship between those points and your response variable more like a straight line. The following images from Code Academy show the bad:
![]()
And the good:
![]()
Robot 3
This is specific to linear models that fit a straight line. For tree-based models like XGBoost, you don’t need to transform your target (or any other variable)!
Robot 4
Yeah—log-transforming specifically was born out of trying to better meet the assumptions in linear regression (when they're violated). I have seen some cases where log-transformations can help from the predictive performance standpoint. (AKA when your target has a really long tail, log-transforming makes this tail smaller and this sometimes helps models understand the target better.)
Robot 5
Honey, I shrunk the target variable.
Robot 3
Robot 4, you can also use a log link loss function (such as poisson loss) on both XGBoost and many linear regression solvers. I prefer that over the log transform, as the log transform biases the predicted mean, which makes your lift charts look funny on the scale of the original target.
But it really depends on the problem and what you’re trying to model.
Robot 4
Or use inverse hyperbolic sine amirite? 😂
Robot 1
Thanks all! Very helpful. Robot 4, hyperbolic sine amirite is the name of my favorite metal band.
What is target encoding?
Machine learning models don't understand categorical data, so you need to turn the categories into numbers to be able to do math with them. Some example methods to do target encoding include:
-
One-hot encoding is a way to turn categories into numbers by encoding categories as very wide matrices of 0s and 1s. This works well for linear models.
-
Target encoding is a different way to turn a categorical into a number by replacing each category with the mean of the target for that category. This method gives a very narrow matrix, as the result is only one column (vs. one column per category with a one-hot encoding).
Although more complicated, you can also try to avoid overfitting while using target encoding—DataRobot's version of this is called credibility encoding.
What is credibility weighting?
Credibility weighting is a way of accounting for the certainty of outcomes for data with categorical labels (e.g., what model vehicle you drive).
For popular vehicle category types, e.g. Ford F-series was the top-selling vehicle in USA in 2018, there will be many people in your data, and you will be more certain that the historical outcome is reliable. For unpopular category types, e.g., Smart Fortwo was ranked one of the rarest vehicle models in the US in 2017, you may only have one or two people in your data, and you will not be certain that the historical outcome is a reliable guide to the future. Therefore, you will use broader population statistics to guide your decisions.
You know that when you toss a coin, you can't predict with any certainty whether it is going to be heads or tails, but if you toss a coin 1000 times, you are going to be more certain about how many times you see heads (close to 500 times if you're doing it correctly).
What is overfitting?
You tell Goodreads that you like a bunch of Agatha Christie books, and you want to know if you'd like other murder mysteries. It says “no,” because those other books weren't written by Agatha Christie.
Overfitting is like a bad student who only remembers book facts but does not draw conclusions from them. Any life situation that wasn't specifically mentioned in the book will leave them helpless. But they'll do well on an exam based purely on book facts (that's why you shouldn't score on training data).
What are offsets?
Let's say you are a 5-year-old who understands linear models. With linear regression, you find that betas minimize the error, but you may already know some of the betas in advance. So you give the model the value of those betas and ask it to go find the values of the other betas that minimize error. When you give a model an effect that’s known ahead of time, you're giving the model an offset.
What is SVM?
Let's say you build houses for good borrowers and bad borrowers on different sides of the street so that the road between them is as wide as possible. When a new person moves to this street, you csn see which side of the road they're on to determine if they're a good borrower or not. SVM learns how to draw this "road" between positive and negative examples.
SVMs are also called “maximum margin” classifiers. You define a road by the center line and the curbs on either side, and then try to find the widest possible road. The curbs on the side on the road are the “support vectors”.
Closely related term: Kernel Trick.
In the original design, SVM could only learn roads that are straight lines, however, kernels are a math trick that allows them to learn curve-shaped roads. Kernels project the points into a higher dimensional space where they are still separated by a linear "road," but in the original space, they are no longer a straight line.
The ingenious part about kernels compared to manually creating polynomial features in logistic regression, is that you don't have to compute those higher-dimensional coordinates beforehand because kernel is always applied to a pair of points and only needs to return a dot product, not the coordinates. This makes it very computationally efficient.
Interesting links:
- Help me understand Support Vector Machines on Stack Exchange.
Particle swarm vs. GridSearch
GridSearch takes a fixed amount of time but may not find a good result.
Particle swarm takes an unpredictable, potentially unlimited amount of time, but can find better results.
You’ve successfully shown up to Black Friday at Best Buy with 3 of your friends and walkie talkies. However, you forgot to look at the ads in the paper for sales. Not to worry, you decided the way you were going to find the best deal in the Big Blue Box is to spread out around the store and walk around for 1 minute to find the best deal and then call your friends and tell them what you found. The friend with the best deal is now an anchor and the other friends start moving in that direction and repeat this process every minute until the friends are all in the same spot (2 hours later), looking at the same deal, feeling accomplished and smart.
You’ve successfully shown up to Black Friday at Best Buy with 3 of your friends. However, you forgot to look at the ads in the paper for sales and you also forgot the walkie talkies. Not to worry, you decided the way you were going to find the best deal in the Big Blue Box is to spread out around the store in a 2 x 2 grid and grab the best deal in the area then meet your friends at the checkout counter and see who has the best deal. You meet at the checkout counter (5 minutes later), feeling that you didn’t do all you could, but happy that you get to go home, eat leftover pumpkin pie and watch college football.
Why is gridsearch important?
Let’s say that you’re baking cookies and you want them to taste as good as they possibly can. To keep it simple, let’s say you use exactly two ingredients: flour and sugar (realistically, you need more ingredients but just go with it for now).
How much flour do you add? How much sugar do you add? Maybe you look up recipes online, but they’re all telling you different things. There’s not some magical, perfect amount of flour you need and sugar you need that you can just look up online.
So, what do you decide to do? You decide to try a bunch of different values for flour and sugar and just taste-test each batch to see what tastes best.
- You might decide to try having 1 cup, 2 cups, and 3 cups of sugar.
- You might also decide to try having 3 cups, 4 cups, and 5 cups of flour.
In order to see which of these recipes is the best, you’d have to test each possible combination of sugar and of flour. So, that means:
- Batch A: 1 cup of sugar & 3 cups of flour
- Batch B: 1 cup of sugar & 4 cups of flour
- Batch C: 1 cup of sugar & 5 cups of flour
- Batch D: 2 cups of sugar & 3 cups of flour
- Batch E: 2 cups of sugar & 4 cups of flour
- Batch F: 2 cups of sugar & 5 cups of flour
- Batch G: 3 cups of sugar & 3 cups of flour
- Batch H: 3 cups of sugar & 4 cups of flour
- Batch I: 3 cups of sugar & 5 cups of flour
If you want, you can draw this out, kind of like you’re playing the game tic-tac-toe.
| 1 cup of sugar | 2 cups of sugar | 3 cups of sugar | |
|---|---|---|---|
| 3 cups of flour | 1 cup of sugar & 3 cups of flour | 1 cup of sugar & 4 cups of flour | 1 cup of sugar & 5 cups of flour |
| 4 cups of flour | 2 cups of sugar & 3 cups of flour | 2 cups of sugar & 4 cups of flour | 2 cups of sugar & 5 cups of flour |
| 5 cups of flour | 3 cups of sugar & 3 cups of flour | 3 cups of sugar & 4 cups of flour | 3 cups of sugar & 5 cups of flour |
Notice how this looks like a grid. You are searching this grid for the best combination of sugar and flour. The only way for you to get the best-tasting cookies is to bake cookies with all of these combinations, taste test each batch, and decide which batch is best. If you skipped some of the combinations, then it’s possible you’ll miss the best-tasting cookies.
Now, what happens when you’re in the real world and you have more than two ingredients? For example, you also have to decide how many eggs to include. Well, your “grid” now becomes a 3-dimensional grid. If you decide between 2 eggs and 3 eggs, then you need to try all nine combinations of sugar and flour for 2 eggs, and you need to try all nine combinations of sugar and flour for 3 eggs.
The more ingredients you include, the more combinations you'll have. Also, the more values of ingredients (e.g. 3 cups, 4 cups, 5 cups) you include, the more combinations you have to choose.
Applied to Machine Learning: When you build models, you have lots of choices to make. Some of these choices are called hyperparameters. For example, if you build a random forest, you need to choose things like:
- How many decision trees do you want to include in your random forest?
- How deep can each individual decision tree grow?
- At least how many samples must be in the final “node” of each decision tree?
The way we test this is just like how you taste-tested all of those different batches of cookies:
- You pick which hyperparameters you want to search over (all three are listed above).
- You pick what values of each hyperparameter you want to search.
- You then fit a model separately for each combination of hyperparameter values.
- Now it’s time to taste test: you measure each model’s performance (using some metric like accuracy or root mean squared error).
- You pick the set of hyperparameters that had the best-performing model. (Just like your recipe would be the one that gave you the best-tasting cookies.)
Just like with ingredients, the number of hyperparameters and number of levels you search are important.
- Trying 2 hyperparameters (ingredients) of 3 levels apiece → 3 * 3 = 9 combinations of models (cookies) to test.
- Trying 2 hyperparameters (ingredients) of 3 levels apiece and a third hyperparameter with two levels (when we added the eggs) → 3 * 3 * 2 = 18 combinations of models (cookies) to test.
The formula for that is: you take the number of levels of each hyperparameter you want to test and multiply it. So, if you try 5 hyperparameters, each with 4 different levels, then you’re building 4 * 4 * 4 * 4 * 4 = 4^5 = 1,024 models.
Building models can be time-consuming, so if you try too many hyperparameters and too many levels of each hyperparameter, you might get a really high-performing model but it might take a really, really, really long time to get.
DataRobot automatically GridSearches for the best hyperparameters for its models. It is not an exhaustive search where it searches every possible combination of hyperparameters. That’s because this would take a very, very long time and might be impossible.
In one line, but technical: GridSearch is a commonly-used technique in machine learning that is used to find the best set of hyperparameters for a model.
Bonus note: You might also hear RandomizedSearch, which is an alternative to GridSearch. Rather than setting up a grid to check, you might specify a range of each hyperparameter (e.g. somewhere between 1 and 3 cups of sugar, somewhere between 3 and 5 cups of flour) and a computer will randomly generate, say, 5 combinations of sugar/flour. It might be like:
- Batch A: 1.2 cups of sugar & 3.5 cups of flour.
- Batch B: 1.7 cups of sugar & 3.1 cups of flour.
- Batch C: 2.4 cups of sugar & 4.1 cups of flour.
- Batch D: 2.9 cups of sugar & 3.9 cups of flour.
- Batch E: 2.6 cups of sugar & 4.8 cups of flour.
Keras vs. TensorFlow
In DataRobot, “TensorFlow" really means “TensorFlow 0.7” and “Keras” really means “TensorFlow 1.x".
In the past, TensorFlow had many interfaces, most of which were lower level than Keras, and Keras supported multiple backends (e.g., Theano and TensorFlow). However, TensorFlow consolidated these interfaces and Keras now only supports running code with TensorFlow, so as of Tensorflow 2.x, Keras and TensorFlow are effectively one and the same.
Because of this history, upgrading from an older TensorFlow to a new TensorFlow is easier to understand than switching from TensorFlow to Keras.
ELI5 example
Keras vs. Tensorflow is like an automatic coffee machine vs. grinding and brewing coffee manually.
There are many ways to make coffee, meaning TensorFlow is not the only technology that can be used by Keras. Keras offers "buttons" (interface) that is powered by a specific "brewing technology" (TensorFlow, CNTK, Theano or something else, known as the Keras backend).
Earlier, DataRobot used the lower-level technology, TensorFlow, directly. But just like grinding and brewing coffee manually, this takes a lot more effort and maintenance, and increased the maintenance burden as well, so DataRobot switched to a higher-level technology, like Keras, that provides many nice things under the hood, for example, delivering more advanced blueprints in the product more quickly, which would have taken a lot of effort if manually implemented in TensorFlow.
What is quantile regression loss?
Typical loss function: I want to predict a value associated with what happens on average.
Quantile loss: I want to predict a value associated with what happens in a certain percentile.
Why would we do this?
- Intentionally over or under predict: I'm okay with overpredicting supply because stock-outs are very costly.
- Understanding the features that drive behavior in the extremes of your target: Say I wanna know what player-tracking metrics lead to better 3-point shooting in the NBA. I can use quantile loss to surface the metrics related to the best 3-point shooter rather than the average 3-point shooter.
What is F1 score?
Let's say you have a medical test (ML model) that determines if a person has a disease. Like many tests, this test is not perfect and can make mistakes (call a healthy person unhealthy or otherwise).
We might care the most about maximizing the % of truly sick people among those our model calls sick (precision), or we might care about maximizing the % of detection of truly sick people in our population (recall).
Unfortunately, tuning towards one metric often makes the other metric worse, especially if the target is imbalanced. Imagine you have 1% of sick people on the planet and your model calls everyone on the planet (100%) sick. Now it has a perfect recall score but a horrible precision score. On the opposite side, you might make the model so conservative that it calls only one person in a billion sick but gets it right. That way it has perfect precision but terrible recall.
F1 score is a metric that considers precision and recall at the same time so that you could achieve balance between the two.
How do you consider precision and recall at the same time? Well, you could just take an average of the two (arithmetic mean), but because precision and recall are ratios with different denominators, arithmetic mean doesn't work that well in this case and a harmonic mean is better. That's exactly what an F1 score is—a harmonic mean between precision and recall.
Interesting links:
- Explanations of Harmonic Mean.
Types of learning
Contextual bandits
It's like a bandit, only with context lol. First you need to know what bandits are, or multi-armed bandits to be precise. It's a common problem that can be solved with reinforcement learning. The idea is that you have a machine with two or more levers. Each time you pull a lever you get a random reward. The mean reward of each lever might be different, and of course there is noise, so it's not obvious. Your task is to find the best lever to pull, and while you search to not pull the wrong one too frequently (minimizing regret).
How to do it is outside the scope of this answer, but the winning strategy is "optimism in face of uncertainty", which I like! Now a contextual bandit is the same problem, only that each time you pull you are also given additional information.
Dang. Robot 1 beat me to it.
Multiarmed bandit: You have a bunch of choices… you can make only one.
If you try a choice over and over, you can decide how much you like or don’t like it. But you can’t try all your choices a bajillion times, because no one has time for that.
Given a fixed budget of chances to make a choice, how much do you figure out if/when to try each one to have the bst aggregate returns.
Contextual bandits: Same as multi-armed bandit. But you aren’t making the exact same choice over and over. Instead, you get information about the situation… and that information varies from one decision to the next. And you need a rule for which choice you make under what circumstance
Robot 3
Does this mean contextual bandits are stopping to make a decision of what their next step is when they finish their current one? While a standard multi-armed bandit has a planned path at the start that it follows?
Robot 2
Neither necessarily has planned paths from the beginning. In each setting, one can see how things are going...decide the option just tried isn't as good as expected, make a change to something. The difference is that in contextual bandits, there is some extra information about each decision that you might have that makes it different from the previous decision. I think an example might be helpful
ELI5 example
The standard example is playing the slot machines. There are 100 machines. You have time to play 10000 times. You want to win as much money as possible. And critically, you think some machines are better than others. You just don’t know which machines pay out the most in general.
This sounds like a multi-armed bandit. An example strategy is to always play machine 1. Or always randomly pick. Or play each one 10 times and then use the rest of your turns on whichever has given the most wins. There are lots of strategies...but the problem set-up is what makes this a multi-armed bandit problem.
You can learn as you go, even in the multi-armed bandit problem
Now...if an employee tells you that the casino set up the machines so each machine is more likely to pay off when lots of people are watching...that makes it a contextual bandit problem.
For each of your 10000 turns, you will look around and see which machine has a lot of people standing around it. So, each spin is a little different. Before, a good strategy was to try to figure out which machine is best, and then keep playing it. But now, you want to consider both which machine is best (which doesn’t change from spin to spin, even if your guess about which is best might change)...as well as the other factor of where people are standing
Robot 3
So contextual bandits include context outside of 1. choices being made and 2. the outcome of all previous choices, while non-contextual multi-arm bandits focus internally to those factors only?
Robot 2
Yep. It’s spot on now.
Robot 1
It should be noted that this whole bandits thing is more of a theoretical simplification to reason about reinforcement learning strategies. The real world rarely is as simple. Next best action type use cases can be approximated by a multi-armed bandit. But as soon as you know some information about your users, the actions, the current situation, the recent past...sure it's now a contextual bandit, but it's also just as well, and in many people's opinion better, to just use supervised ML.
Reinforcement learning
Reinforcement learning is about how you approach the definition of the problem and the process of learning (which requires and environment able to communicate the reward signal).
Let's say you want to find the best restaurant in town. To do this, you have to go to one, try the food, and decide if you like it or not. Now, every time you go to a new restaurant, you will need to figure out if it is better than all the other restaurants you've already been to, but you aren't sure about your judgement, because maybe a dish you had was good/bad compared to others offered in that restaurant. Reinforcement learning is the targeted approach you can take to still be able to find the best restaurant for you, by choosing the right amount of restaurants to visit or choosing to revisit one to try a different dish. It narrows down your uncertainty about a particular restaurant, trading off the potential quality of unvisited restaurants.
Reinforcement learning is like training a dog—for every action your model takes, you either say "good dog" or "bad dog". Over time, by trial and error, the model learns the behavior so as to maximize the reward. Your job is to provide the environment to respond to the agent's (dog's) actions with numeric rewards. Reinforcement learning algorithms operate in this environment and learn a policy.
It is similar to the training of Arya Stark in GoT—every time she does some task successfully, she is rewarded. Else, a penalty is given by the faceless man. Eventually she learns the art after several rounds of enforcement of the process (and beats Brienne).
Interesting facts
-
DataRobot offers an AI Accelerator on reinforcement learning that shows a basic form that doesn't require a deep understanding of neural networks or advanced mathematics.
-
Reinforcement learning works better if you can generate an unlimited amount of training data, like with Doom/Atari, AlphaGo games, and so on. You need to emulate the training environment so the model can learn its mechanics by trying different approaches a gazillion times.
-
A good reinforcement learning framework is OpenAI Gym. In it you set some goal for your model, put it in some environment, and keep it training until it learns something.
-
Tasks that humans normally consider "easy" are actually some of the hardest problems to solve. It's part of why robotics is currently behind machine learning. It is significantly harder to learn how to stand up or walk or move smoothly than it is to perform a supervised multiclass prediction with 25 million rows and 200 features.
Deep learning
Imagine your grandma Dot forgot her chicken matzo ball soup recipe. You want to try to replicate it, so you get your family together and make them chicken matzo ball soup.
It’s not even close to what grandma Dot used to make, but you give it to everyone. Your cousin says “too much salt,” your mom says, “maybe she used more egg in the batter,” and your uncle says, “the carrots are too soft.” So you make another one, and they give you more feedback, and you keep making chicken matzo ball soup over until everyone agrees that it tastes like grandma Dot's.
That’s how a neural network trains—something called backpropagation, where the errors are passed back through the network, and you make small changes to try to get closer to the right answers.
Transfer learning
Short version: When you teach someone how to distinguish dogs from cats, the skills that go into that can be useful when distinguishing foxes and wolves.
Example
You are a 5-year old whose parents decided you need to learn tennis, while you are wondering who "Tennis" is.
Every day your parents push you out the door and say, “go learn tennis and if you come back without learning anything today, there is no food for you.”
Worried that you'll starve, you started looking for "Tennis." It took a few days for you to figure out that tennis is a game and where tennis is played. It takes you a few more days to understand how to hold the racquet and how to hit the ball. Finally, by the time you figured out the complete game, you are already 6 years old.
Your parents took you to the best tennis club in town, and found Roger Federer to coach you. He can immediately start working with you—teaching you all about tennis and makes you tennis-ready in just a week. Because this guy also happened to have a lot of experience playing tennis, you were able to take advantage of all his tips, and within a few months, you are already one of the best players in town.
Scenario 1 is similar to how a regular machine learning algorithm starts learning. With the fear of being punished, it starts looking for a way to learn what is being taught and slowly starts learning stuff from scratch. On the other hand, by using Transfer Learning the same ML algorithm has a much better guidance/starting ground or in other words it is using the same ML algorithm that was trained on a similar data as an initialization point so that it can quickly learn the new data but at a much faster rate and sometimes with better accuracy.
Federated machine learning
The idea is that once a central model is built, you can retrain the model to use in different edge devices.
McDonald's set aside its menu (central model) and gives the different franchise flexibility to use it. Then, McDonald's locations in India use that recipe and tweak it to include McPaneer Tikka burger. To do that tweaking, the Indian McDonald's did not need to reach out to the central McDonald's—they can update those decisions locally. It's advantageous because your models will be updated faster without having to send the data to some central place all the time. The model can use the devices local data (e.g., smartphone usage data on your smartphone) without having to store it in a central training data storage, which can also be good for privacy.
One example that Google gives is the smart keyboard on your phone. There is a shared model that gets updated based on your phone usage. All that computing is happening on your phone without having to store your usage data in a central cloud.