Modeling
Modeling methods
Partitioning features vs. group partitioning
Note that partitioning methods have been renamed in NextGen:
| DataRobot Classic name | NextGen name |
|---|---|
| Partition feature | User-defined grouping |
| Group partitioning | Automated grouping |
Robot 1
What is the difference between group partitioning and partition feature? Can you provide examples? How does the TVH split look for 25 unique values?
Robot 2
Ordinarily in cross validation, records are randomly assigned to a fold of data. In group partitioning and partition feature, records are assigned to a fold by the selected feature. For example:
Let's say you partition using a state in the United States. There are 50 states in the United States.
- Group partitioning: I choose to do 4-fold cross validation. Every row where Texas is a state is in the same fold. Some other states are also in this fold.
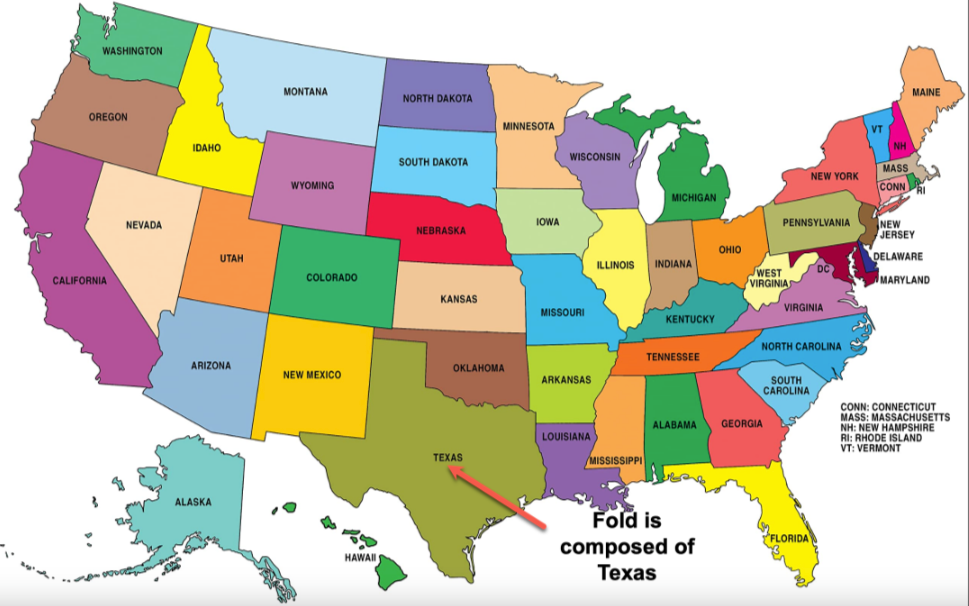
- Partition feature: Each state gets its own fold and it is 50-fold cross validation.
In fact, a regional view of the United States is analogous to group partitioning:
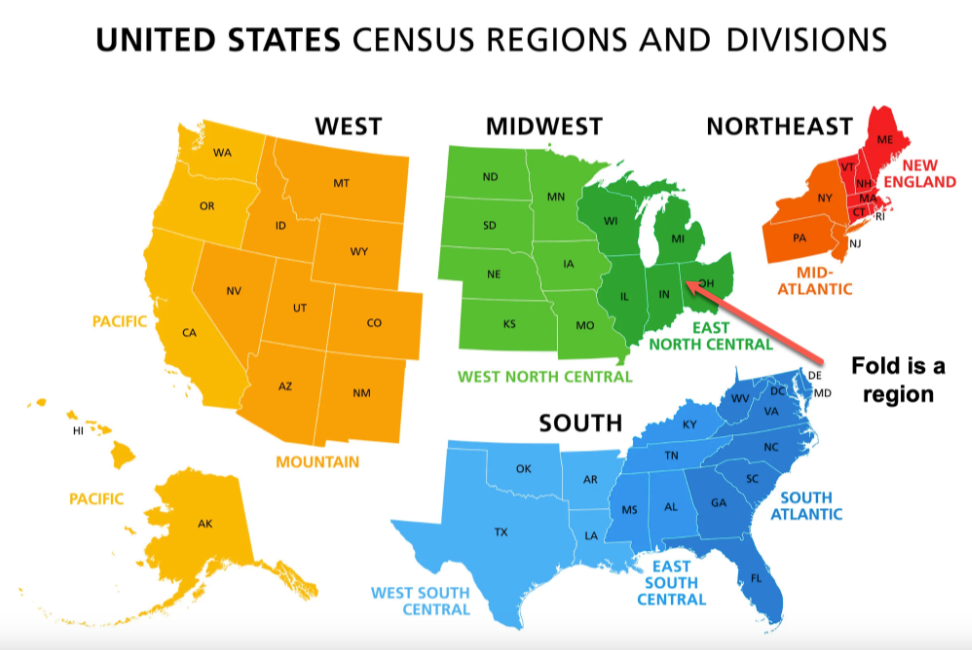
Whereas a state-by-state view is analogous to partition feature.
Because having 50 folds is often impractical, DataRobot recommends group partitioning for features with more than 25 unique values.
Optimal binning in DataRobot
Robot 1
Does DataRobot help do optimal binning (on numeric features)?
I know that in our GAM model, DataRobot will bin each of the numeric features based on its partial dependence from an XGBoost model. Anything else that we do that I am not aware of?
Robot 2
We use a decision tree to find bins. It's pretty optimal. It may not be perfectly optimal, but it does a good job finding the right bins.
Robot 3
Single decision tree on single feature—produces leaves with at least minimum number of target values. So bins are variable size and are designed to have enough target statistics per leaf. The boundaries are just sorted splits. An XGBoost model is used to smooth the target and decision tree operate on XGB predictions.
Anomaly detection vs. other machine learning problems
Anomaly detection is an unsupervised learning problem.
This means that it does not use a target and does not have labels, as opposed to supervised learning which is the type of learning many DataRobot problems fall into. In supervised learning there is a "correct" answer and models predict that answer as close as possible by training on the features.
Supervised = I know what I’m looking for.
Unsupervised = Show me something interesting.
There are a number of anomaly detection techniques, but no matter what way you do it, there is no real "right answer" to whether something is an anomaly or not—it's just trying to group common rows together and find a heuristic way to tell you "hey wait a minute, this new data doesn't look like the old data, maybe you should check it out."
In some anomaly detection use cases there are millions of transactions that require a manual process of assigning labels. This is impossible for humans to do when you have thousands of transactions per day, so they have large amounts of unlabeled data. Anomaly detection is used to try and pick up the abnormal transactions or network access. A ranked list can then be passed on to a human to manually investigate, saving them time.
ELI5 example
A parent feeds their toddler; the toddler throws the food on the floor and Mom gets mad. The next day, the same thing happens. The next day, Mom feeds the kid, the kid eats the food, and Mom's happy. The kid is particularly aware of Mom's reaction, and that ends up driving their learning (or supervising their learning), i.e., they learn the association between their action and mom's reaction—that's supervised.
Mom feeds the kid; the kid separates his food into two piles: cold and hot. Another day, the kid separates the peas, carrots, and corn. They're finding some structure in the food, but there isn't an outcome (like Mom's reaction) guiding their observations.
Learn more about unsupervised machine learning.
API vs. SDK
API: "This is how you talk to me."
SDK: "These are the tools to help you talk to me."
API: "Talk into this tube."
SDK: "Here's a loudspeaker and a specialized tool that holds the tube in the right place for you."
Example
DataRobot's REST API is an API but the Python and R packages are a part of an SDK in DataRobot because they provide an easier way to interact with the API.
API: Bolts and nuts
SDK: Screwdrivers and wrenches
Learn more about APIs and SDKs in DataRobot.
Model integrity and security
Robot 1
What measures does the platform support to assure the integrity and security of AI models?
For example, do we provide adversarial training, reducing the attack surface through security controls, model tampering detection, and model provenance assurance?
Robot 2
We have a variety of approaches:
-
While we don’t use adversarial training explicitly, we do make heavy use of tree-based models, such as XGBoost, which are very robust to outliers and adverse examples. These models do not extrapolate, and we fit them to the raw, unprocessed data. Furthermore, since XGBoost only uses the order of the data, rather than the raw values, large outliers do not impact its results, even if those outliers are many orders of magnitude. In our internal testing, we’ve found that XGBoost is very robust to mislabeled data as well. If your raw training data contains outliers and adverse examples, XGBoost will learn how to handle them.
-
All of our APIs are protected by API keys. We do not allow general access, even for predictions. This prevents unauthorized users from accessing anything about a DataRobot model.
-
We do not directly allow user access to model internals, which prevents model tampering. The only way to tamper with models is through point 1, and XGBoost is robust to adverse examples. (Note that rating table models and custom models do allow the user to specify the model, and should therefore be avoided in this case. Rating table models are fairly simple though, and for custom models, we retain the original source code for later review).
-
In MLOPs we provide a full lineage of model replacements and can tie each model back to the project that created it, including the training data, models, and tuning parameters.
Robot 1
Do not extrapolate?
Robot 2
That is a huge factor in preventing adverse attacks. Most of our models do not extrapolate.
Take a look at the materials on bias and fairness too. Assessing a model's bias is very closely related to protecting against adverse attacks. Here are the docs on bias and fairness functionality which include options from the settings when starting a project, model insights, and deployment monitoring.
Poisson optimization metric
Robot 1
Hello team, other than setting up the project as a regression problem, do we have any suggestions for the following?
- Does DR have any plans to explicitly support modeling count data?
- How does DR suggest customers model counts if they want to use the platform?
This has come up a few times (and in another project yesterday, where the response is a count, and they ignore this and just upload and model as regression).
Robot 1
The real question I’m asking is whether any of the blueprints that hint at modeling counts actually model counts? I think the XGB + Poisson loss ones do. Also, the GLMs-based blueprints (like elastic net and such) naturally support Poisson/NB distributions, but wasn’t sure if DataRobot supported those or not?
Robot 2
Use Poisson as the project metric! DataRobot has great support for count data. You don’t need to worry about logging the data: we handle the link function for you.
We have Poisson GLMs, Poisson XGBoost, and Poisson neural networks for modeling count data! They work great!

Robot 2
We also support weights, offsets, and exposure for projects that model counts (e.g., projects using poisson loss).

Robot 3
I bet that just loading the data into our platform and hitting start will do the trick 9/10 times. Based on the EDA analysis of the target, sometimes the recommended optimization metric will already be set up for you.
Import for Keras or TF
Robot 1
Is there a way to import .tf or .keras models?
Robot 2
We don’t allow any form of model import (.pmml, .tf, .keras, .h5, .json etc.), except for custom models. That said, you can use custom models to do whatever you want, including importing whatever you wish.
Robot 1
I have a customer trying to do Custom Inference. Can he use this or only .h5? I don't really understand the tradeoff of one version of the model objects versus another. I've only used .h5 and JSON. I think he was also curious if we have any support for importing JSON weights.
Robot 2
We do not support importing model files, except for custom models—he'll need to write a custom inference model to load the file and score data. But yes, we support custom inference models. You can do literally whatever you want in custom inference models.
Robot 1
Thanks, sorry if I'm being dense / confused—so with Custom Inference he should be able to load the .pb, .tf, .keras files?
Robot 2
Yes. He will need to write his own Python code. So if he can write a Python script to load the .pd, .tf, .keras, or .whatever file and score data with it, he can make that script a custom inference model.
Robot 1
Ohhh of course :), now I understand. Duh, Robot 1. Thanks!
Default language change in Japanese
Robot 1
Why did the default language change when modeling Japanese text features?
Hi team, this is a question from a customer:
When modeling with Japanese text features, the "language" used to be set to "english" by default. However, when I recently performed modeling using the same data, the setting was changed to "language=japanese". It has been basically set to "language=english" by default until now, but from now on, if I input Japanese, will it automatically be set to "language=japanese"?
I was able to reproduce this event with my data. The model created on July 19, 2022 had language=english, but when I created a model today with the same settings, it had language=japanese. Is this a setting that was updated when the default was changed from "Word N-Gram" to "Char N-Gram"?
Robot 2
Before, for every dataset we showed "english", which is incorrect. Now after NLP Heuristics Improvements, we dynamically detect and set the dataset's language.
Additionally, we found that char-grams for Japanese datasets perform better than word-grams, thus we switched to char-grams for better speed & accuracy. But to keep Text AI Word Cloud Insights in a good shape, we also train 1 word-gram based blueprint so you can inspect both char & word-gram WCs.
Let me know if you have more questions, happy to help!
Robot 1
Robot 2, thank you for the comment. I will tell the customer that NLP has improved and language is now properly set. I was also able to confirm that the word-gram based BP model was created as you mentioned. Thanks!
Visualizations
What does the Lift Chart reveal?
The Lift Chart helps to understand how "well-calibrated" a model is, which is a fancy way of saying "when the model makes a prediction for a group of observations with a similar output value, how well do the model's predictions match what actually happened?"
ELI5 examples
You have 100 rocks. Your friend guesses the measurement of each rock while you actually measure each one. Next, you put them in order from smallest to largest (according to your friend's guesses, not by how big they actually are). You divide them into groups of 10 and take the average size of each group. Then, you compare what your friend guessed with what you measured. This allows you to determine how good your friend is at guessing the size of rocks.
Let's say you build a model for customer churn, and you want to send out campaigns to 10% of your customers. If you use a model to target that 10% with higher probability of churn, then you have more chance of targeting clients that might churn vs. not using model and just sending your campaigns randomly. Cumulative lift chart shows this more clearly.
The TV weatherperson says there's an 80% chance of rain for the next 5 days. If it rains only 1 of those days, you might be angry with your weatherperson because the probability they gave you doesn't match up with how you think of probability. The Lift Chart helps to visualize that for a model. When a model makes predictions, do those predictions line up with what happens and what we think those predictions should mean?"
More technical: Build a model predicting whether or not it will rain. Over 100 days, the model says there's an 80% chance of rain for each day. If, in the actual data, it rains 80 out of those 100 days, then that model is good. If there is rain on only 40 of those 100 days, then the model is not very good.
A Lift Chart takes the observations, put them into groups, and see how well the predictions match what actually happens. Here, the Lift Chart helps answer the question "if the model predicts X%, does the prediction match how I interpret X% as a human?"
If the "predicted" and "actual" lines on the Lift Chart mostly line up, then the model does a good job predicting in a way that makes sense as humans. If there is a spot where the "predicted" line is far above the "actual" line, then the model is predicting too high (the model thinks it will rain 80% of the time but it actually only rained 40% of the time).
If there is a spot where the "actual" line is far above the "predicted" line, then the model is predicting too low (the model thinks it will rain 80% of the time but it really rained 99% of the time).
There's a good joke that captures what we're trying to measure: A man with his head in an oven and his feet in the freezer says on average he's comfortable.
Learn more about Lift Charts.
What is the ROC Curve?
The ROC Curve is a measure of how well a good model can classify data, and it's also a good off-the-shelf method of comparing two models. You typically have several different models to choose from, so you need a way to compare them. If you can find a model that has a very good ROC curve, meaning the model classifies with close to 100% True Positive and 0% False Positive, then that model is probably your best model.
ELI5 example
Imagine you want to receive an answer to the question "Do aliens exist?" Your best plan to get an answer to this question is to interview a particular stranger by asking "Did you see anything strange last night?" If they say "Yes", you conclude aliens exist. If say "No", you conclude aliens don't exist. What's nice is that you have a friend in the army who has access to radar technology so they can determine whether an alien did or did not show up. However, you won't see your friend until next week, so for now conducting the interview experiment is your best option.
Now, you have to decide which strangers to interview. You inevitably have to balance whether you should conclude aliens exist now, or just wait for your army friend. You get about 100 people together and you will conduct this experiment with each of them tomorrow. The ROC curve is a way to decide which stranger you should interview because people are blind, drink alcohol, shy, etc. It represents a ranking of each person and how good they are, and at the end you pick the "best" person, and if the "best" person is good enough, you go with the experiment.
The ROC curve's y-axis is True Positives, and the x-axis is False Positives. You can imagine people that drink a lot of wine are ranked on the top right of the curve. They think anything is an alien, so they have a 100% True Positive ranking. They will identify an alien if one exists, but they also have 100% False Positive ranking—if you say everything is an alien, you're flat out wrong when there really aren't aliens. People ranked on the lower left don't believe in aliens, so nothing is an alien because aliens never existed. They have a 0% False Positive ranking, and 0% True Positive ranking. Again, nothing is an alien, so they will never identify if aliens exist.
What you want is a person with a 100% True Positive ranking and 0% False Positive ranking—they correctly identify aliens when they exist, but only when they exist. That's a person that is close to the top-left of the ROC Chart. So your procedure is, take 100 people, and rank them on this space of True Positives vs. False Positives.
Learn more about the ROC Curve.
What are Hotspots?
Hotspots can give you feature engineering ideas for subsequent DataRobot projects. Since they act as simple IF statements, they are easy to add to see if your models get better results. They can also help you find clusters in data where variables go together, so you can see how they interact.
ELI5 example
If Hotspots could talk to the user: "The model does some heavy math behind the scenes, but let's try to boil it down to some if-then-else rules you can memorize or implement in a simple piece of code without losing much accuracy. Some rules look promising, some don't, so take a look at them and see if they make sense based on your domain expertise."
If a strongly-colored, large rule was something like "Age > 65 & discharge_type = 'discharged to home'" you might conclude that there is a high diabetes readmission rate for people over 65 who are discharged to home. Then, you might consider new business ideas that treat the affected population to prevent readmission, although this approach is completely non-scientific.
Learn more about Hotspots visualizations.
N-grams and prediction confidence
Robot 1
How do we know which words/n-grams increase confidence in the predictions?
Robot 2
The Word Cloud is useful for this!
Robot 3
You can also look at the coefficients directly for any linear model with n-grams.
Robot 2
Finally we’ve got Prediction Explanations for text features.
Robot 1
Thanks for the response. I love these and they make sense. I recommended word cloud but she indicated that that was intensity not confidence (to me they are highly related).
Robot 2
Our linear models are regularized so low confidence words will be dropped.
Word Cloud repeats
Robot 1
Why would a term would show up multiple times in a word cloud?
And for those occurrences, why would they have different coefficients?
Robot 2
Is the word cloud combining multiple text columns?
Robot 1
Ah, yes, that is definitely it, thank you!! Is there a way to see a word cloud on only one feature?
Robot 2
The simplest solution would be to use a feature list and train a model on just the one text feature you’re interested in.
Robot 1
^^ That’s exactly what I ended up doing. Thank you so much for the quick answer.
Alternate use for a payoff matrix
Robot 1
Hello Team. A client and I were putting together numbers for a payoff matrix and had an alternative way to look at things. For them, the goal is to justify cost savings vs identify profit drivers from a use case.
Example:
-
True Positive (benefit): This is the benefit from an order that is correctly predicted as canceled. The benefit is no/limited inventory costs. For example, if the item costs $100 to store typically, but due to cancellation - no additional cost (we put a 0 here). Benefit can come from additional revenue generated through proactive reach out
-
True Negative (benefit): This is the benefit from an order that is correctly predicted as not canceled. The additional benefit / costs are 0 because a customer simply does not cancel this item and continues with shipment ($1000 profit on avg or -100 inventory cost per order)
-
False Positive (cost): This is the cost associated with classifying an order as canceled when it did not cancel. What costs are incurred - Lost opportunity or business since the order is not fulfilled or delayed (-200)
-
False Negative (cost): This is the cost associated with classifying an order as not canceled, when it will actually cancel. We have to incur a cost here for inventory management -$100
Just thought I'd share!
Robot 2
Nice!
Prediction Explanations on small data
Warning
The described workaround is intended for users who are very familiar with the partitioning methods used in DataRobot modeling. Be certain you understand the implications of the changes and their impact on resulting models.
Robot 1
Can I get Prediction Explanations for a small dataset?
For small datasets, specifically those with validation subsets less than 100 rows, we cannot run XEMP Prediction Explanations. (I assume that's true for SHAP also, but I haven't confirmed). Is there a common workaround for this? I was considering just doubling or tripling the dataset by creating duplicates, but not sure if others have used slicker approaches.
Robot 2
It’s not true for SHAP, actually. No minimum row count there. 🤠
I feel like I’ve seen workarounds described in #cfds or #data-science or somewhere... One thing you can do is adjust the partitioning ratios to ensure 100 rows land in Validation. There might be other tricks too.
Robot 1
Right, that second idea makes sense, but you'd need probably > 200 rows. The user has a dataset with 86 rows.
I just don't want to have to eighty-six their use case. 🥁
Robot 2
OK, no dice there. 🎲
I’d want to be really careful with duplicates, but this MIGHT finesse the issues:
-
Train on your actual dataset, do “Training Predictions”, and carefully note the partitions for all rows.
-
Supplement the dataset with copied rows, and add a partition columns such that all original rows go in the same partitions as before, and all copied rows go in the Validation fold. I guess you probably want to leave the holdout the same.
-
Start a new project, select User CV, and train the model. Probably do Training Predictions again and make sure the original rows kept the same prediction values.
-
You should be able to run XEMP now.
Robot 2
I think (fingers crossed) that this would result in the same trained model, but you will have faked out XEMP. However, Validation scores for the modified model would be highly suspect. XEMP explanations would probably be OK, as long as you ensure the copied data didn’t appreciably change the distributions of any features in the Validation set.
I think if you scrupulously kept the Holdout rows the same, and the Holdout scores match in the two models, that is a sign of success.
Robot 1
Right, so if I ran Autopilot again, it would do unreasonably well on that Validation set, but if I just train the same blueprint from the original Autopilot, that would be fine.
Robot 2
Yes. Autopilot would probably run a different sequence of blueprints because the Leaderboard order would be wacky and the winning blueprint would quite likely be different.
It almost goes without saying, but this is more suspect the earlier you do it in the model selection process. If you’re doing a deep dive on a model you’ve almost locked in on, that’s one thing, but if you’re still choosing among many options, it’s a different situation.
Robot 1
Brilliant, thank you!