Features and data
Dataset vs. data source vs. data store vs. database
Data store: A general term used to describe a remote location where your data is stored. A data store may contain one or more databases, or one or more files of varying formats.
Data source: A location within a data store where the data is located. This could be a database table/view, or a path to files along with additional metadata about the data, such as format of the data and format specific information that may be needed to process it.
Database: A specific type of data store that contains a set of related data, and a system that allows you to manage and interact with that data. Different managements systems have different interactions with the data, requirements for how that data is stored, and tools to help manage the data. For example, relational databases, like MySQL, store data in tables with defined columns, while non-relational databases, like MongoDB, have more flexibility in the format of the data being stored.
Dataset: Data, a file or the content of a data source, at a particular point in time.
ELI5 example
- Data store/database = The toy box they are put away into
- Data source = The location inside of the toy box
- Dataset = Toys that have been sorted and put away
Structured vs. unstructured datasets
Structured data is neat and organized—you can upload it right into DataRobot. Structured data is CSV files or nicely organized Excel files with one table.
Unstructured data is messy and unorganized—you have to add some structure to it before you can upload it to DataRobot. Unstructured data is a bunch of tables in various PDF files.
ELI5 example
Let’s imagine that you have a task to predict categories for new Wikipedia pages (Art, History, Politics, Science, Cats, Dogs, Famous Person, etc.).
All the needed information is right in front of you—just go to wikipedia.com and you can find all categories for each page. But the way the information is structured right now is not suitable for predicting categories for new pages. It would be hard to extract some knowledge from this data. On the other hand, if you will query Wikipedia’s databases and form a file with columns corresponding to different features of articles (title, content, age, previous views, number of edits, number of editors) and rows corresponding to different articles, this would be a structured dataset, it is more suitable to extract some hidden value from it using machine learning methods.
Note that text is not always unstructured. For example, you have 1000 short stories, some of which you liked, and some of which you didn't. As 1000 separate files, this is an unstructured problem. But if you put them all together in one CSV, the problem becomes structured, and now DataRobot can solve it.
Training on large datasets
Robot 1
What are some good practices on how to handle AutoML and EDA for larger datasets?
Hi Team—we've got a couple of questions from a customer around our data ingest limits. Appreciate if someone can answer or point me in the right direction.
What are some good practices on how to handle AutoML and EDA for larger datasets?
Robot 2
We are still using this presentation based on my R&D work:
Presentation summary
Background
The original training data converted from a SAS model has 21M records with 6425 features, the physical data size is about 260GB in CSV format. We want to feed in all 21M records with 960+ features, estimated data size will be about 40GB in CSV format.
100GB: 99GB (training) + 1GB (external holdout)
Self-managed: 96 CPUs, 3TB RAM, 50TB HDD
SaaS: Cloud account with 20 modelling workers
Problem statement
Do we really need to train the model on a large dataset?
Divide and conquer approach
- Randomly sample the original dataset into sample of NGB.
- Run Autopilot.
- Deploy the recommended-to-deploy model (trained on 100% of the sampled dataset).
- Take a NGB sample, with all features.
- Run Autopilot.
- Run Feature Impact on the recommended-to-deploy model (trained on 100% of the sampled dataset).
- Use Feature Impact to select the features having impact more than 1%.
- Select those features (>= 1%) from the full dataset, and if the result is less 10GB, model all rows.
- If the result is > 10GB, randomly sample the dataset from Step 5 to 10GB.
Results
- Both divide and conquer approaches (dataset sampling and feature sampling) can challenge models trained on a full-size dataset.
- Full-size trained model vs. dataset sampling: +1.5% (worst case) and +15.2% (best case).
- Full-size trained model vs. feature sampling: -0.7% (worst case) and +8.7% (best case).
- Feature sampling is suitable for datasets containing hundreds of features (or more) and can lead to models that are similar, or even superior, over all metrics (accuracy, training/scoring time) when compared to models trained on a full dataset.
Summarized and ordered categorical features
Let's say you go to the store to shop for food. You walk around the store and put items of different types into your cart, one at a time. Then, someone calls you on the phone and asks you what have in your cart, so you respond with something like "6 cans of soup, 2 boxes of Cheerios, 1 jar of peanut butter, 7 jars of pickles, 82 grapes..."
Learn more about Summarized categorical features.
Robot 1
Does DataRobot recognize ordered categoricals, like grade in the infamous lending club data?
This is a question from a customer:
Can you tell your models that
A < B < Cso that it’s more regularized?
I feel like the answer is that to leverage ordering you would use it as numeric feature. Quite likely a boosting model is at the top, so it’s just used as an ordered feature anyway. If you just leave it as is, our models will figure it out.
When using a generalized linear model (GLM), you would want to leverage this information because you need fewer degrees of freedom in your model; however, I'm asking here to see if I missed some points.
Robot 2
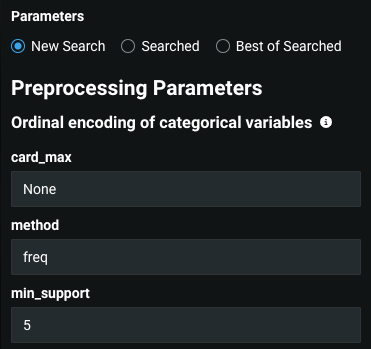
We actually do order these variables for XGBoost models. The default is frequency ordering but you can also order lexically.
Robot 1
You mean ordinal encoding or directly in XGBoost?
Robot 2
Yeah the ordinal encoding orders the data.
Robot 1
Robot 2
Just change frequency to lexical and try it out.
Robot 3

Build your own blueprint and select the cols —explicitly set to freq/lex.
Robot 2
If you’re using a GLM, you can also manually encode the variables in an ordered way, (outside DR):
Use 3 columns:
A: 0, 0, 1
B: 0, 1, 1
C: 1, 1, 1
Lexical works fine in a lot of cases; just do it for all the variables. You can use an mpick to choose different encodings for different columns.
Robot 1
ACE score and row order
What is ACE?
ACE scores (Alternating Conditional Expectations) are a univariate measure of correlation between the feature and the target. ACE scores detect non-linear relationships, but as they are univariate, they do not detect interaction effects.
Robot 1
Does ACE score depend on the order of rows?
Is there any sampling done in EDA2 when calculating ACE score? The case is two datasets which are only different in the order of rows, are run separately with same OTV setting (same date range for partitions, same number of rows in each partition), and there is a visible difference in the ACE scores. Does the ACE score depend on the order of rows?
Robot 2
EDA1 sample will vary based on order of rows for sure. EDA2 starts with EDA1 and then removes rows that are in the holdout too, so project settings can also matter.
Robot 1
There are 8k rows and 70 features, fairly small datasets.
Robot 2
ACE doesn’t need a large sample: It could be 1k or even 100. If the dataset is less than 500MB, then all rows may be in the sample, but the order may be different.
Neural networks and tabular data
Robot 1
Can someone share research on why we don't need neural networks for tabular data?
Hi, I am speaking with a quant team and explaining why you don't need neural networks for tabular data. I've said that "conventional" machine learning typically performs as well or better than neural networks, but can anyone point to research papers to support this point?
Robot 2and Robot 3
Here are a few:
- TABULAR DATA: DEEP LEARNING IS NOT ALL YOU NEED
- Why do tree-based models still outperform deep learning on tabular data?
- Deep Neural Networks and Tabular Data: A Survey
Robot 1
This is great. Thanks!
Robot 3
Not done yet...
This ("Another Deceptive NN for Tabular Data — The Wild, Unsubstantiated Claims about Constrained Monotonic Neural Networks") and also a series of medium posts by Bojan Tunguz, I just read these cause I'm not smart enough for actual papers ¯\_(ツ)_/¯. Also these:
He puts out one of these once a month, basically he beats the neural nets with random forests or untuned GBMs most of the time.
Robot 3
Lol deep learning on tabular data is. Also Robot 3, not smart enough? You could write any one of them. Point them at Bojan Tunguz on Twitter:
Robot 3
Looking...
Robot 4
Here he is again (this is the thread that spawned the blog posts above). Basically this guy has made a name for himself disproving basically every paper on neural nets for tabular data.
Internally, our own analytics show that gradient-boosted trees are the best model for 40% of projects, linear models win for 20% of projects, and keras/deep learning models are less than 5% of projects.
Basically, Xgboost is roughly 10x more useful than deep learning for tabular data.
If they're quants, they can be convinced with data!
Robot 4
Robot 1, also we have at least 2 patents for our deep learning on tabular data methods. We spent 2 years building the state of the art here, which includes standard MLPs, our own patented residual architecture for tabular data, and tabular data "deep CTR models" such Neural Factorization machines and AutoInt.
Even with 2 years worth of work and the best data science team I've worked with in my career and we still couldn't get to "5% of projects have a deep learning model as the best model".
What is an inlier?
Robot 2
An inlier is a data value that lies in the interior of a statistical distribution and is in error.
Robot 3
It is is an observation lying within the general distribution of other observed values, generally does not perturb the results but is nevertheless non-conforming and unusual. Inliers can be difficult to distinguish from good data values.
Example
An inlier might be a value in a record that is reported in the wrong units, say degrees Fahrenheit instead of degrees Celsius.
Robot 1
What can be the danger of having them in my dataset?
Robot 3
While they will not generally affect the statistical results, the identification of inliers can sometimes signal an incorrect measurement, and thus be useful for improving data quality.
Robot 1
Can I identify them just by looking?
Robot 2
For a single variable in isolation, the identification of an inlier is practically impossible. But in multivariate data, with relationships between variables, inliers can be identified. Here is some good reference material:
Multiple DR Reduced Features lists
Robot 1
Can I have multiple DR Reduced Features lists for one project?
Hi team, can I have multiple DR Reduced Features lists for one project? I would like to create the DR Reduced Features based on a feature list after Autopilot completes. But I don’t see DR Reduced Feature created when I retrain the model on a new feature list through “Configure Modeling Settings”.
Robot 2
You can have a new reduced feature list but only if there is a new most accurate model. We don't base the recommendation stages on the specific Autopilot run. You can take the new best model and, under the Deploy tab, prepare it for deployment. This will run through all of the stages, including a reduced feature list stage. Note that not all feature lists can be reduced, so this stage might be skipped.
Robot 3
Robot 1, you can manually make a reduced feature list from Feature Impact for any model:
- Run Feature Impact.
- Hit "Create feature list".
- Choose the number of features you want.
- Check “exclude redundant features” option (it only shows up if there are redundant features.
- Name the feature list.
- Click to create!
Defining redundant features
Robot 1
What makes a feature redundant?
The docs say:
If two features change predictions in a similar way, DataRobot recognizes them as correlated and identifies the feature with lower feature impact as redundant
How do we quantify or measure "similar way"?
Robot 2
If two features are highly correlated, the prediction difference (prediction before feature shuffle / prediction after feature shuffle) of the two features should also be correlated. The prediction difference can be used to evaluate pairwise feature correlation. For example, two highly correlated features are first selected. The feature with lower feature impact is identified as the redundant feature.
Robot 1
Do we consider two features redundant when their prediction differences is the same/between -x% and +x%?
Robot 2
We look at the correlation coefficient between the prediction differences and if it's above a certain threshold, we call the less important one (according to the models' feature impact) redundant.
Specifically:
-
Calculate prediction difference before and after feature shuffle:
(pred_diff[i] = pred_before[i] - pred_after[i]) -
Calculate pairwise feature correlation (top 50 features, according to model feature impact) based on
pred_diff. -
Identify redundant features (high correlation based on our threshold) then test that removal does not affect accuracy significantly.
What is target leakage?
Target leakage is like that scene in Mean Girls where the girl can predict when it's going to rain if it's already raining. That is, one of the features used to build your model is actually derived from the target, or closely related.
ELI5 example
You and a friend are trying to predict who’s going to win the Super Bowl (the Rams, or the Patriots).
You both start collecting information about past Super Bowls. Then your friend goes, “Hey wait! I know, we can just grab the newspaper headline from the day after the Super Bowl! Every past Super Bowl, you could just read the next day’s newspaper to know exactly who won.”
So you start collecting all newspapers from past Super Bowls, and become really good at predicting previous Super Bowl winners.
Then, you get to the upcoming Super Bowl and try to predict who’s going to win, however, something is wrong: “where is the newspaper that tells us who wins?”
You were using target leakage that helped you predict the past winners with high accuracy, but that method wasn't useful for predicting future behavior. The newspaper headline was an example of target leakage, because the target information was “leaking” into the past.
Interesting links:
Learn more about how DataRobot handles target leakage.
Intermittent target leakage
Robot 1
Why might target leakage show intermittently?
Hi team! A student in the DataRobot for Data Scientists class created a ModelID Categorical Int feature from the standard class “fastiron 100k data.csv.zip ” file and it flagged as Target Leakage on his first run under manual.
When he tried to do it again, the platform did not give the yellow triangle for target leakage but the Data Quality Assessment box did flag a target leakage feature.
His questions are:
-
Why is DataRobot showing the target leakage intermittently?
-
The original ModelID as a numeric int did not cause a target leakage flag and also when he included that Parent feature with the child feature (ModelID as categorical int) it did not flag as Target Leakage—why is that?
Robot 2
At a quick glance, it sounds like the user created a new feature ModelID (Categorical Int) via Var Type transform, and then kicked off manual mode in which the created feature received a calculated ACE importance scores. The importance scores passed our target leakage threshold and therefore Data Quality Assessment tagged the feature as potential leakage.
Robot 2
After looking at the project, I see that there was not a feature list called "Informative Features - Leakage Removed" created, meaning it didn't pass the "high-risk" leakage threshold value, and therefore was tagged as "moderate-risk" leakage feature.
I found the /eda/profile/ values from the Network Console for the project for the specific feature ModelId (Categorical Int). The calculated ACE importance score (Gini Norm metric) for that created feature is about 0.8501:
target_leakage_metadata: {importance: {impact: "moderate", reason: "importance score", value: 0.8501722785995578}}
And...yeah, the hard-coded moderate-risk threshold value in the code is in fact 0.85.
Robot 2
You can let the user know that changing a Numeric feature to Categorical var type can lead to potentially different univariate analysis results with regards to our Data page Importance score calculations. The Importance scores just narrowly passed our moderate-risk detected Target Leakage threshold value. Hope that helps.