Predict late shipments
This page outlines a use case to predict whether a shipment will be late or if there will be a shortage of parts in the shipment. This use case is captured in a notebook that you can download and execute locally.
Business problem
A critical component of any supply-chain network is to prevent parts shortages, especially when they occur at the last minute. Parts shortages not only lead to underutilized machines and transportation, but also cause a domino effect of late deliveries through the entire network. In addition, the discrepancies between the forecasted and actual number of parts that arrive on time prevent supply-chain managers from optimizing their materials plans.
Parts shortages are often caused by delays in their shipment. To mitigate the impact delays will have on their supply chain, manufacturers adopt approaches such as holding excess inventory, optimizing product designs for more standardization, and moving away from single-sourcing strategies. However, most of these approaches add up to unnecessary costs for parts, storage, and logistics.
In many cases, late shipments persist until supply-chain managers can evaluate root cause and then implement short term and long term adjustments that prevent them from occurring in the future. Unfortunately, supply-chain managers have been unable to efficiently analyze historical data available in MRP systems because of the time and resources required.
Intelligent solution
Many credit decisioning systems are driven by scorecards, which are very simplistic rule-based systems. These are built by end-user organizations through industry knowledge or simple statistical systems. Some organizations go a step further and obtain scorecards from third parties, which may not be customized for an individual organization’s book.
An AI-based approach can help financial institutions learn signals from their own book and assess risk at a more granular level. Once the risk is calculated, a strategy may be implemented to use this information for interventions. If you can predict someone is going to default, this may lead to intervention steps, such as sending earlier notices or rejecting loan applications.
Value estimation
How do you measure return on investment (ROI) for your use case?
The ROI for implementing this solution can be estimated by considering the following factors:
-
Starting with the manufacturing company and production line stoppage, the cycle time of the production process can be used to understand how much of the production loss relates to part shortages. For example, if the cycle time (time taken to complete one part) is 60 seconds and each day 15 minutes of production are lost to part shortages, then total production loss is equivalent to 15 products, which translates to a loss in profit of 15 products in a day. A similar calculation can be used to estimate annual loss due to part shortage.
-
For a logistics provider, predicting part shortages early can increase savings in terms of reduced inventory. This can be roughly measured by capturing the difference in maintaining parts' stock before and after implementation of the AI solution. The difference in stock when multiplied with holding and inventory cost per unit gives the overall ROI. Furthermore, in cases when the demand for parts is left unfulfilled (because of part shortages), the opportunity cost related to the unsatisfied demand would directly result in loss of respective business opportunity.
Tech implementation
About the data
For illustrative purposes, DataRobot uses a sample dataset provided by the President’s Emergency plan for AIDS relief (PEPFAR), which is publicly available on Kaggle. This dataset provides supply chain health commodity shipment and pricing data. Specifically, the dataset identifies Antiretroviral (ARV) and HIV lab shipments to supported countries. In addition, the dataset provides the commodity pricing and associated supply chain expenses necessary to move the commodities to other countries for use. DataRobot uses this dataset to represent how a manufacturing or logistics company can leverage AI models to improve their decision-making.
Problem framing
The target variable for this use case is whether or not the shipment will be delayed (Binary; True or False, 1 or 0, etc.). The target (Late_delivery) makes this use case a binary classification problem. The distribution of the target variable is imbalanced, with 11.4% being 1 (late delivery) and 88.6% being 0 (on time delivery). See here for more information about imbalanced data in machine learning.
Sample feature list
| Feature Name | Data Type | Description | Data Source | Example |
|---|---|---|---|---|
| Supplier name | Categorical | Name of the vendor who is shipping the delivery. | Purchase order | Ranbaxy, Sun Pharma, etc. |
| Part description | Text | The details of the part or item that is being shipped. | Purchase order | 30mg HIV test kit, 600mg Lamivudine capsules |
| Order quantity | Numeric | The amount of item that was ordered. | Purchase order | 1000, 300, etc. |
| Line item value | Numeric | The unit price of the line item ordered. | Purchase order | 0.39, 1.33 |
| Scheduled delivery date | Date | The date at which the order is scheduled to be delivered. | Purchase order | 2-Jun-06 |
| Delivery recorded date | Date | The date at which the order was eventually delivered. | ERP system | 2-Dec-06 |
| Manufacturing site | Categorical | The site of the vendor where the manufacturing was done since the same vendor can ship parts from different sites. | Invoice | Sun Pharma, India |
| Product Group | Categorical | The category of the product that is ordered. | Purchase order | HRDT, ARV |
| Mode of delivery | Categorical | The mode of transport for part delivery. | Invoice | Air, Truck |
| Late Delivery | Target (Binary) | Whether the delivery was late or on-time. | ERP System, Purchase Order | 0 or 1 |
Data preparation
The dataset contains historical information on procurement transactions. Each row of analysis in the dataset is an individual order that is placed and whose delivery needs to be predicted. Every order has a scheduled delivery date and actual delivery date, and the difference between these were used to define the target variable (Late_delivery). If the delivery date surpassed the scheduled date, then the target variable had a value 1, else 0. Overall, the dataset contains about 10,320 rows and 26 features, including the target variable.
Model training
DataRobot Automated Machine Learning (AutoML) automates many parts of the modeling pipeline. Instead of hand-coding and manually testing dozens of models to find the one that best fits your needs, DataRobot automatically runs dozens of models and finds the most accurate one for you, all in a matter of minutes. In addition to training the models, DataRobot automates other steps in the modeling process, such as processing and partitioning the dataset.
Although this walkthrough jumps straight to interpreting the model results, you can take a look here to see how DataRobot works from start to finish, and to understand the data science methodologies embedded in its automation.
Something to highlight is, since you are dealing with an imbalanced dataset, DataRobot automatically recommends using LogLoss as the optimization metric to identify the most accurate model, being that it is an error metric that penalizes wrong predictions.
For this dataset, DataRobot found the most accurate model to be Extreme Gradient Boosting Tree Classifier with unsupervised learning features using the open source XGBoost library.
Interpret results
Feature Impact
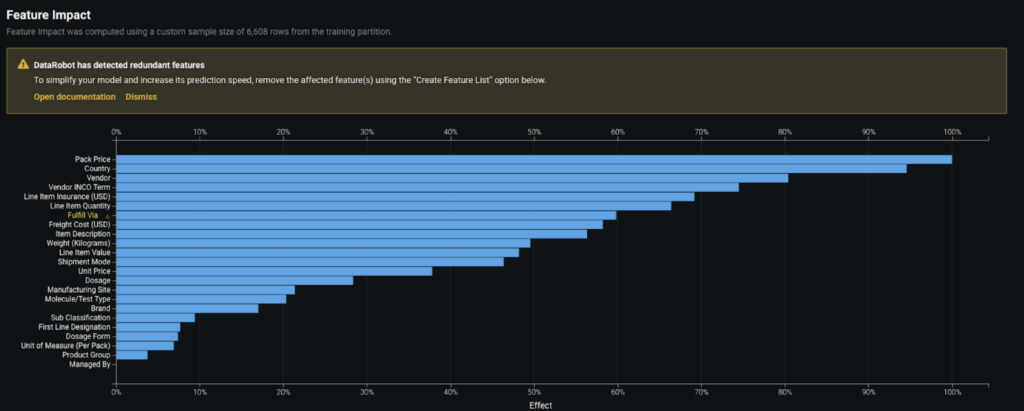
To give transparency on how the model works, DataRobot provides both global and local levels of model explanations. In broad terms, the model can be understood by looking at the Feature Impact graph, which reveals the association between each feature and the model target. The technique adopted by DataRobot to build this plot is called Permutation Importance.
As you can see, the model identified Pack Price, Country, Vendor, Vendor INCO Term, and Line item Insurance as some of the most critical factors affecting delays in the parts shipments.
Prediction Explanations
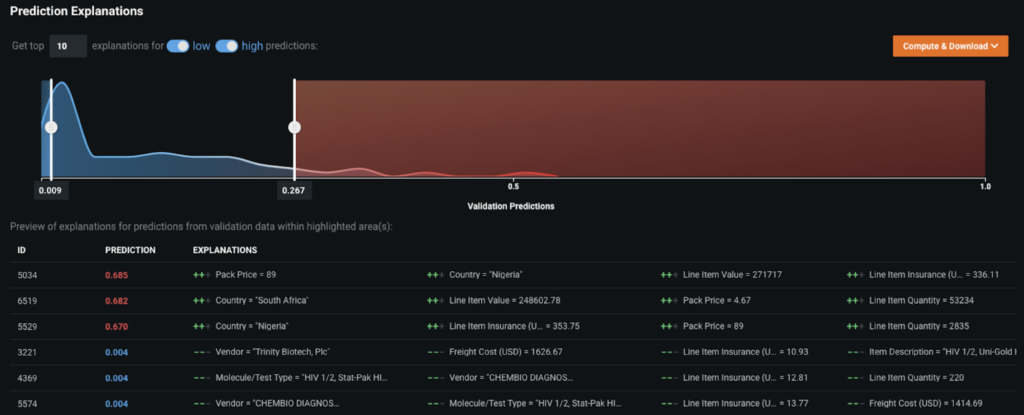
Moving to the local view of explainability, DataRobot also provides Prediction Explanations that enable you to understand the top 10 key drivers for each prediction generated. This offers you the granularity you need to tailor your actions to the unique characteristics behind each part shortage.
For example, if a particular country is a top reason for a shipment delay, such as Nigeria or South Africa, you can take actions by reaching out to vendors in these countries and closely monitoring the shipment delivery across these routes.
Similarly, if there are certain vendors that are amongst the top reasons for delays, you can reach out to these vendors upfront and take corrective actions to avoid any delayed shipments that would affect the supply-chain network. These insights help businesses make data-driven decisions to improve the supply chain process by incorporating new rules or alternative procurement sources.
Word Cloud
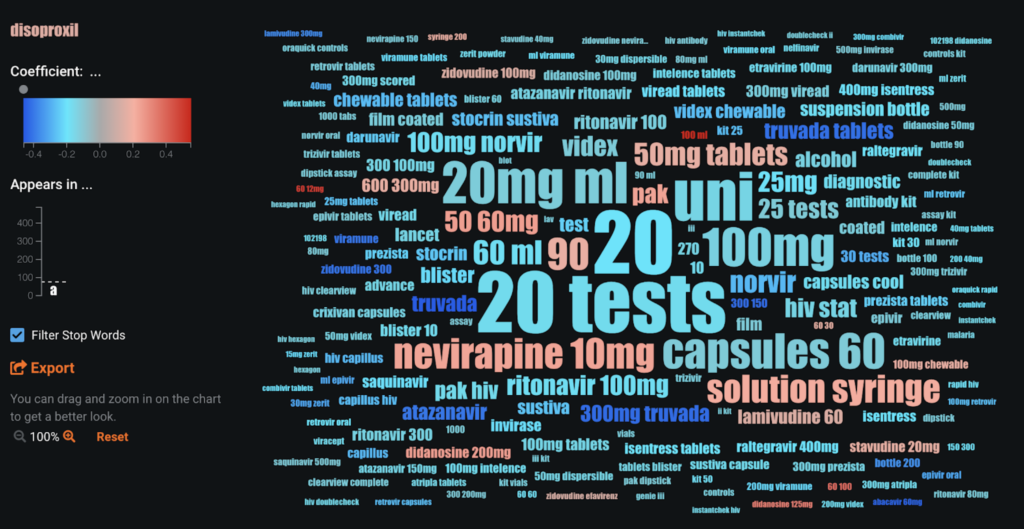
For text variables, such as Part description (included in the dataset), you can look at Word Clouds to discover the words or phrases that are highly associated with delayed shipments. Text features are generally the most challenging and time-consuming to build models for, but with DataRobot, each individual text column is automatically fitted as an individual classifier and is directly preprocessed with NLP techniques (tf-idf, n grams, etc.) In this case, you can see that the items described as nevirapine 10 mg are more likely to get delayed in comparison to other items.
Evaluate accuracy
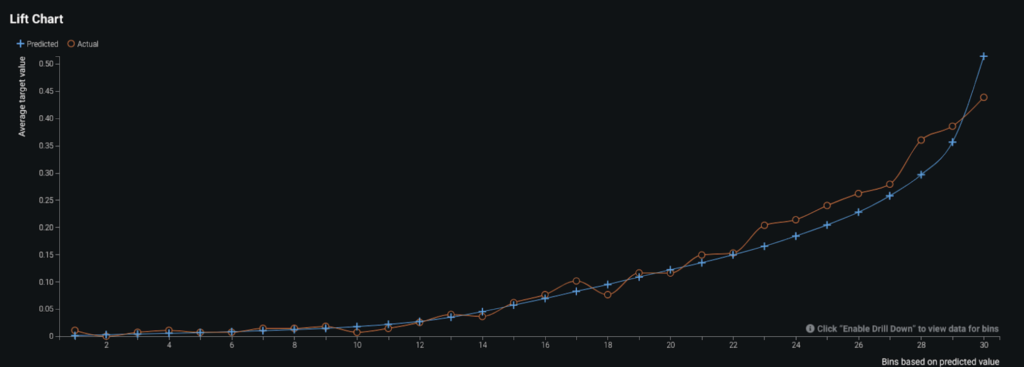
To evaluate the performance of the model, DataRobot by default ran five-fold cross validation and the resulting AUC score (for ROC Curve) was around 0.82. Since the AUC score on the holdout set (unseen data) was also around 0.82, you can be reassured that the model is generalizing well and is not overfitting. The reason you look at the AUC score for evaluating the model is because AUC ranks the output (i.e., the probability of delayed shipment) instead of looking at actual values. The Lift Chart below shows how the predicted values (blue line) compared to actual values (red line) when the data is sorted by predicted values. The model has slight under-predictions for the orders that are more likely to get delayed. But overall, the model performs well. Furthermore, depending on the problem being solved, you can review the confusion matrix for the selected model and, if required, adjust the prediction threshold to optimize for precision and recall.
Business implementation
Decision environment
After finding the right model that best learns patterns in your data, DataRobot makes it easy to deploy the model into your desired decision environment. Decision environments are the ways in which the predictions generated by the model will be consumed by the appropriate stakeholders in your organization, and how these stakeholders will make decisions using the predictions to impact the overall process.
Decision maturity
Automation | Augmentation | Blend
The predictions from this use case can augment the decisions of the supply chain managers as they foresee any upcoming delays in logistics. It acts as an intelligent machine that, when combined with the decisions of the managers, help improve your entire supply-chain network.
Model deployment
The model can be deployed using the DataRobot Prediction API. A REST API endpoint is used to bounce back predictions in near real-time when new scoring data from new orders are received.
Once the model has been deployed (in whatever way the organization decides), the predictions can be consumed in several ways. For example, a front-end application that acts as the supply chain’s reporting tool can be used to deliver new scoring data as an input to the model, which then bounces back predictions and Prediction Explanations in real-time.
Decision stakeholders
The predictions and Prediction Explanations can be used by supply chain managers or logistic analysts to help them understand the critical factors or bottlenecks in the supply chain.
Decision Executors
Decision executors are the supply-chain managers and procurement teams who are empowered with the information they need to ensure that the supply-chain network is free from bottlenecks. These personnel have strong relationships with vendors and the ability to take corrective action using the model’s predictions.
Decision Managers
Decision managers are the executive stakeholders, such as the Head of Vendor Development, who manage large scale partnerships with key vendors. Based on the overall results, these stakeholders can perform quarterly reviews of the health of their vendor relationships to make strategic decisions on long-term investments and business partnerships.
Decision Authors
Decision authors are the business analysts or data scientists who would build this decision environment. These analysts could be the engineers/analysts from the supply chain, engineering, or vendor development teams in the organization who usually work in collaboration with the supply-chain managers and their teams.
Decision process
The decisions that the managers and executive stakeholders take based on the predictions and Prediction Explanations for identifying potential bottlenecks include reaching out and collaborating with appropriate vendor teams in the supply-chain network based on data-driven insights. The decisions could be both long- and short-term based on the severity of the impact of shortages on the business.
Model monitoring
One of the most critical components in implementing AI is having the ability to track the performance of the model for data drift and accuracy. With DataRobot MLOps, you can deploy, monitor, and manage all models across the organization through a centralized platform. Tracking model health is very important for proper model lifecycle management, similar to product lifecycle management.
Implementation risks
One of the major risks in implementing this solution in the real world is adoption at the ground level. Having strong and transparent relationships with vendors is also critical in taking corrective action. The risk is that vendors may not be ready to adopt a data-driven strategy and trust the model results.
Demo
See the notebook here.