Reduce 30-Day readmissions rate
This page outlines a use case to reduce the 30-day readmission rate at a hospital. This use case is captured in a Jupyter notebook that you can download and execute.
Business problem
A "readmission" event is when a patient is readmitted into the hospital within 30 days of being discharged. Readmissions are not only a reflection of uncoordinated healthcare systems that fail to sufficiently understand patients and their conditions, but they are also a tremendous financial strain on both healthcare providers and payers. In 2011, the United States Government estimated there were approximately 3.3 million cases of 30-day, all-cause hospital readmissions, incurring healthcare organizations a total cost of $41.3 billion. The foremost challenge in mitigating readmissions is accurately anticipating patient risk from the point of initial admission up until discharge. Although a readmission is caused by a multitude of factors, including a patient’s medical history, admission diagnosis, and social determinants, the existing methods (i.e., LACE and HOSPITAL scores) used to assess a patient’s likelihood of readmission do not effectively consider the variety of factors involved. By only including limited considerations, these methods result in suboptimal health evaluations and outcomes.
Solution value
AI provides clinicians and care managers with the information they need to nurture strong, lasting connections with their patients. It helps reduce readmission rates by predicting which patients are at risk and allowing clinicians to prescribe intervention strategies before, and after, the patient is discharged. AI models can ingest significant amounts of data and learn complex patterns behind why certain patients are likely to be readmitted. Model interpretability features offer personalized explanations for predictions, giving clinicians insight into the top risk drivers for each patient at any given time. By taking the form of an artificial clinician and augmenting the care they provide, along with other actions clinicians already take, AI enables them to conduct intelligent interventions to improve patient health. Using the information they learn, clinicians can decrease the likelihood of patient readmission by carefully walking through their discharge paperwork in-person, scheduling additional outpatient appointments (to give them more confidence about their health), and providing additional interventions that help reduce readmissions.
Problem framing
One way to frame the problem is to determine how to measure ROI for the use case. Consider:
Current cost of readmissions:
Current readmissions annual rate x Annual hospital inpatient discharge volumes x Average cost of a hospital readmission
New cost of readmissions:
New readmissions annual rate x Annual hospital inpatient discharge volumes x Average cost of a hospital readmission
ROI:
New cost of readmissions - Current cost of readmissions
As a result, the top-down calculation for value estimates is:
ROI:
Current costs of readmissions x improvement in readmissions rate
For example, at a US national level, calculating the top-down cost of readmissions for each healthcare provider is $41.3 billion / 6,210 US providers = ~$6.7 million
For illustrative purposes, this tutorial uses a sample dataset provided by a medical journal that studied readmissions across 70,000 inpatients with diabetes. The researchers of the study collected this data from the Health Facts database provided by Cerner Corporation, which is a collection of clinical records across providers in the United States. Health Facts allows organizations that use Cerner’s electronic health system to voluntarily make their data available for research purposes. All the data was cleansed of PII in compliance with HIPAA.
Features and sample data
The features for this use case represent key factors for predicting readmissions. They encompass each patient’s background, diagnosis, and medical history, which will help DataRobot find relevant patterns across the patient’s medical profile to assess their re-hospitalization risk. In addition to the features listed below, incorporate any additional data that your organization collects that might be relevant to readmission.(DataRobot is able to differentiate important/unimportant features if your selection would not improve modeling.) Relevant features are generally stored across proprietary data sources available in your EMR system (for example, Epic or Cerner) and include:
- Patient data
- Diagnosis data
- Admissions data
- Prescription data
Other external data sources may also supply relevant data such as:
- Seasonal data
- Demographic data,
- Social determinants data
Each record in the data represents a unique patient visit.
Target
The target variable:
Readmitted
This feature represents whether or not a patient was readmitted to the hospital within 30 days of discharge, using values such as True \ False, 1 \ 0, etc. This choice in target makes this a binary classification problem.
Sample feature list
| Feature Name | Data Type | Description | Data Source | Example |
|---|---|---|---|---|
| Readmitted | Binary (Target) | Whether or not the patient readmitted after 30 days | Admissions Data | False |
| Age | Numeric | Patient age group | Patient Data | Female |
| Weight | Categorical | Patient weight group | Patient Data | 50-75 |
| Gender | Categorical | Patient gender | Patient Data | 50-60 |
| Race | Categorical | Patient race | Patient Data | Caucasian |
| Admissions Type | Categorical | Patient state during admission (Elective, Urgent, Emergency, etc.) | Admissions Data | Elective |
| Discharge Disposition | Categorical | Patient discharge condition (Home, home with health services, etc.) | Admissions Data | Discharged to home |
| Admission Source | Categorical | Patient source of admissions (Physician Referral, Emergency Room, Transfer, etc.) | Admissions Data | Physician Referral |
| Days in Hospital | Numeric | Length of stay in hospital | Admissions Data | 1 |
| Payer Code | Categorical | Unique code of patient’s payer | Admissions Data | CP |
| Medical Specialty | Categorical | Medical specialty that patient is being admitted into | Admissions Data | Surgery-Neuro |
| Lab Procedures | Numeric | Total lab procedures in the past | Admissions Data | 35 |
| Procedures | Numeric | Total procedures in the past | Admissions Data | 4 |
| Outpatient Visits | Numeric | Total outpatient visits in the past | Admissions Data | 0 |
| ER Visits | Numeric | Total emergency room visits in the past | Admissions Data | 0 |
| Inpatient Visits | Numeric | Total inpatient visits in the past | Admissions Data | 0 |
| Diagnosis | Numeric | Total diagnosis | Diagnosis Data | 9 |
| ICD10 Diagnosis Code(s) | Categorical | Patient’s ICD10 diagnosis on their condition; could be more than one (additional columns) | Diagnosis Data | M4802 |
| ICD10 Diagnosis Description(s) | Categorical | Description on patient’s diagnosis; could be more than one (additional columns) | Diagnosis Data | Spinal stenosis, cervical region |
| Medications | Numeric | Total number of medications prescribed to the patient | Prescription Data | 21 |
| Prescribed Medication(s) | Binary | Whether or not the patient is prescribed to a medication; could be more than one (additional columns) | Prescription Data | Metformin – No |
Data preparation
The original raw data consisted of 74 million unique visits that include 18 million unique patients across 3 million providers. This data originally contained both inpatient and outpatient visits, as it included medical records from both integrated health systems and standalone providers. While the original data schema consisted of 41 tables with 117 features, the final dataset was filtered on relevant patients and features based on the use case. The patients included were limited to those with:
- Inpatient encounters
- Existing diabetic conditions
- 1–14 days of inpatient stay
- Lab tests performed during inpatient stay (or not)
- Medications were prescribed during inpatient stay (or not)
All other features were excluded due to lack of relevance and/or poor data integrity. Reference the DataRobot documentation to see details on how to connect DataRobot to your data source, perform feature engineering, follow best-practice data science techniques, and more.
Modeling and insights
DataRobot automates many parts of the modeling pipeline, including processing and partitioning the dataset, as described here. This use case skips the modeling section and moves straight to model interpretation. Reference the DataRobot documentation to see how to use DataRobot from start to finish and how to understand the data science methodologies embedded in its automation. This use case creates one unified model that predicts the likelihood of readmission for patients with diabetic conditions.
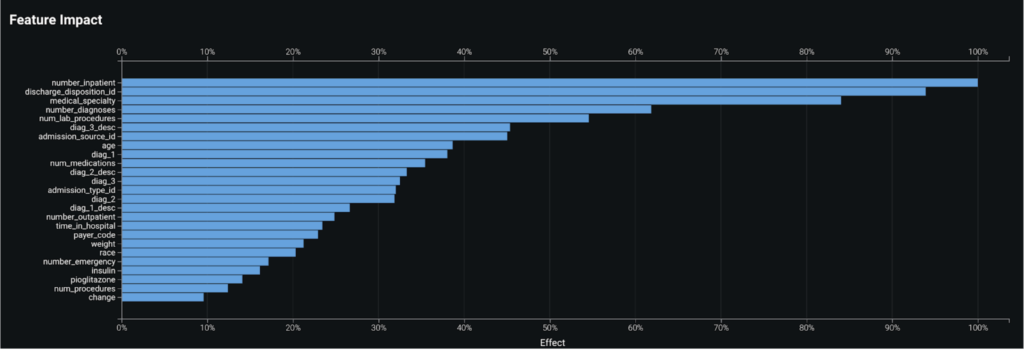
Feature Impact
By taking a look at the Feature Impact chart, you can see that a patient’s number of past inpatient visits, discharge disposition, and the medical specialty of their diagnosis are the top three most impactful features that contribute to whether a patient will readmit.
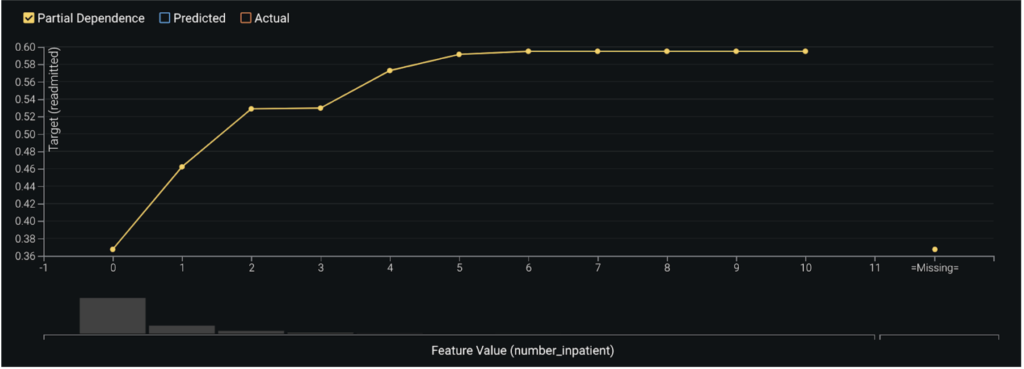
Feature Effects/Partial Dependence
In assessing the partial dependence plots to further evaluate the marginal impact top features have on the predicted outcome, you can see that as a patient’s number of past inpatient visits increases from 0 to 2, their likelihood to readmit subsequently jumps from 37% to 53%. As the number of visits exceeds 4 the likelihood increases to roughly 59%.
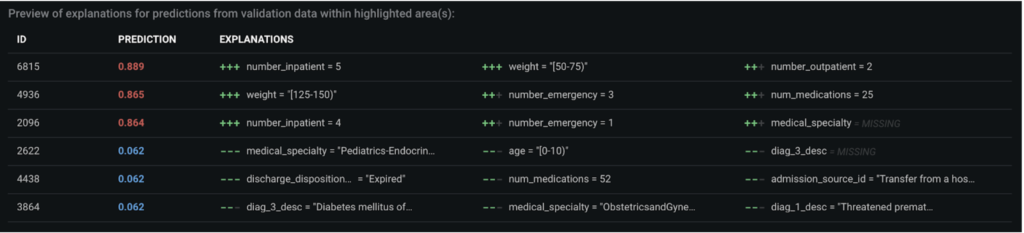
Prediction Explanations
DataRobot’s Prediction Explanations provide a more granular view for interpreting model results—key drivers for each prediction generated. These explanations show why a given patient was predicted to readmit or not, based on the top predictive features.
Post-processing
For the prediction results to be intuitive for clinicians to consume, instead of displaying them as a probabilistic or binary number, they can can be post-processed into different labels based on where they fall under predefined prediction thresholds. For instance, patients can be labeled as high risk, medium risk, and low risk depending on their risk of readmissions.
Predict and deploy
After selecting the model that best learns patterns in your data to predict readmissions, you can deploy it into your desired decision environment. Decision environments are the ways in which the predictions generated by the model will be consumed by the appropriate organizational stakeholders, and how these stakeholders will make decisions using the predictions to impact the overall process. This is a critical piece of implementing the use case as it ensures that predictions are used in the real-world for reducing hospital readmissions and generating clinical improvements. At its core, DataRobot empowers clinicians and care managers with the information they need to nurture strong and lasting connections with the people they care about most: their patients. While there are use cases where decisions can be automated in a data pipeline, a readmissions model is geared to augment the decisions of your clinicians. It acts as an intelligent machine that, combined with the expertise of your clinicians, will help improve patients’ medical outcomes.
Decision stakeholders
The following table lists potential decision stakeholders:
| Stakeholder | Description | Examples |
|---|---|---|
| Decision executors | Clinical stakeholders who will consume decisions on a daily basis to identify patients who are likely to readmit and understand the steps they can take to intervene. | Nurses, physicians, care managers |
| Decision managers | Executive stakeholders who will monitor and manage the program to analyze the performance of the provider’s readmission improvement programs. | Chief medical officer, chief nursing officer, chief population health officer |
| Decision authors | Technical stakeholders who will set up the decision flow in place. | Clinical operations analyst, business intelligence analyst, data scientists |
Decision process
You can set thresholds to determine whether a prediction constitutes a foreseen readmission or not. Assign clear action items for each level of threshold so that clinicians can prescribe the necessary intervention strategies.
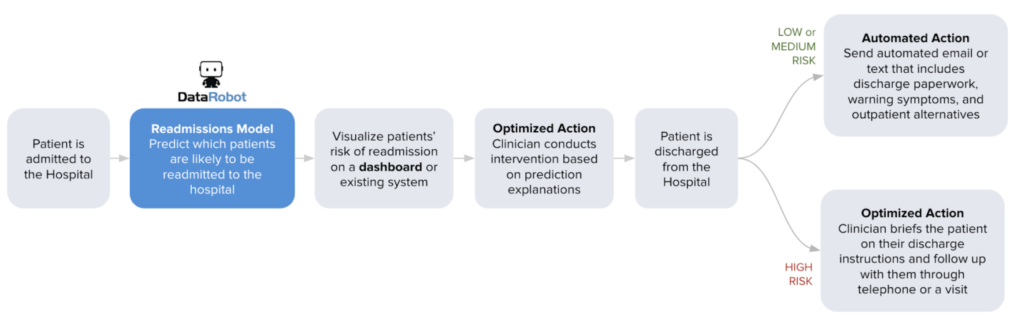
Low risk: Send an automated email or text that includes discharge paperwork, warning symptoms, and outpatient alternatives. Medium risk: Send multiple automated emails or texts that include discharge paperwork, warning symptoms, and outpatient alternatives, with multiple reminders. Follow up with the patient 10 days post-discharge through email to gauge their condition. High risk: Clinician briefs patient on their discharge paperwork in person. Send automated emails or texts that include discharge paperwork, warning symptoms, and outpatient alternatives, with multiple reminders. Follow up with the patient on a weekly basis post discharge through telephone or email to gauge their condition.
Model deployment
DataRobot provides clinicians with complete transparency on the top risk-drivers for every patient at any given time, enabling them to conduct intelligent interventions both before and after the patient is discharged. Reference the DataRobot documentation for an overview of model deployment.
No-Code AI Apps
Consider building a custom application where stakeholders can interact with the predictions and record the outcomes of the investigation. Once the model is deployed, predictions can be consumed for use in the decision process. For example, this No-Code AI App is an easily shareable, AI-powered application using a no-code interface:
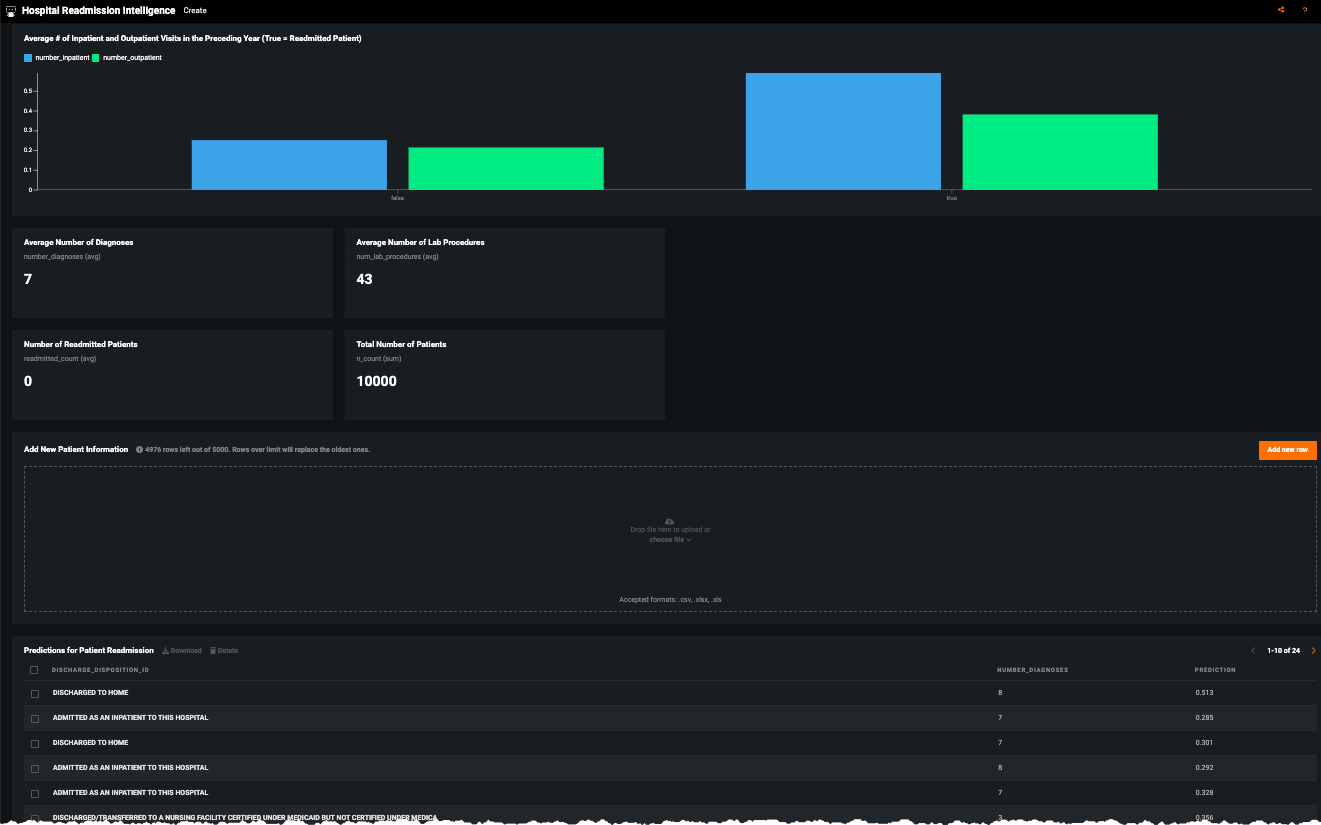
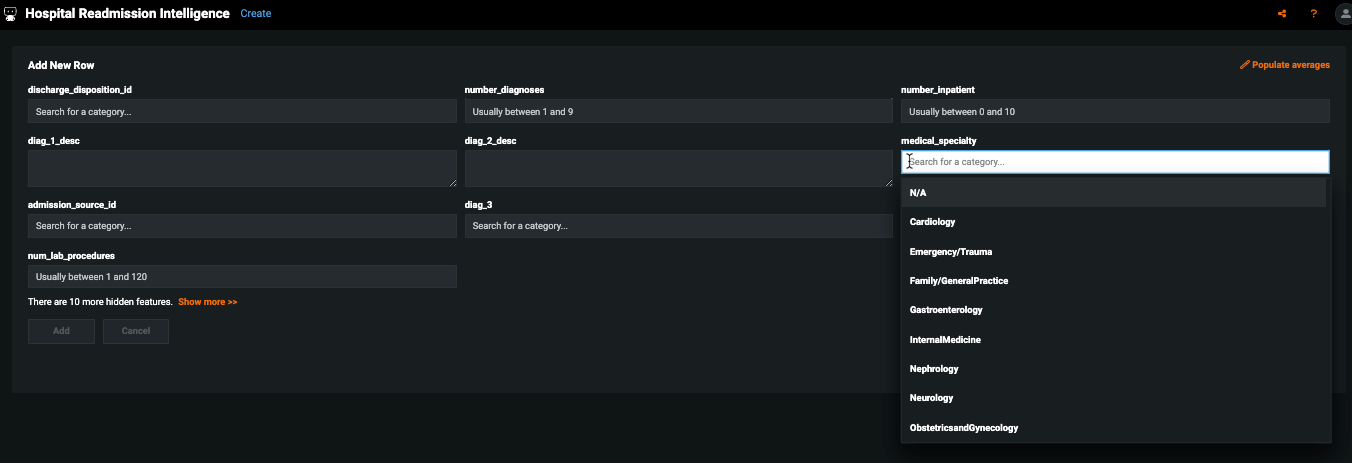
Click Add new row to enter patient data:
Other business systems
Predictions can also be integrated into other systems that are embedded in the provider’s day-to-day business workflow. Results can be integrated into the provider’s EMR system or BI dashboards. For the former, clinicians can easily see predictions as an additional column in the data they already view on a daily basis to monitor their assigned patients. They will be given transparent interpretability of the predictions to understand why the model predicts the patient to readmit or not.
Some common integrations:
- Display results through an Electronic Medical Record system (i.e., Epic)
- Display results through a business intelligence tool (i.e., Tableau, Power BI)
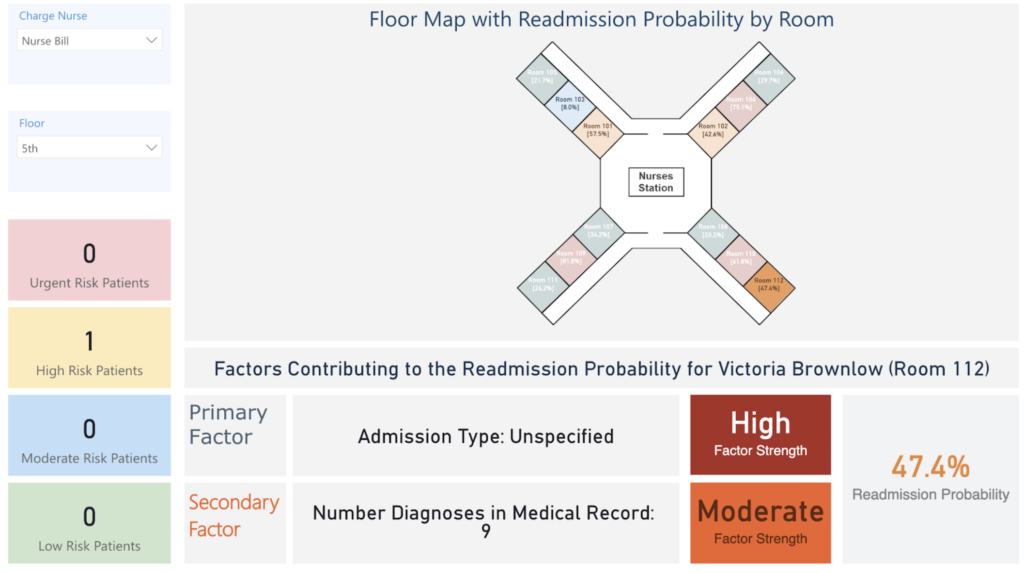
The following shows an example of how to integrate predictions with Microsoft Power BI to create a dashboard that can be accessed by clinicians to support decisions on which patients they should address to prevent readmissions. The dashboard below displays the probability of readmission for each patient on the floor. It shows the patient’s likelihood to readmit and top factors on why the model made the prediction. Nurses and physicians can consume a dashboard similar to this one to understand which patients are likely to readmit and why, allowing them to implement a prevention strategy tailored to each patient’s unique needs.
Model monitoring
Common decision operators—IT, system operations, and data scientists—would likely implement this use case as follows: Prediction Cadence: Batch predictions generated on a daily basis. Model Retraining Cadence: Models retrained once data drift reaches an assigned threshold; otherwise, retrain the models at the beginning of every new operating quarter. Use DataRobot's performance monitoring capabilities—especially service health, data drift, and accuracy to produce and distribute regular reports to stakeholders.
Implementation considerations
The following highlights some potential implementation risks, all of which are addressable once acknowledged:
| Issue | Description |
|---|---|
| Access | Failure to make prediction results easy and convenient for clinicians to access (i.e., if they have to open a separate web browser to the EHR that they are already used to or have information overload). |
| Understandability | Failure to make predictions intuitive for clinicians to understand. |
| Interpretability | Failure to help clinicians interpret the predictions and why the model thought a certain way. |
| Prescriptive | Failure to provide clinicians with prescriptive strategies to act on high risk cases. |
Trusted AI
In addition to traditional risk analysis, the following elements of AI Trust may require attention in this use case. Target leakage: Target leakage describes information that should not be available at the time of prediction being used to train the model. That is, particular features make leak information about the eventual outcome that will artificially inflate the performance of the model in training. This use case required the aggregation of data across 41 different tables and a wide timeframe, making it vulnerable to potential target leakage. In the design of this model and the preparation of data, it is pivotal to identify the point of prediction (discharge from the hospital) and ensure no data be included past that time. DataRobot additionally supports robust target leakage detection in the second round of exploratory data analysis and the selection of the Informative Features feature list during Autopilot. Bias & Fairness: This use case leverages features that may be categorized as protected or may be sensitive (age, gender, race). It may be advisable to assess the equivalency of the error rates across these protected groups. For example, compare if patients of different races have equivalent false negative and positive rates. The risk is if the system predicts with less accuracy for a certain protected group, failing to identify those patients as at risk of readmission. Mitigation techniques may be explored at various stages of the modeling process, if it is determined necessary. DataRobot's bias and fairness resources help identify bias before (or after) models are deployed.
Demo
See the notebook version of this accelerator here.