Data and modeling (V11.0)
April 14, 2025
The DataRobot V11.0.0 release includes many new data, modeling, and admin feature enhancements, described below. See additional details of Release 11.0:
Release v11.0 provides updated UI string translations for the following languages:
- Japanese
- French
- Spanish
- Korean
- Brazilian Portuguese
Features grouped by capability
*Premium
Data
Create SQL recipes in Workbench
Use the SQL Editor in Workbench to create recipes comprised of SQL queries that enrich, transform, shape, and blend datasets together to create a new output dataset. To open the SQL Editor, in the Data assets tile of your Use Case, open the actions menu next to a dataset and select Open in SQL Editor. To enrich your primary dataset, you can add data inputs from the same data engine as the original dataset, and once you've added data inputs, you can begin adding SQL queries to the editor. When the query is complete, click Run to preview the results.
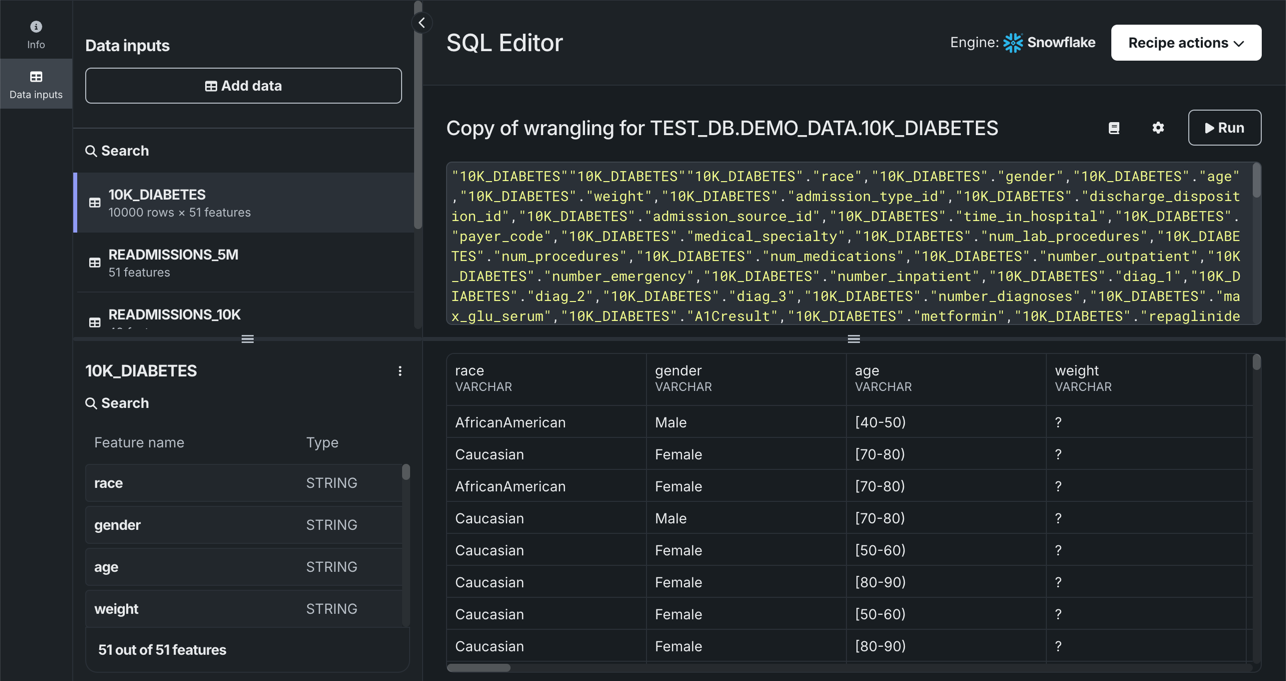
Supported data engines
The SQL Editor currently supports Snowflake, BigQuery, and Databricks, as well as preview support for the Spark engine.
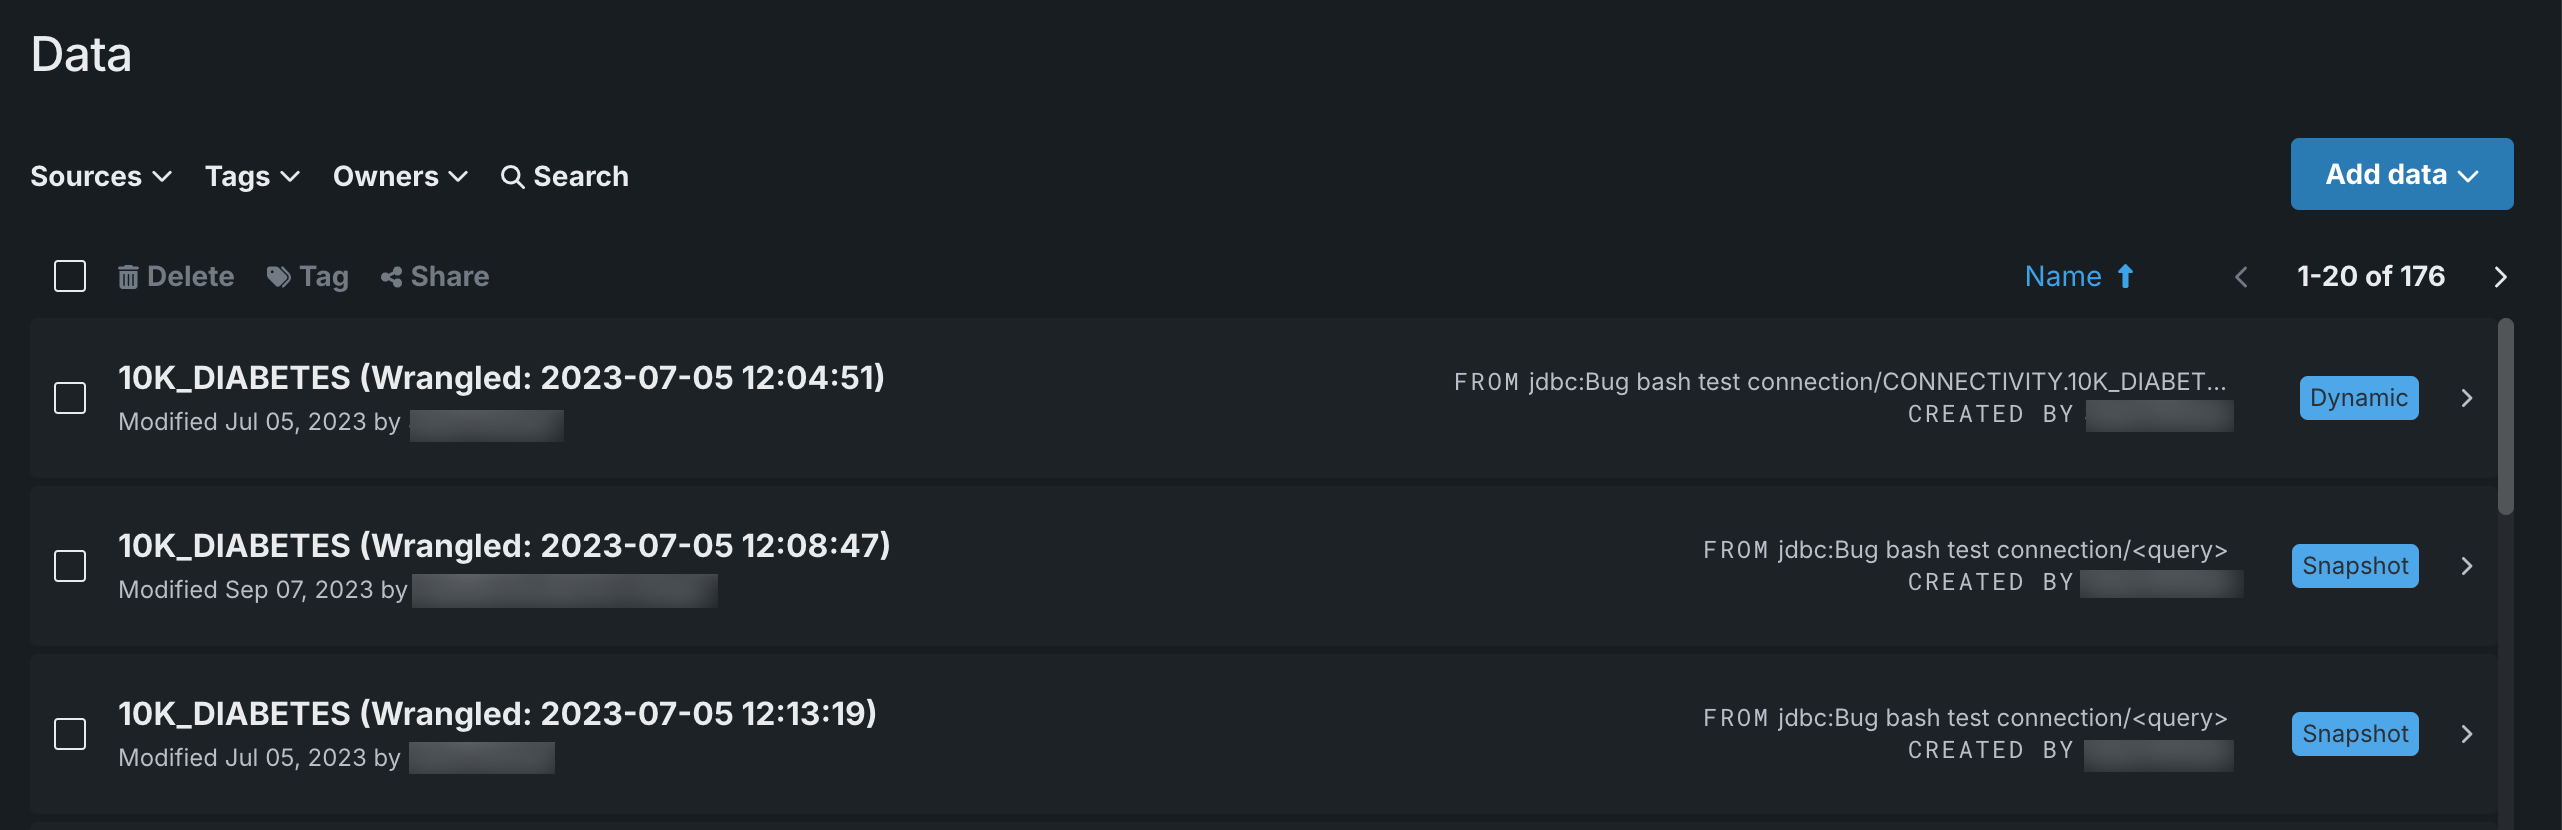
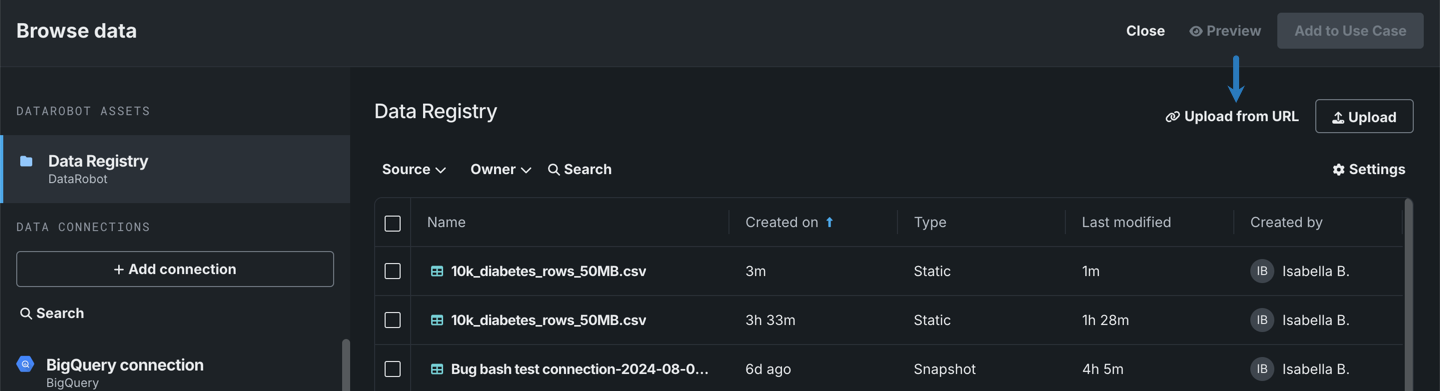
Manage NextGen data assets in Registry
The Data page in Registry is a centralized hub for managing datasets in NextGen, allowing you to easily find, share, explore, and reuse data. Any dataset that you've added directly to the Data Registry, you've linked to a Use Case, has been shared with you, or someone has added to a Use Case you are a member of, is displayed here. The Data Registry provides easy access to the data needed to address a business problem while ensuring security, compliance, and consistency.
To access the Data Registry, in NextGen, open Registry and click Data. From here, you can view, share, and delete data.
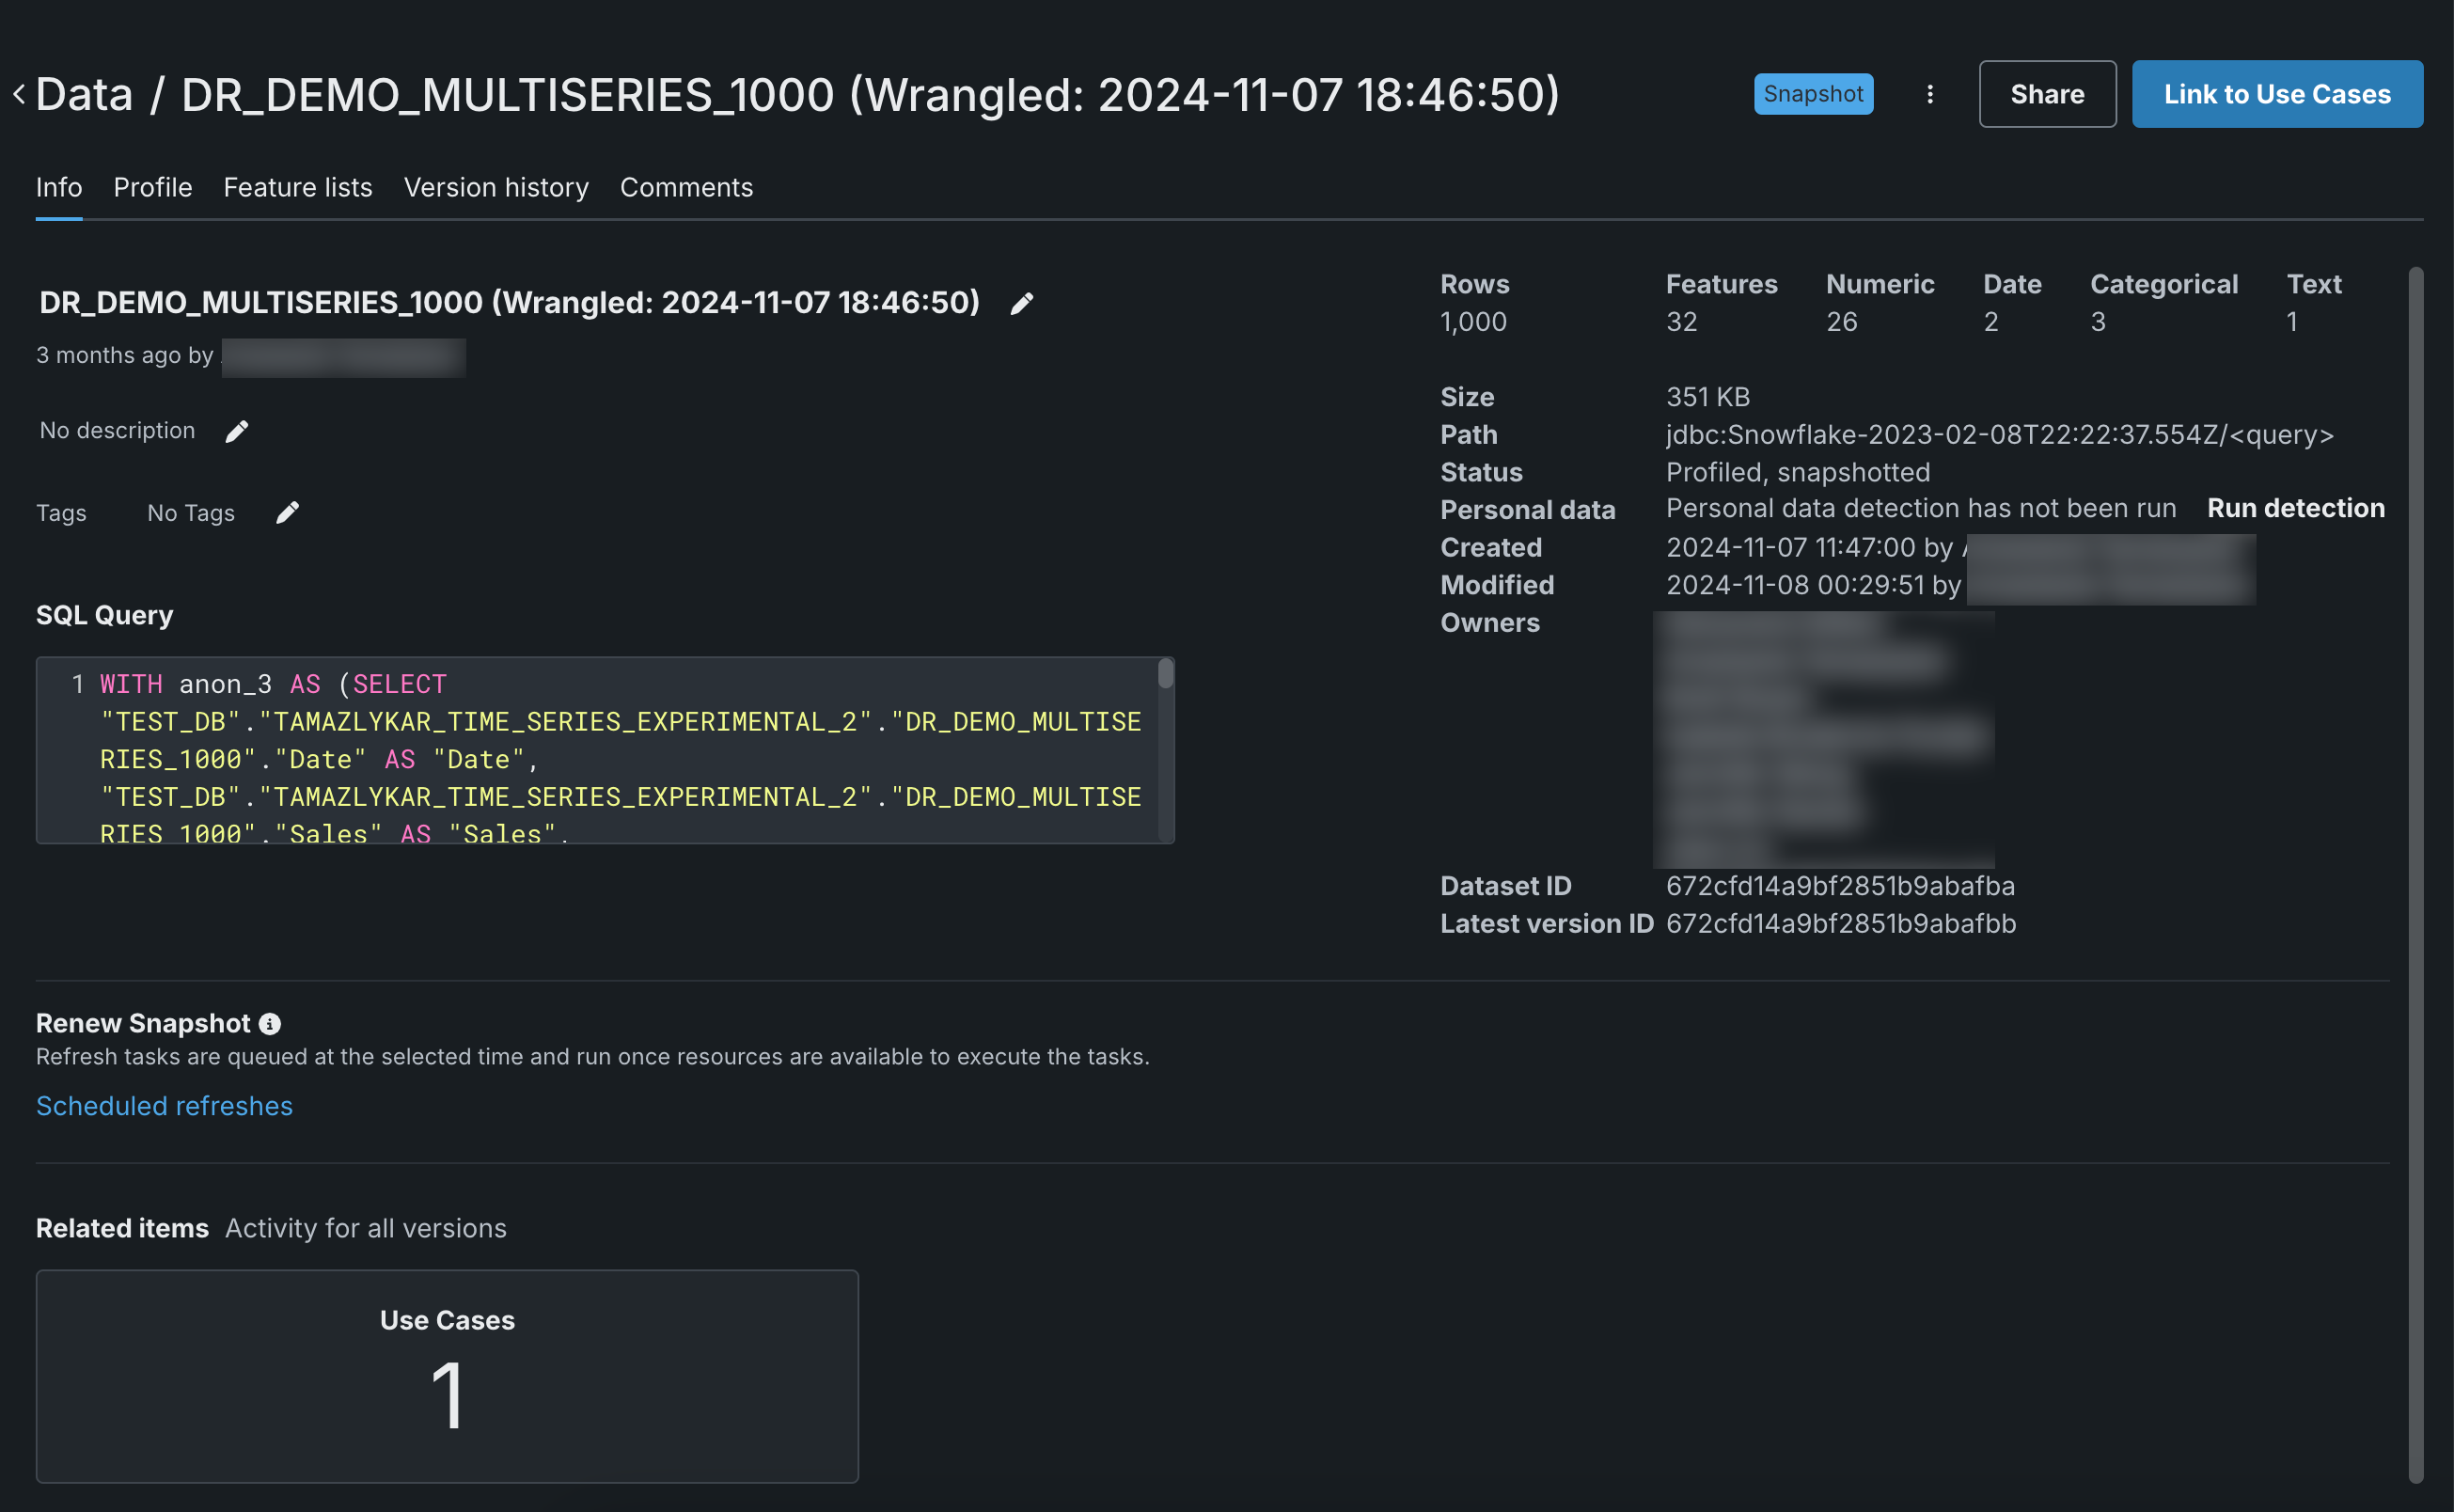
Then, click on an individual dataset to explore a dataset preview, metadata, and insights, as well as version history and related activity.
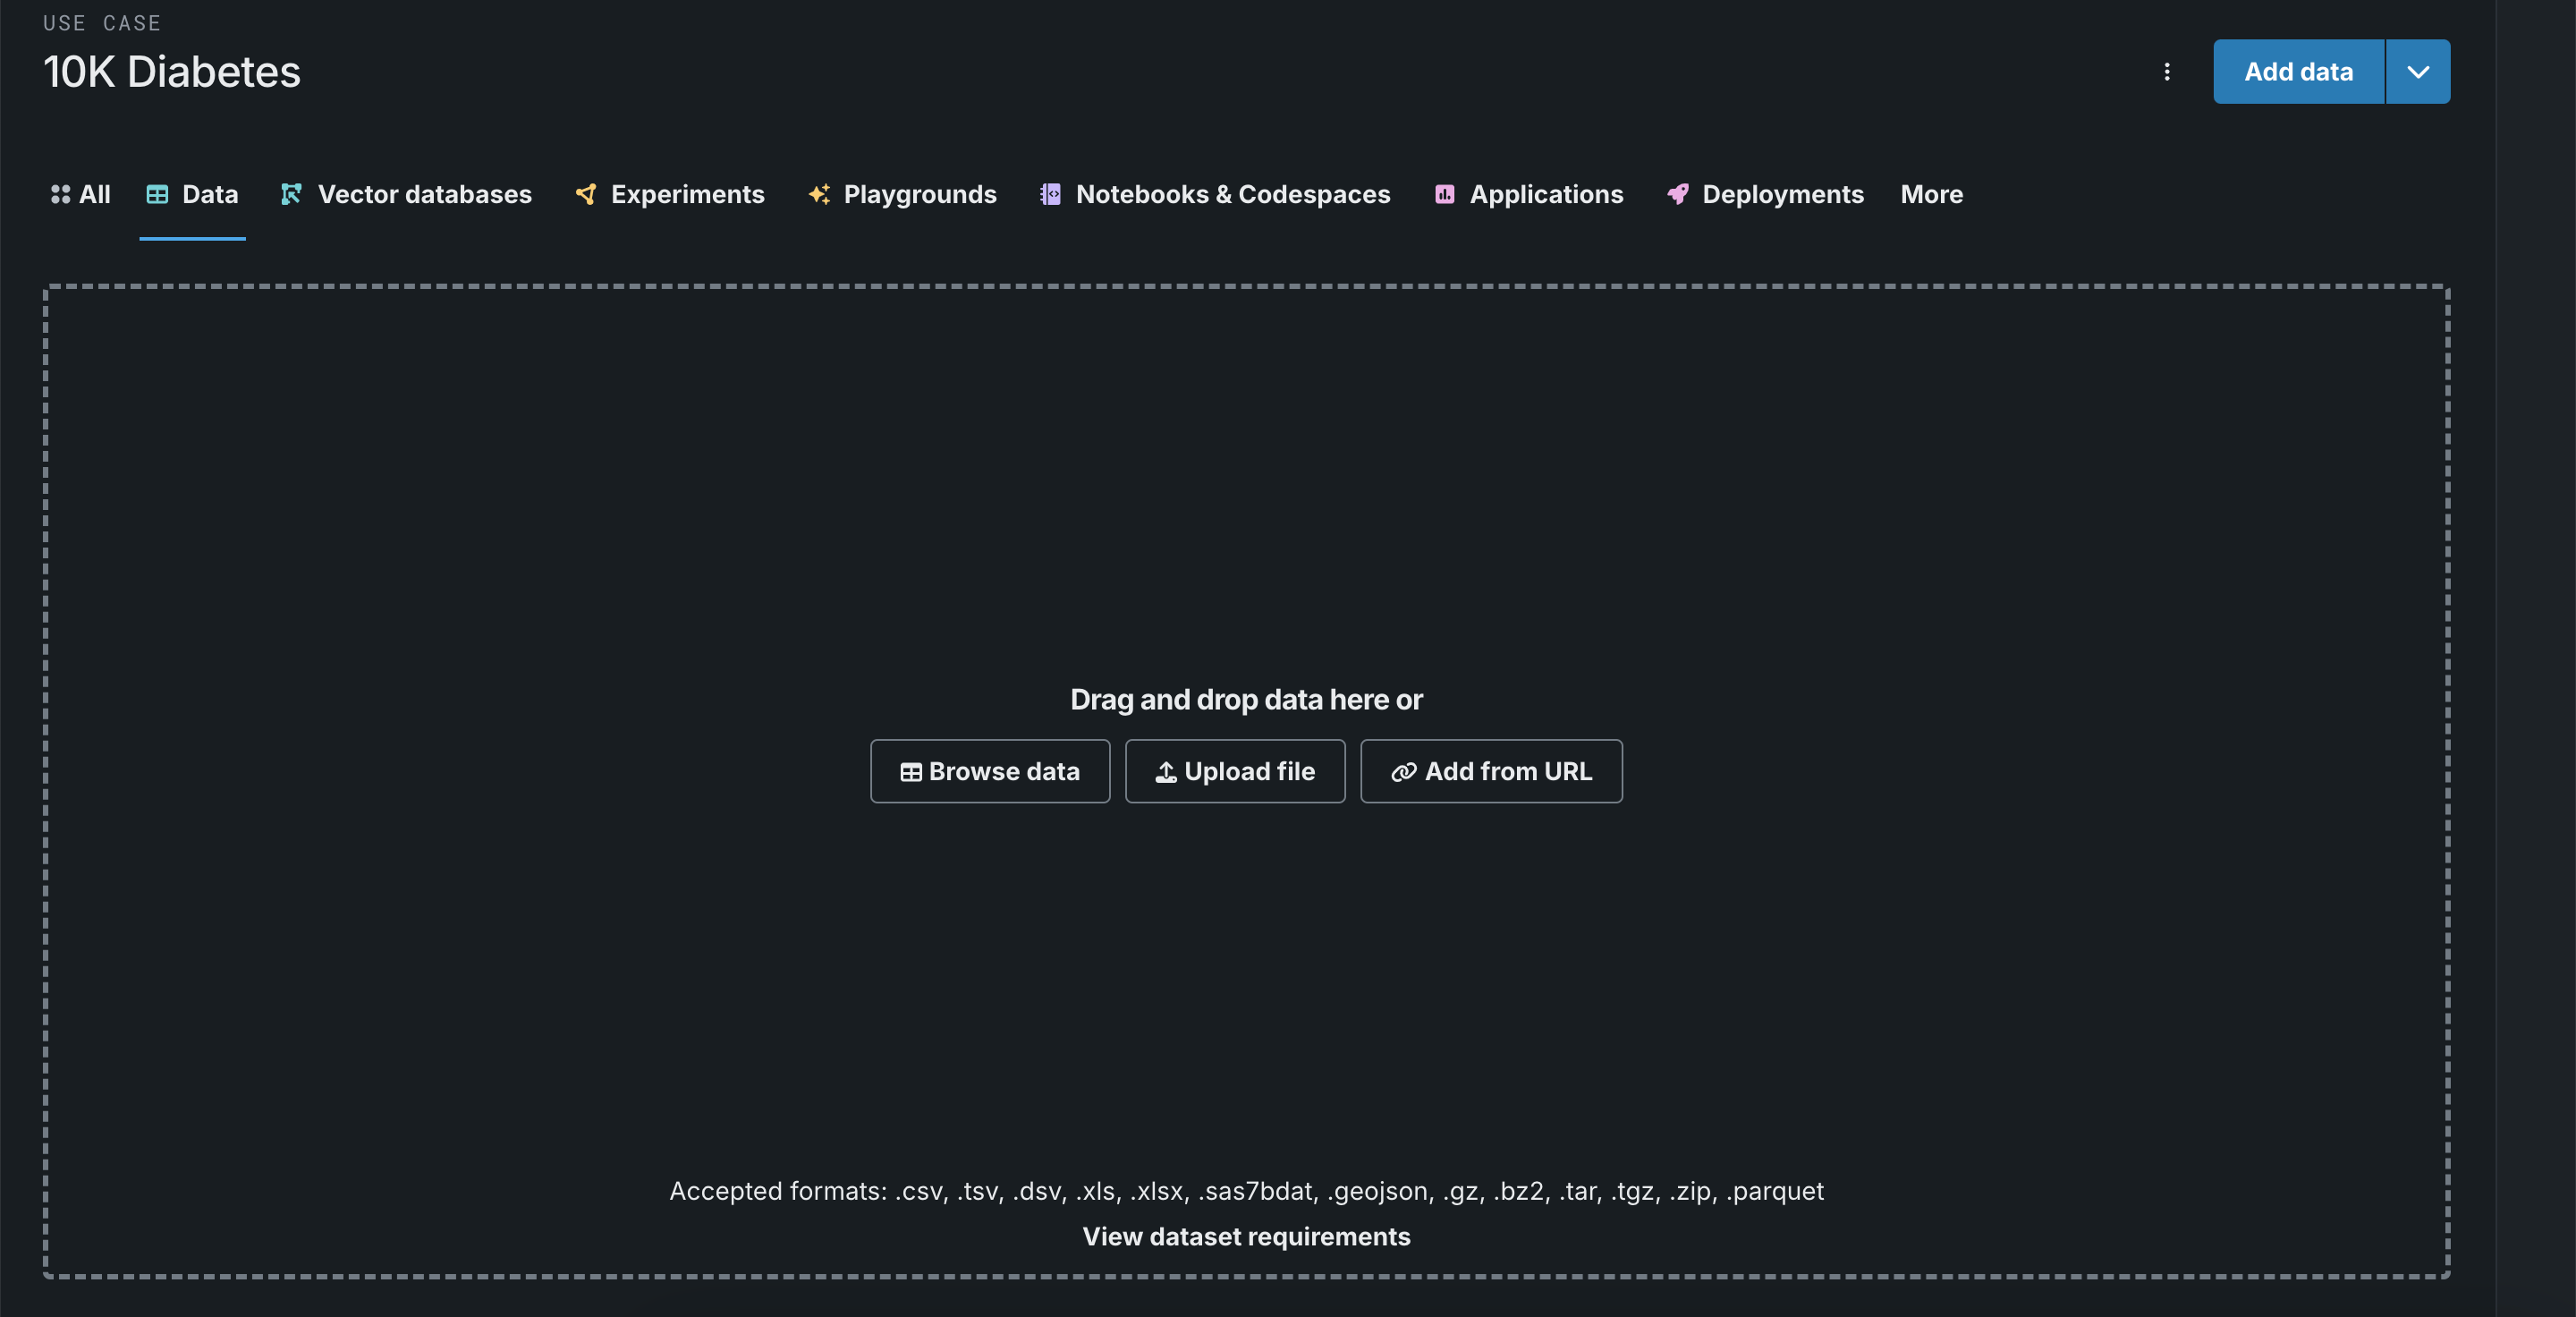
Additional improvements added to data prep in Workbench
This release introduces the following updates to the data preparation experience in Workbench:
-
Before you’ve added data to a Use Case, you can drag-and-drop data right onto the canvas or select a different upload option offered.
-
In the Add data modal, you can drag-and-drop data to register it in the Data Registry.
-
You can now also add data using a URL.
Time-aware data wrangling now GA
With time-aware wrangling, you can create recipes of operations for time-aware data and perform time series feature engineering during the data preparation phase. This method leverages the benefits of feature engineering for datasets larger than 10GB for time-aware use cases. The GA version offers support for Snowflake, Databricks, and BigQuery connections. Postgres connections and DataRobot Data Registry datasets are currently preview features. Improvements to the user-defined functions interface lets create new or used saved functions to significantly improve query performance.

Expanded feature engineering offerings for large datasets
This deployment brings time-aware predictions with feature transformations to Workbench, allowing you to leverage the benefits of feature engineering with datasets larger than 10GB for time-aware use cases. You can use this methodology in conjunction with time-aware wrangling and achieve full transparency of the transformation process. Use the modeling parameters to configure how to assign rows and make predictions based on forecast distance. DataRobot then builds separate models for each distance and makes row-by-row predictions.

Modeling
NextGen model Leaderboard reorganization eases insight navigation
With this deployment, Leaderboard insights for both predictive and time-aware experiments are grouped into tabs, with each tab representing the insight's function. Use search to find specific insights as well as to open multiple insights within a tab at once.
Two new insights have been introduced:
-
Related Assets, which show which assets are linked to the current model.
-
Metric Scores, which provides a single-view listing all partition scores for all metrics.

In addition, four new insights have been ported from DataRobot Classic:
- Logs
- Model info
- Downloads
- Eureqa
Single-view model comparison now GA
Released as a preview feature in September 2023, the Workbench model comparison capability is now generally available for binary classification and regression, non-time aware experiments. To simplify the iterative process of solving an ML business problem, Workbench provides a model comparison tool that allows you to compare up to three models, side-by-side, from any number of experiments within a single Use Case. Instead of having to look at each experiment individually and record metrics for later comparison, you can compare models across experiments in a single view.
The comparison Leaderboard is accessible from any project in Workbench. It can be filtered to more easily locate and select models, compare models across different insights, and view and compare metadata for the selected models. See the video for a demonstration.
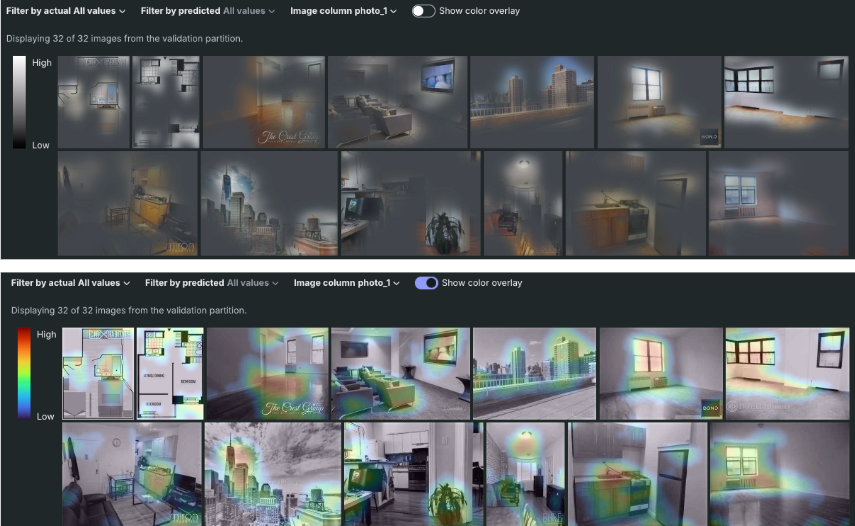
Visual AI’s image augmentation now available in Workbench
Image augmentation is a mechanism for expanding the modeling dataset by randomly transforming existing images. Once enabled for an experiment, a variety of transformations are available, including shifting, scaling, blurring, and others. Once models build, use the Attention Maps, Image embeddings, and Neural Network Visualizer insights to better understand what drives model decisions. Note that Visual AI is not supported in time series experiments, but is available for time-aware predictive experiments.
Multilabel modeling available in Workbench
Predictive modeling now supports multicategorical targets, allowing you to build multilabel modeling experiments. Multilabel modeling, a kind of classification task that allows each row in a dataset to be associated with one, several, or zero labels, provides addition flexibility beyond standard multiclass modeling. When setting up the experiment, you can also configure settings that remove selected labels to reduce model complexity. Once modeling completes, use the Multilabel: Per Label Metrics insight to evaluate models by summarizing per-label metric performance for metrics across different values of the prediction threshold.

Sparsity-related tasks added to Composable ML
In Composable ML, there are tasks that have specific input requirements around sparsity. For greater compatibility and to more easily connect to these types of downstream tasks, you can now do conversions without custom code using two new tasks: Sparse to Dense and Dense to Sparse.
Clustering now supported in Composable ML projects
Clustering, an application of unsupervised learning that lets you explore your data by grouping and identifying natural segments, is now a supported project type for applying Composable ML to customize blueprints.
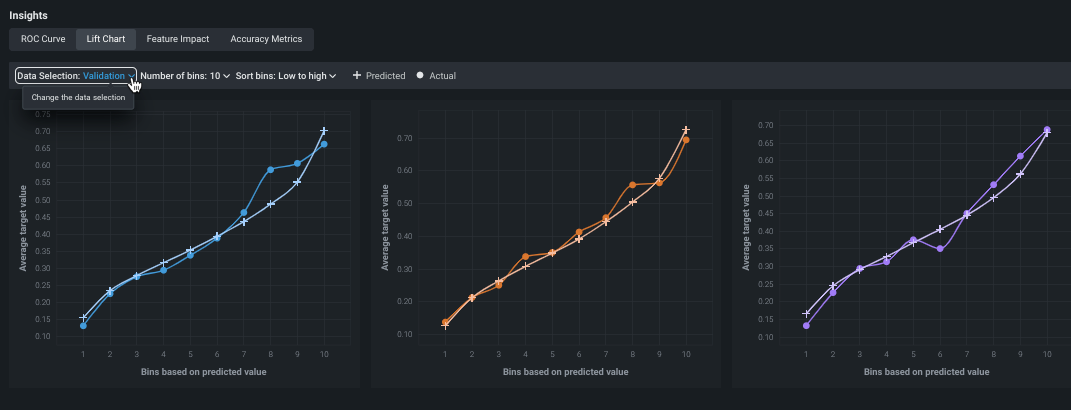
Universal SHAP now available for time series experiments
With this deployment, Workbench now offers SHAP computations for time series insights—Feature Impact, Individual Prediction Explanations, and SHAP distributions per feature. For models in time series experiments, DataRobot computes a unique set of SHAP values for each combination of primary date, forecast distance, and series ID (if present). All forecast distances are considered. Use the dropdowns to control the visualizations.

Detailed Blueprint views in Classic now GA
Blueprints that are viewed from the Leaderboard’s Blueprint tab are, by default, a read-only, summarized view, showing only those tasks used in the final model. However, the original modeling algorithm often contains many more “branches,” which DataRobot prunes when they are not applicable to the project data and feature list. Now, you can toggle to see a detailed view while in read-only mode. Previously the feature was in preview, requiring a feature flag. It is now generally available.

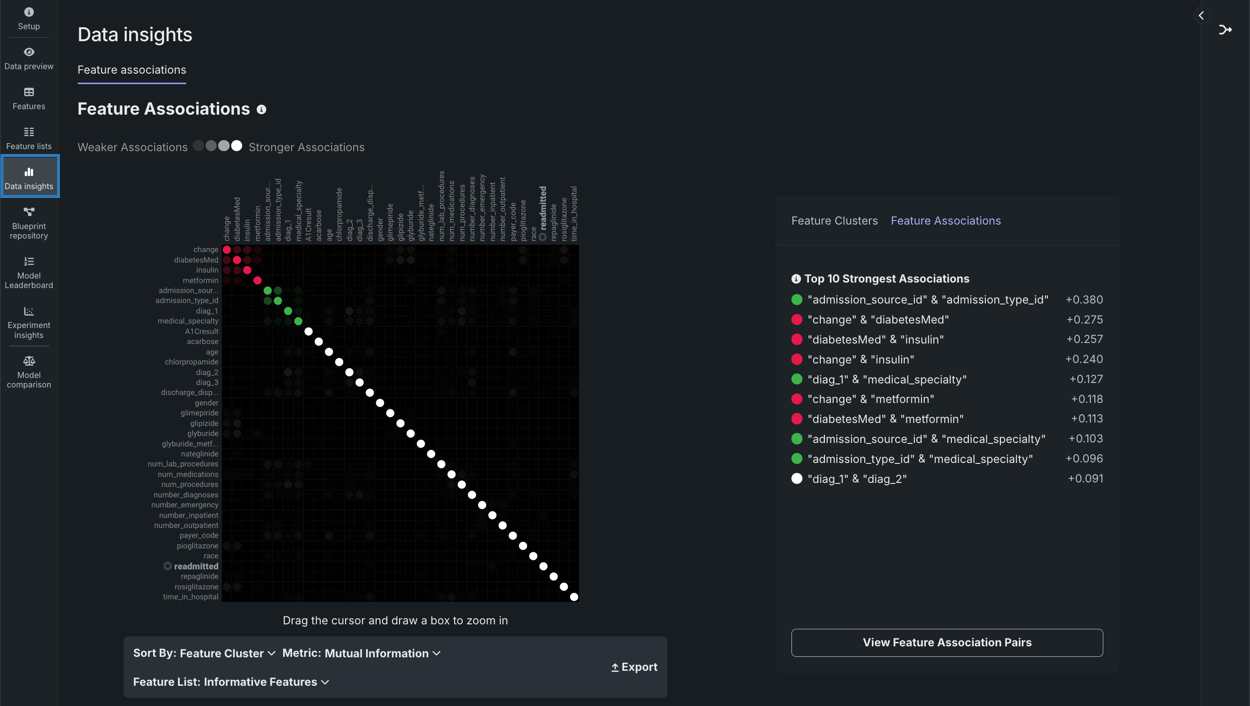
EDA2 Insights added to experiments in Workbench
You can now access EDA2 insights, generated during modeling, from your experiments in Workbench. There are three new tiles from which you can access various insights.
The Data preview tile displays a more visual representation of the features in the dataset you used for modeling, as well as a frequent values chart and collapsible Data Quality Assessment. Click on a feature to view additional information and insights.
The Features tile displays the dataset features in a table format alongside importance scores and summary statistics. Select specific features to view more detailed data insights than those shown on the Data preview tile. Note that the available insights are based on the feature variable type.
The Data insights tile displays the Feature Associations insight to help you track and visualize relationships within your data.
Platform
NextGen UI and navigation improvements
The following user experience and branding improvements have been added to NextGen:
- Across Workbench, second-level navigation is now always available from the left panel.
- You can now pin Use Cases to the top of the Use Case directory for quick access.
- Add tags to a Use Case for easy filtering and organization.
- The Use Case management page lets you add comments and descriptions, manage tags and users, and access Value Tracker and Risk assessment and management tools.
- A new full-width Leaderboard shows more information.
- The app's color palette has changed to reflect the new DataRobot branding and to better follow accessibility best practices.
Video: NextGen UI/UX improvements
NextGen now the default interface
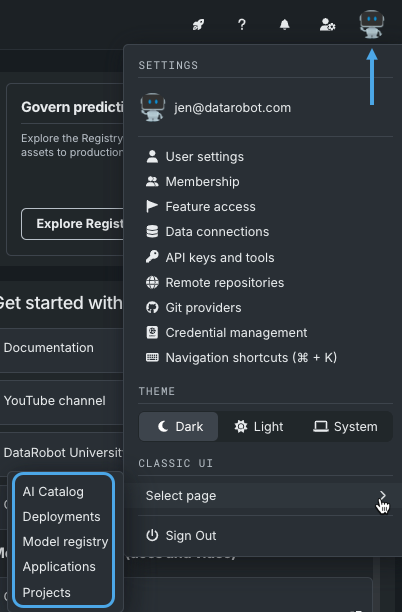
When opening the DataRobot application to the home page, as opposed to providing a path to a specific asset, you will now be brought to the NextGen home page. You can set your default home page experience in your user settings or, at any time, can return to DataRobot Classic from the Settings dropdown.
Track value and assess risk for a Use Case
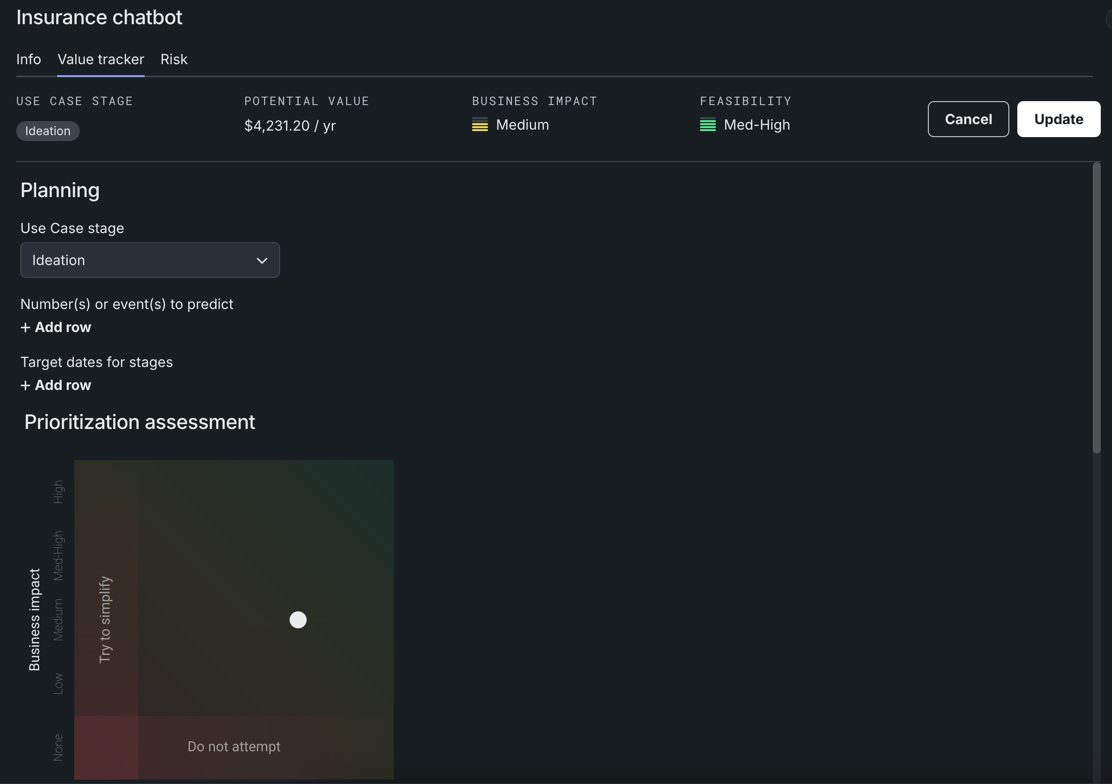
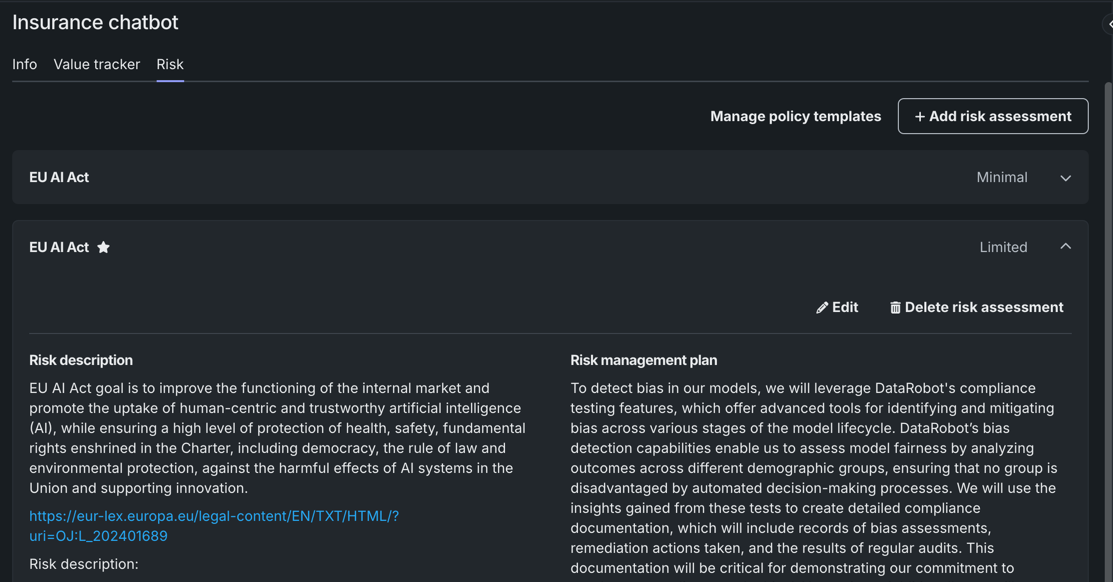
This release introduces the Value Tracker and Risk tabs within the Use Case management tile of a Use Case.
The Value Tracker allows you to specify what you expect to accomplish in a Use Case. You can measure success by defining the value you expect to get and tracking the actual value you receive in real time. The Value Tracker also utilizes Use Case tools to collect the various DataRobot assets you are using to achieve your goals and collaborate with others.
On the Risk tab, you can identify potential risks to the Use Case, and then determine how you plan to address and mitigate those risks using DataRobot risk management tools. Risk includes anything that may impact the Use Case, including legal, operational, IT security, strategic, bias and fairness, and more. Because risk is always changing, risk assessments need to be updated and/or created periodically.
Use shortcuts to navigate across NextGen
You can now use keyboard shortcuts to navigate across the NextGen platform. To open the shortcuts menu:
- On your keyboard, press Cmd+K.
- Go to User Settings and select Navigation shortcuts.
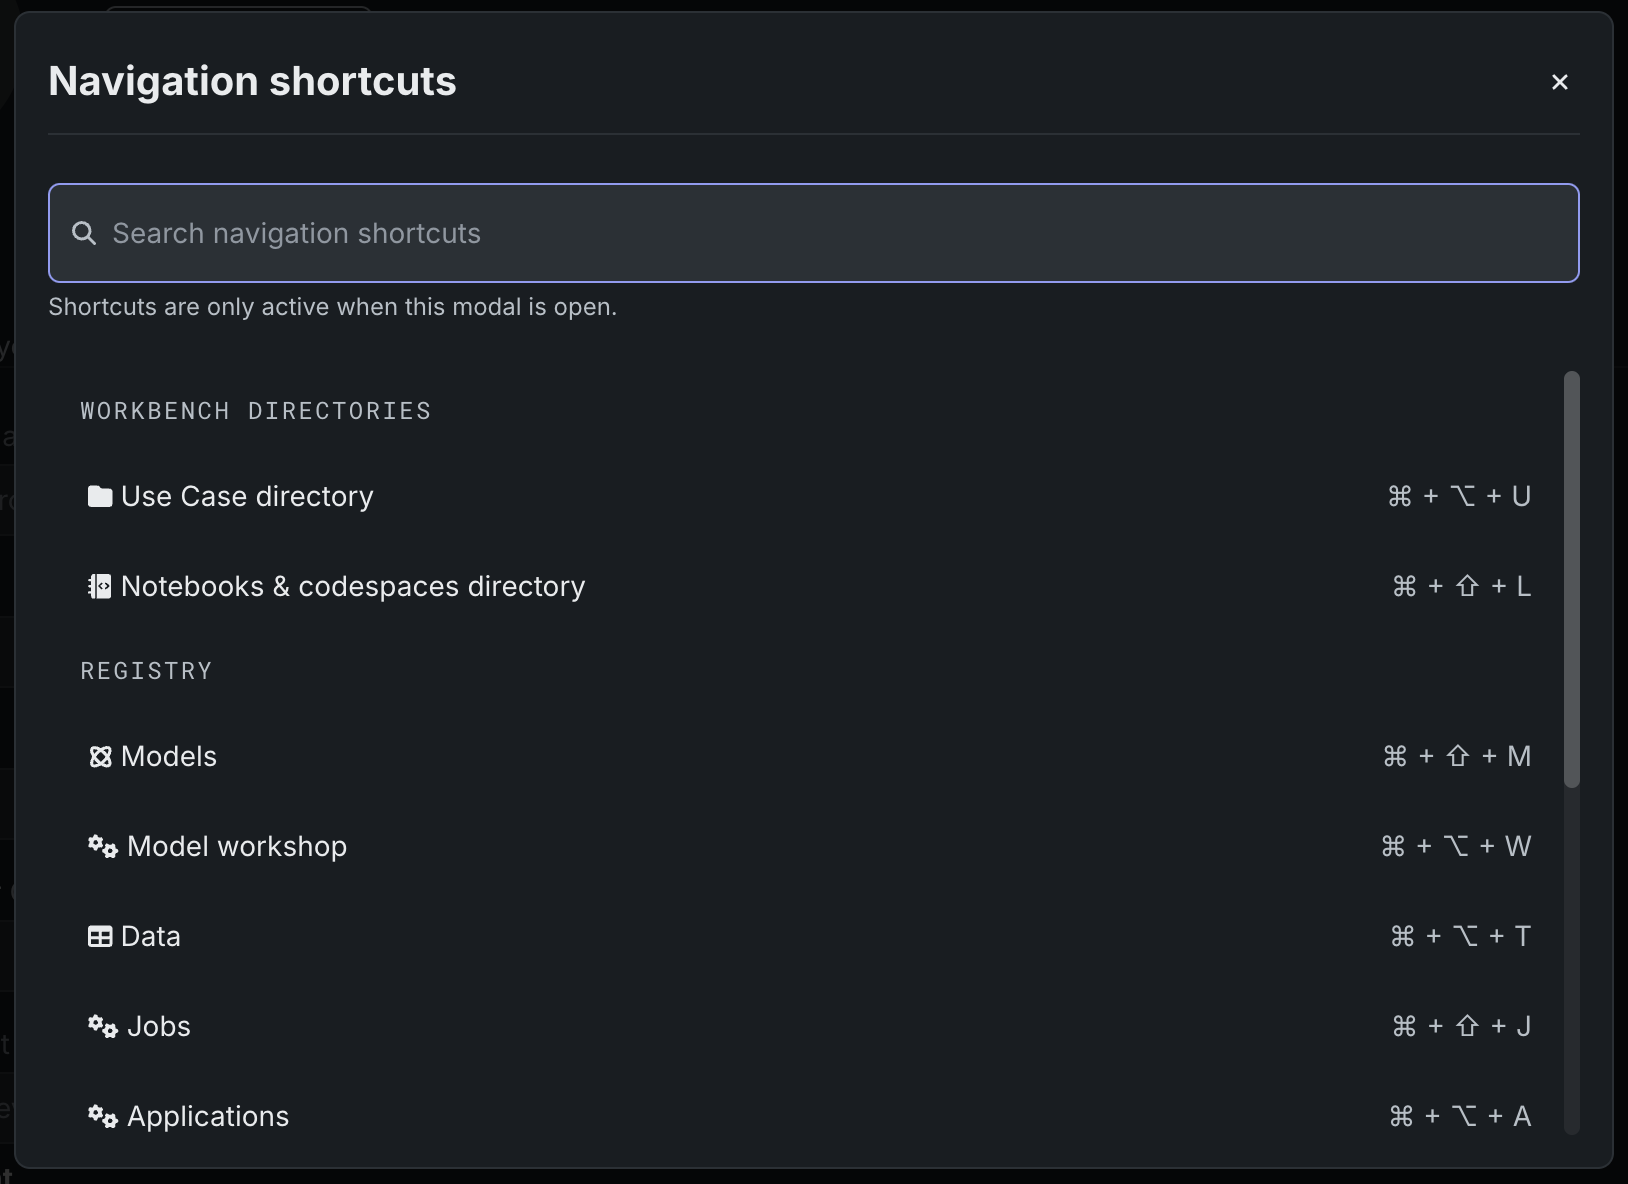
Use the search bar at the top to find specific shortcuts. Note that you can only execute navigation shortcuts when the menu is open.
DataRobot now supports PostgresSQL 14
DataRobot now supports Postgres SQL version 14.0. See the Admin and Install Guide for more information on upgrading from version 12.0 to 14.0.
Admin
Seat licenses
Administrators can now manage user permissions by assigning seat licenses to the user accounts rather than configuring user access one permission at a time. This mechanism allows administrators to more finely control the number of users that have access to the deployment, as well as fine-tune the desired access level for each user.
For more details, see the documentation for configuring and assigning seat licenses.
All product and company names are trademarks™ or registered® trademarks of their respective holders. Use of them does not imply any affiliation with or endorsement by them.