MLOps and predictions (V11.0)
April 14, 2025
The DataRobot V11.0.0 release includes many new features and capabilities, described below. See additional details of Release 11.0:
Features grouped by capability
* Premium
Predictions and MLOps
NVIDIA AI Enterprise integration
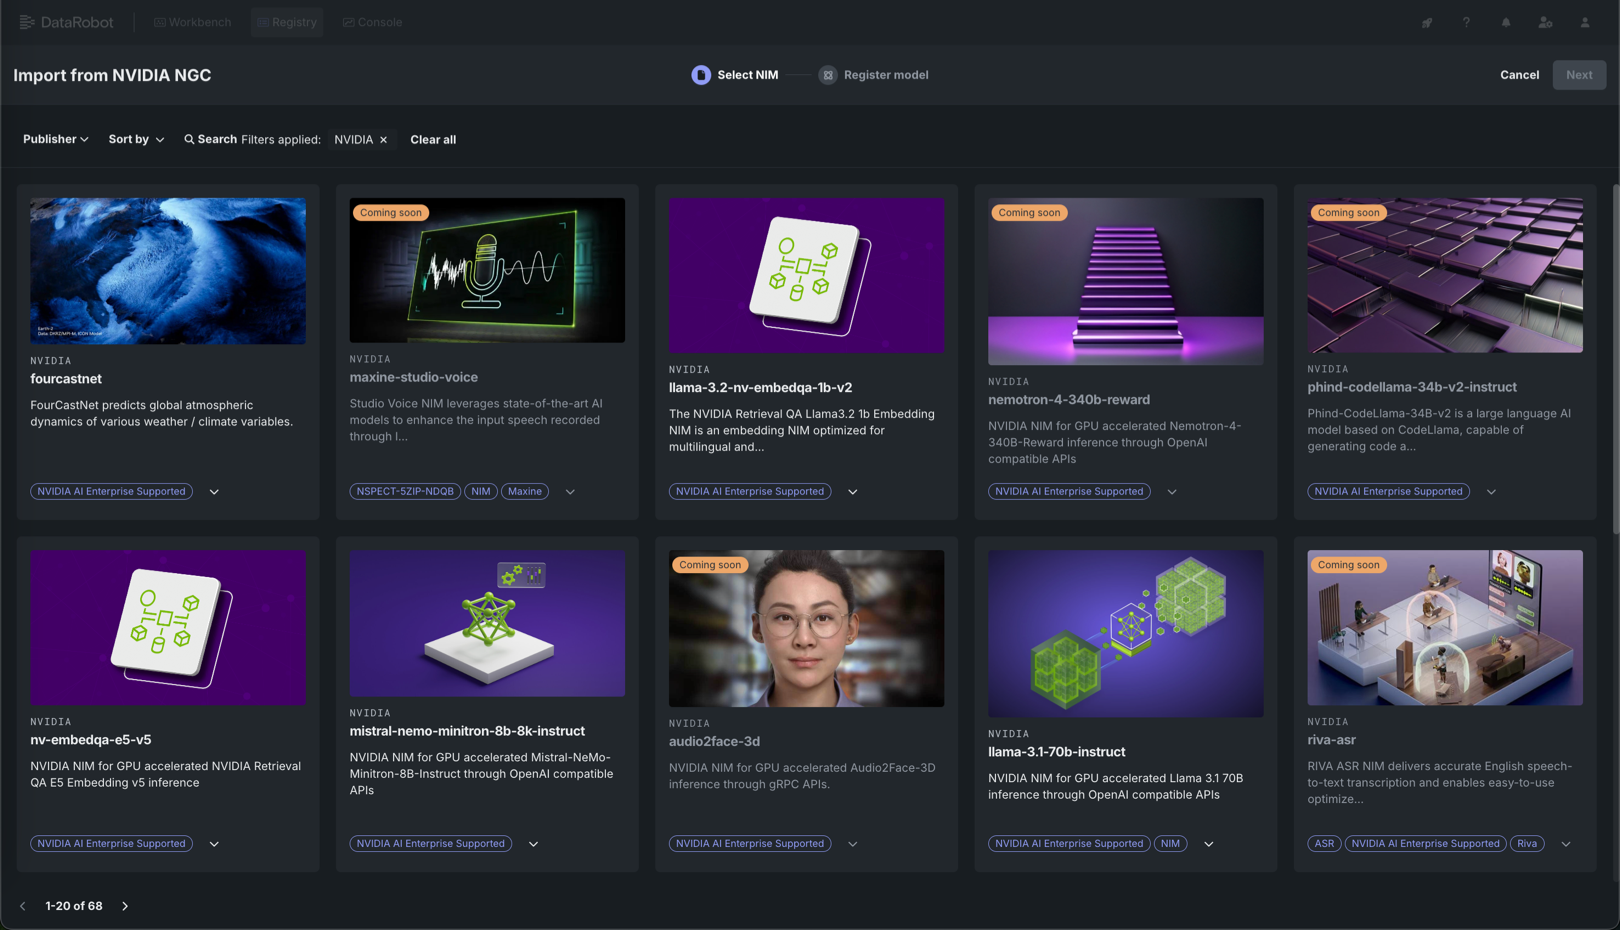
NVIDIA AI Enterprise and DataRobot provide a pre-built AI stack solution, designed to integrate with your organization's existing DataRobot infrastructure, providing access to robust evaluation, governance, and monitoring features. This integration includes a comprehensive array of tools for end-to-end AI orchestration, accelerating your organization's data science pipelines to rapidly deploy production-grade AI applications on NVIDIA GPUs in DataRobot Serverless Compute.
In DataRobot, create custom AI applications tailored to your organization's needs by selecting NVIDIA Inference Microservices (NVIDIA NIM) from a gallery of AI applications and agents. NVIDIA NIM provides pre-built and pre-configured microservices within NVIDIA AI Enterprise, designed to accelerate the deployment of generative AI across enterprises.
For more information on the NVIDIA AI Enterprise and DataRobot integration, review the workflow summary documentation, or review the documentation listed below:
| Task | Description |
|---|---|
| Create an inference endpoint for NVIDIA NIM | Register and deploy with NVIDIA NIM to create inference endpoints accessible through code or the DataRobot UI. |
| Evaluate a text generation NVIDIA NIM in the playground | Add a deployed text generation NVIDIA NIM to a blueprint in the playground to access an array of comparison and evaluation tools. |
| Use an embedding NVIDIA NIM to create a vector database | Add a registered or deployed embedding NVIDIA NIM to a Use Case with a vector database to enrich prompts in the playground with relevant context before they are sent to the LLM. |
| Use NVIDIA NeMo Guardrails in a moderation framework to secure your application | Connect NVIDIA NeMo Guardrails to deployed text generation models to guard against off-topic discussions, unsafe content, and jailbreaking attempts. |
| Use a text generation NVIDIA NIM in an application template | Customize application templates from DataRobot to use a registered or deployed NVIDIA NIM text generation model. |
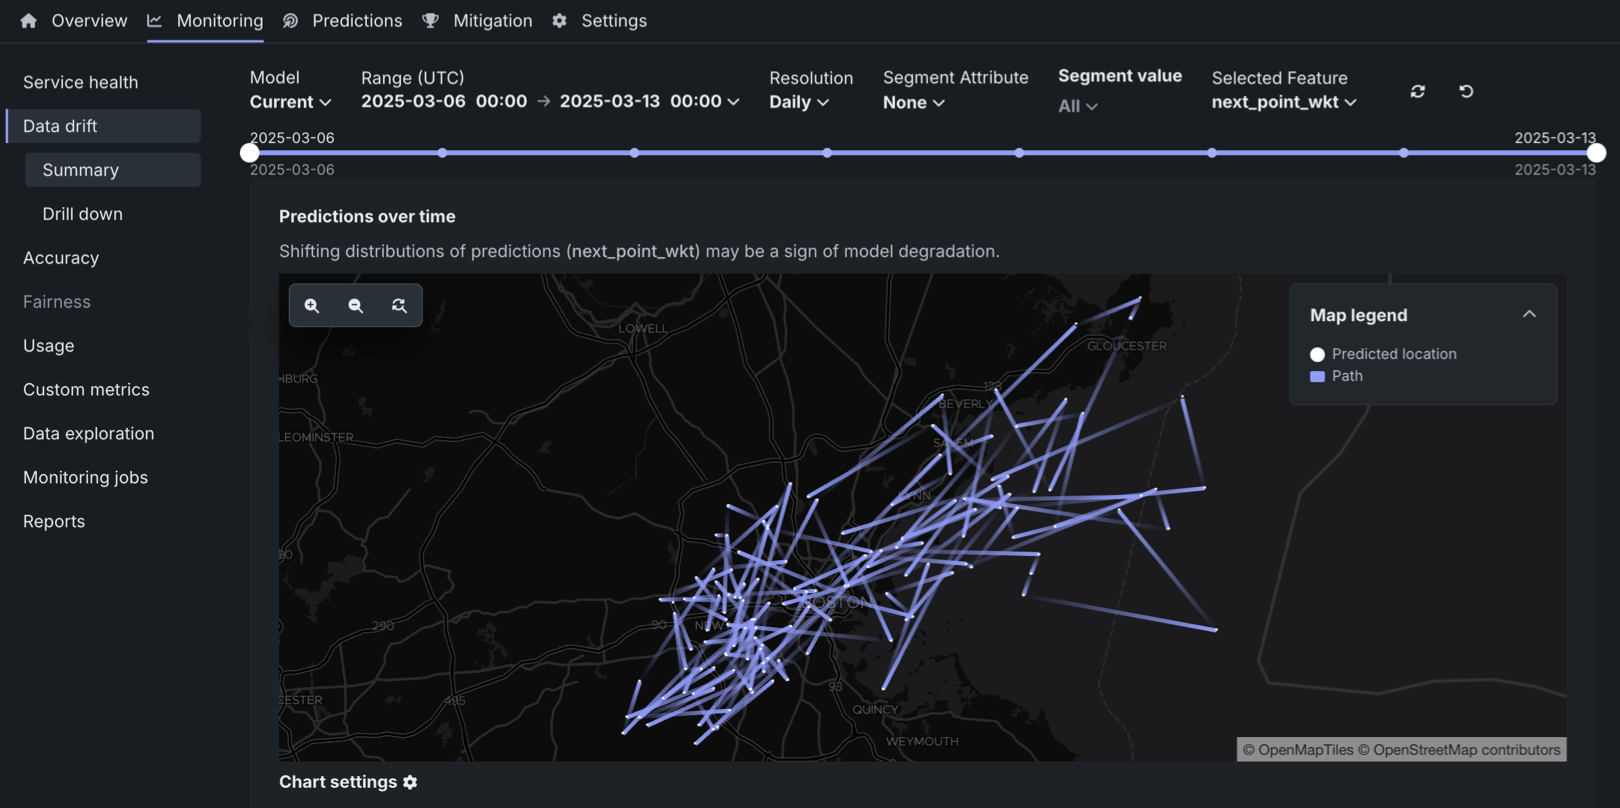
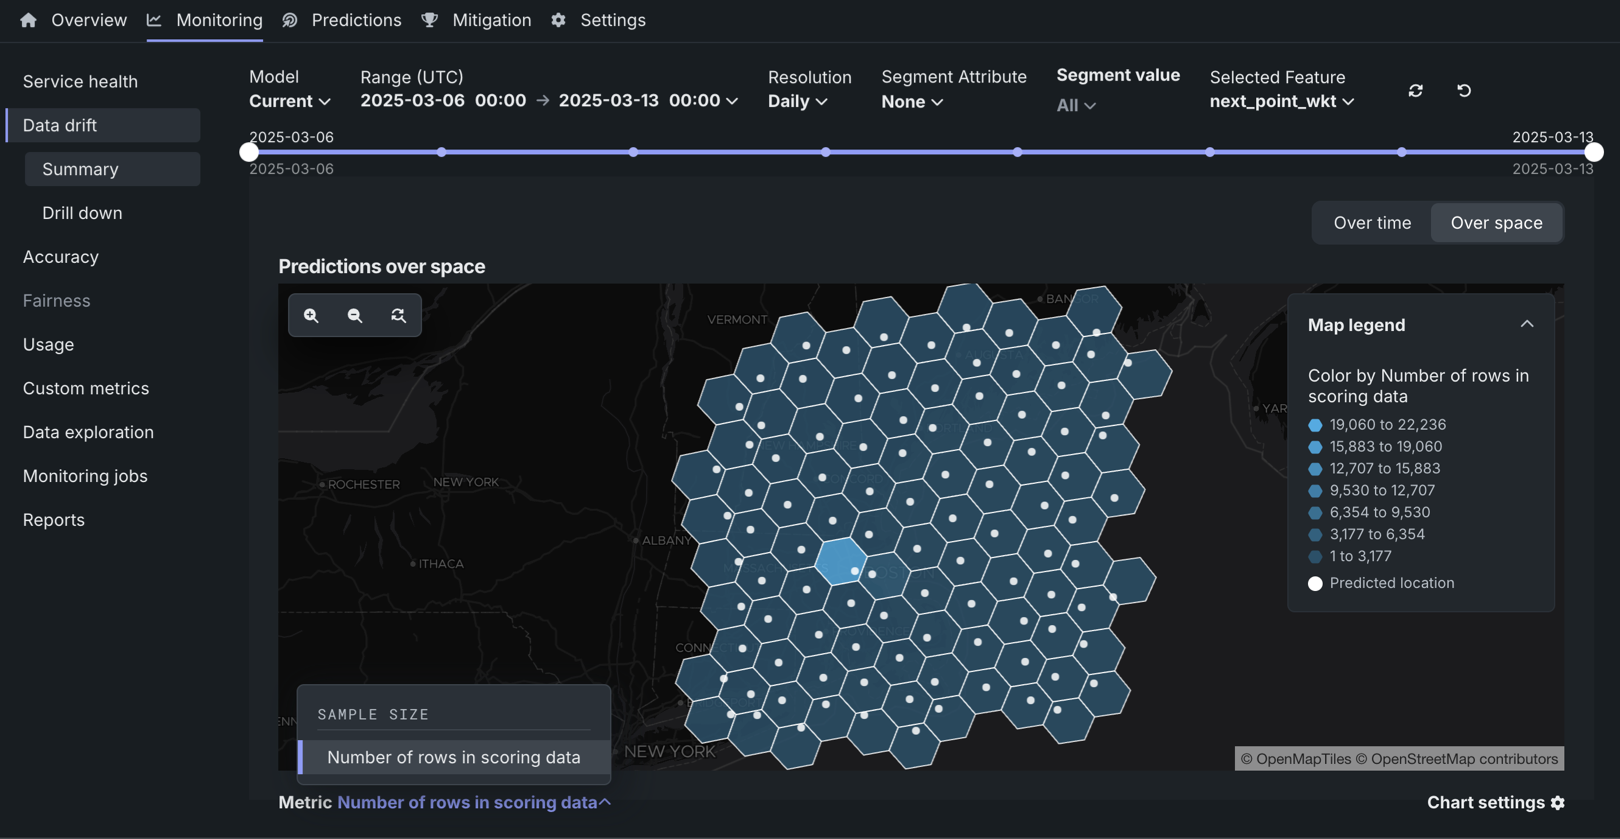
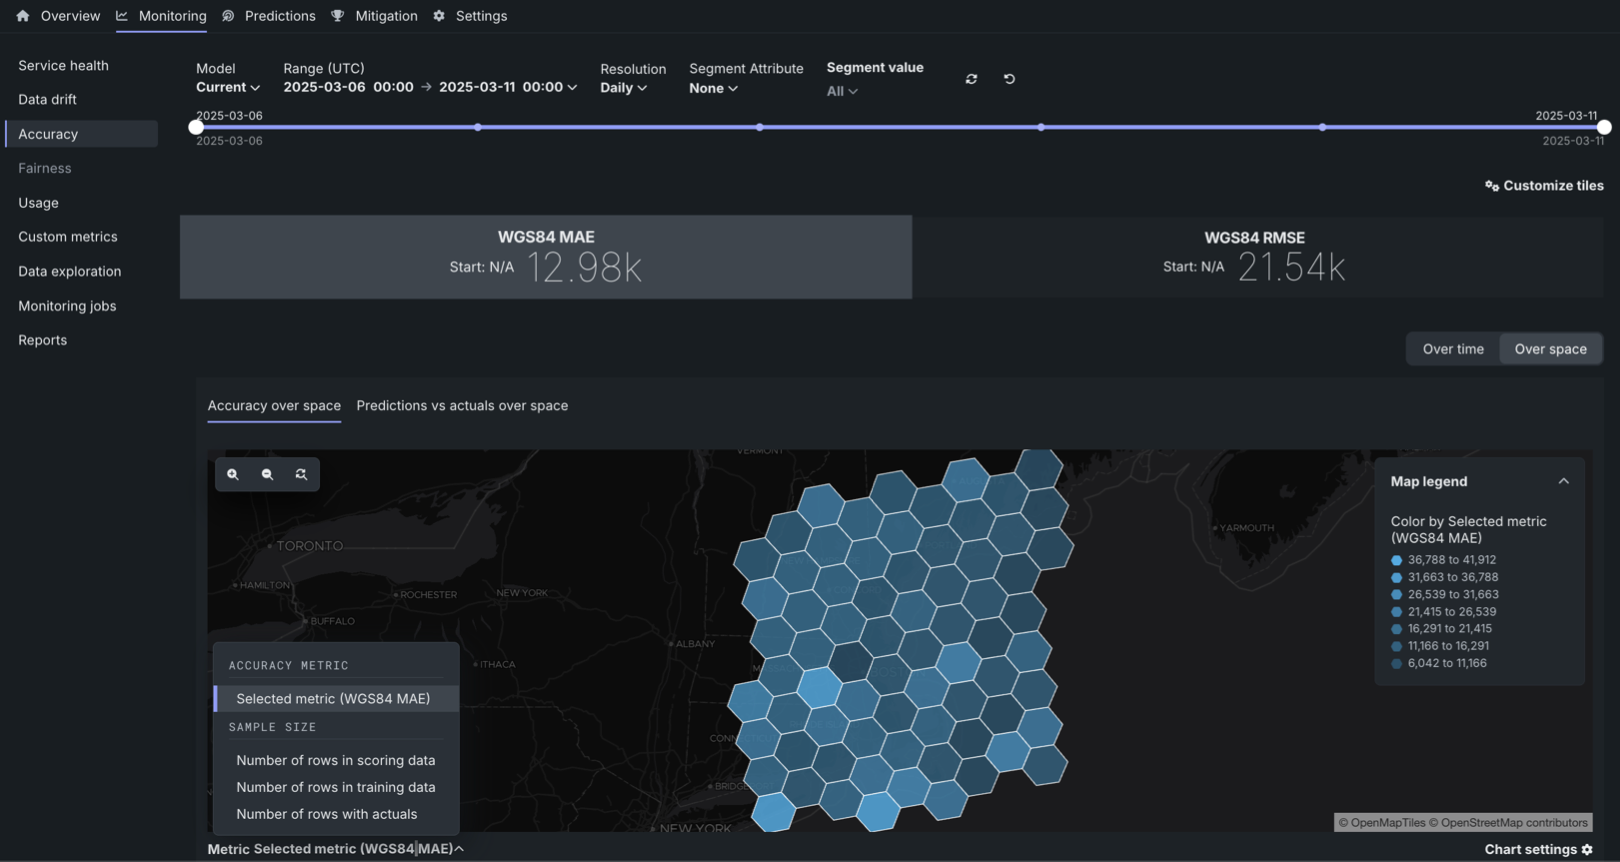
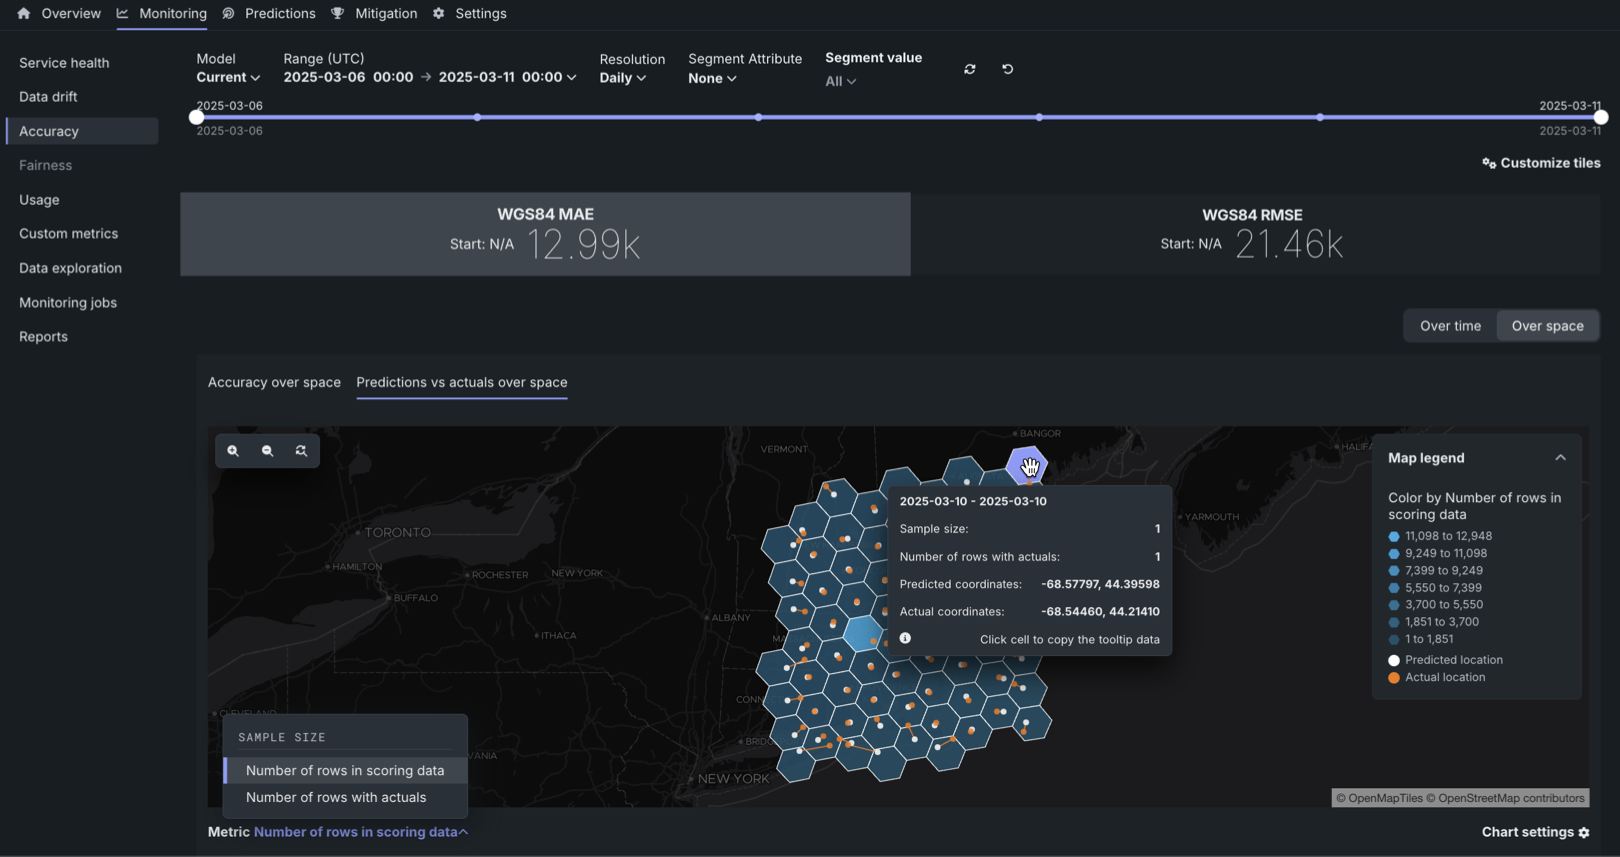
Geospatial monitoring for deployments
For deployed binary classification, regression, multiclass, or location models, built with location data in the training dataset, you can leverage DataRobot Location AI to perform geospatial monitoring on the deployment's Data drift and Accuracy tabs. The available visualizations depend on the target type. To enable geospatial analysis for a deployment, enable segmented analysis and define a segment for the location feature generated during location data ingest. The location segment (e.g., geometry or DataRobot-Geo-Target) contains the identifier used to segment the world into a grid of H3 cells. In this release, the following visualizations were added for the Location target type:
For more information, see the documentation
For more information, see the documentation
For more information, see the documentation.
For more information, see the documentation.
Create and monitor geospatial custom metrics
When you create custom metrics and hosted custom metrics jobs, you can specify that a metric is geospatial and select a geospatial segment attribute. After you add a geospatial custom metric to a deployment, you can review the metric data on the Custom metrics tab, using the new geospatial metric chart view:

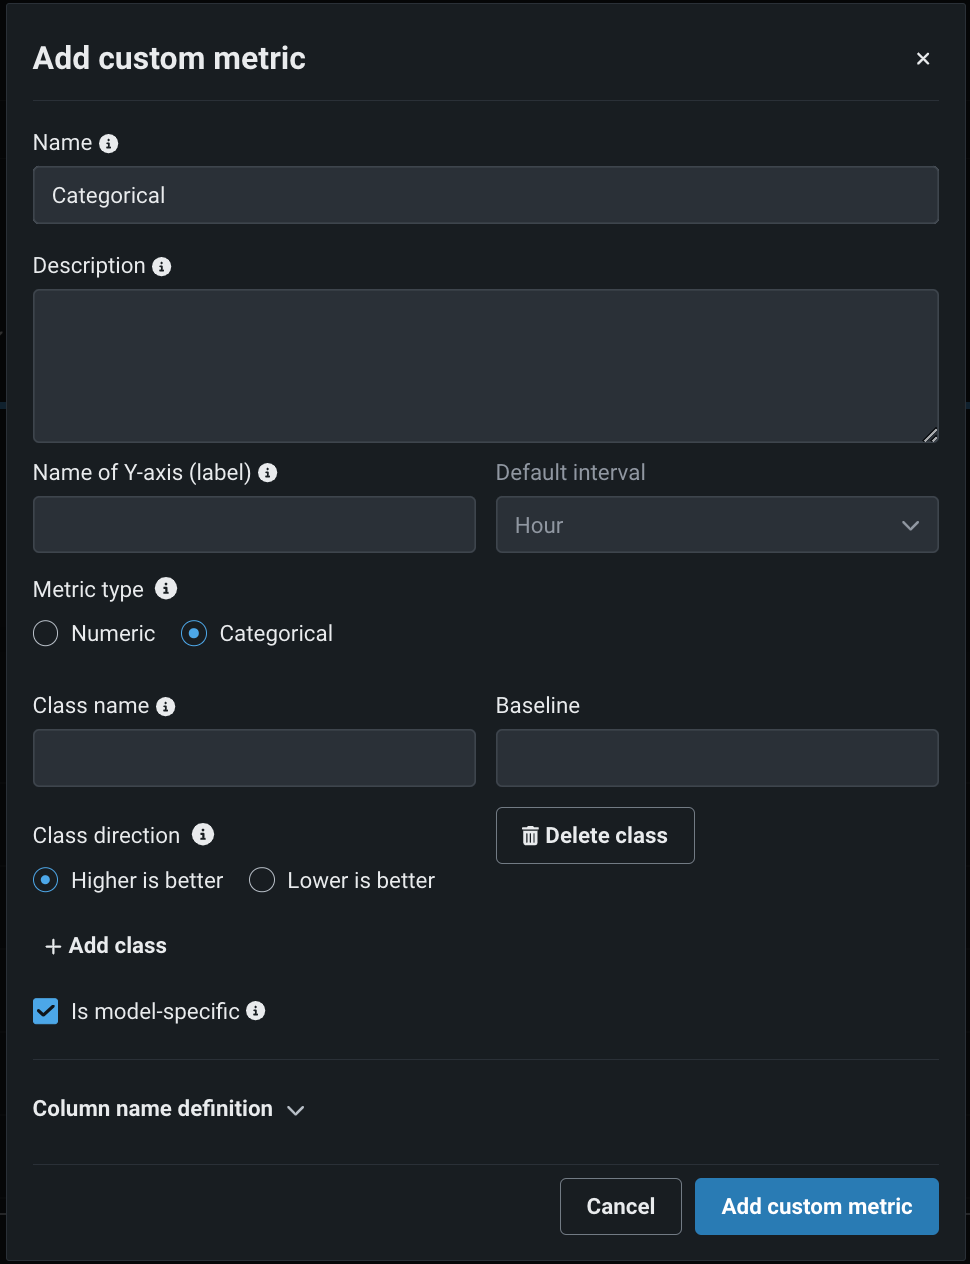
Create categorical custom metrics
In the NextGen Console, on a deployment’s Custom metrics tab, you can define categorical metrics when you create an external metric. For each categorical metric, you can define up to 10 classes.
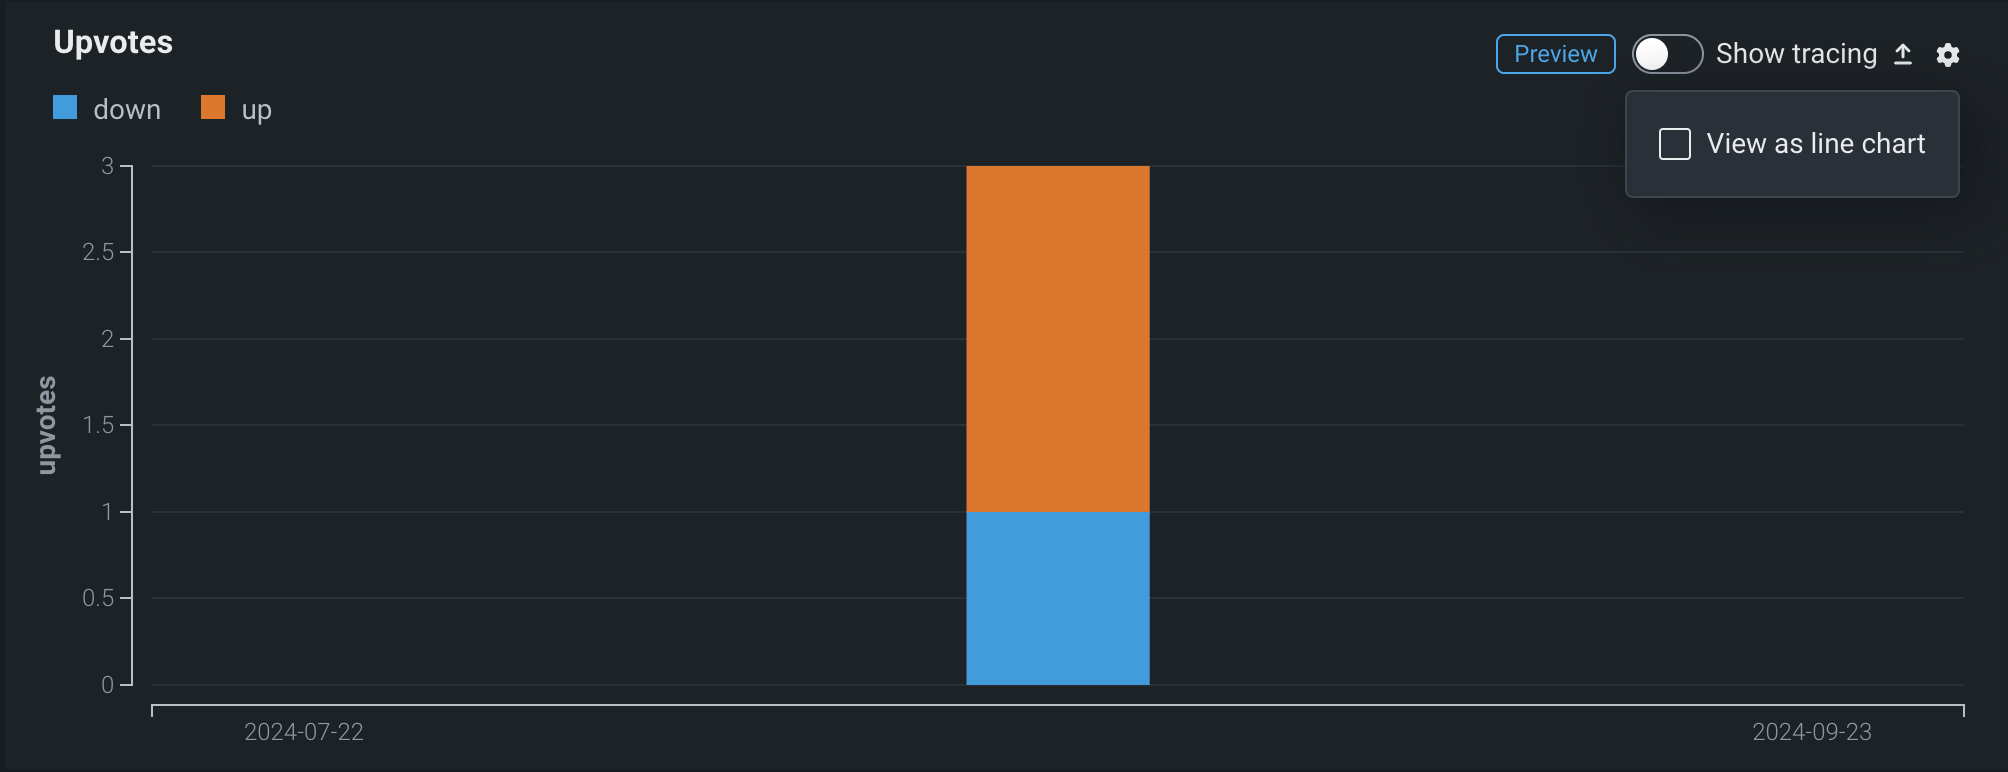
By default, these metrics are visualized in a bar chart on the Custom metrics tab; however, you can configure the chart type from the settings menu.
Review activity logs in Console
In the NextGen Console, you can review model, deployment, custom model, agent, and moderation events from a central location: the Activity log tab.
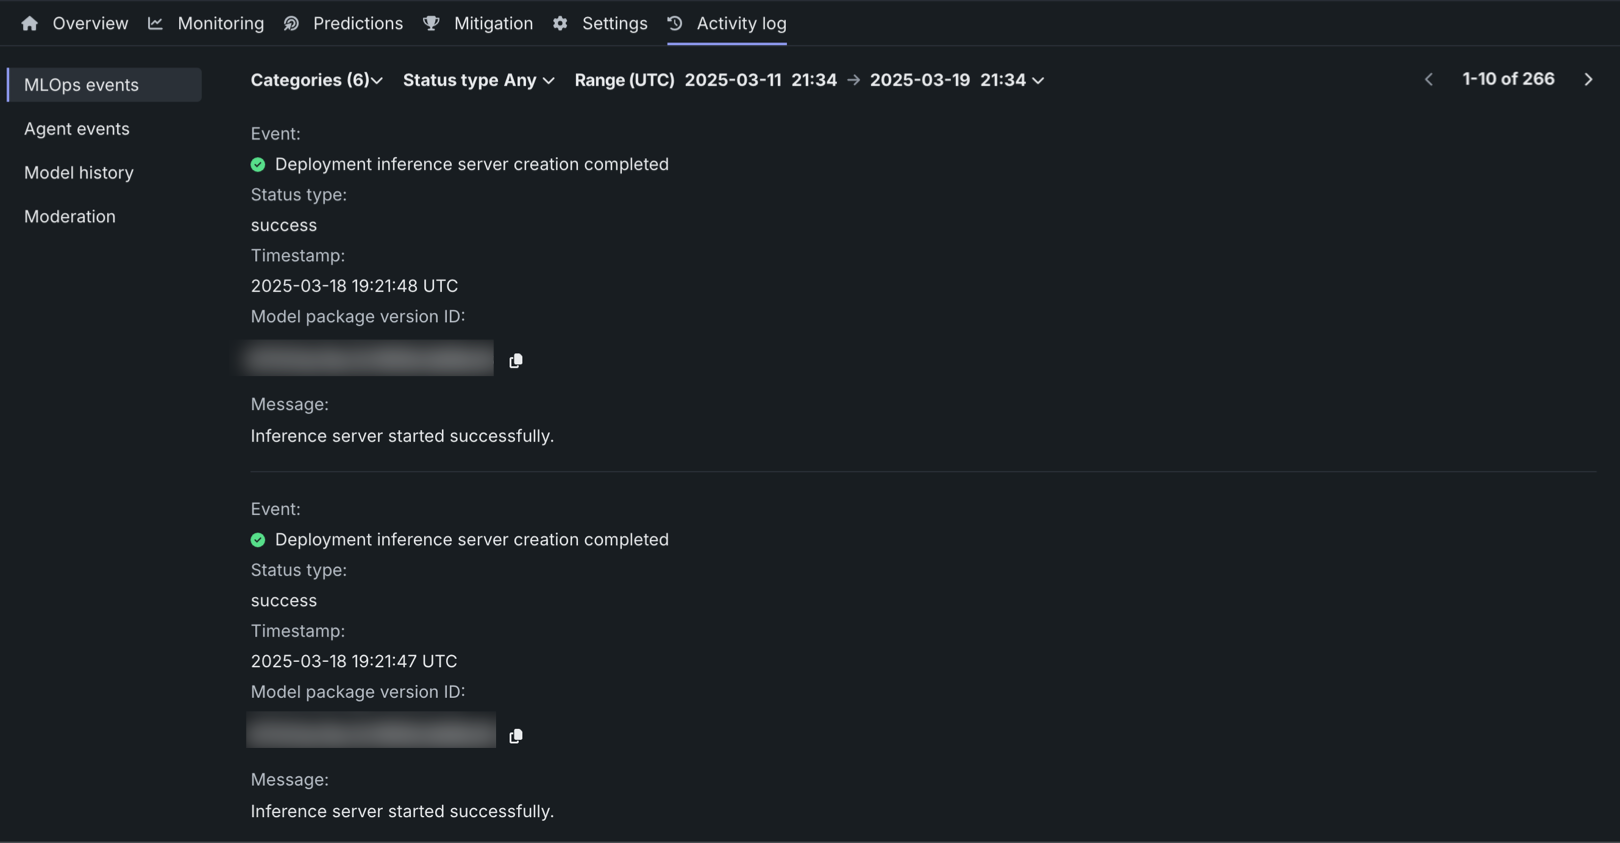
This tab includes the following sub-tabs, recording an array of logging activity.
| Tab | Logging |
|---|---|
| MLOps events | Important deployment events. |
| Agent events | Management and monitoring events from the MLOps agents. |
| Model history | A historical log of deployment events. |
| Runtime logs | Custom model runtime log events. |
| Moderation | Evaluation and moderation events. |
Link a retraining policy to a Use Case
When you create a retraining policy in Console, you can link the policy to a Use Case in Workbench, selecting an existing Use Case or creating a new Use Case. While a retraining policy is linked to a Use Case, the registered retraining models are listed in the Use Case's assets. To link a retraining policy to a Use Case, select a Use Case when you create the policy:
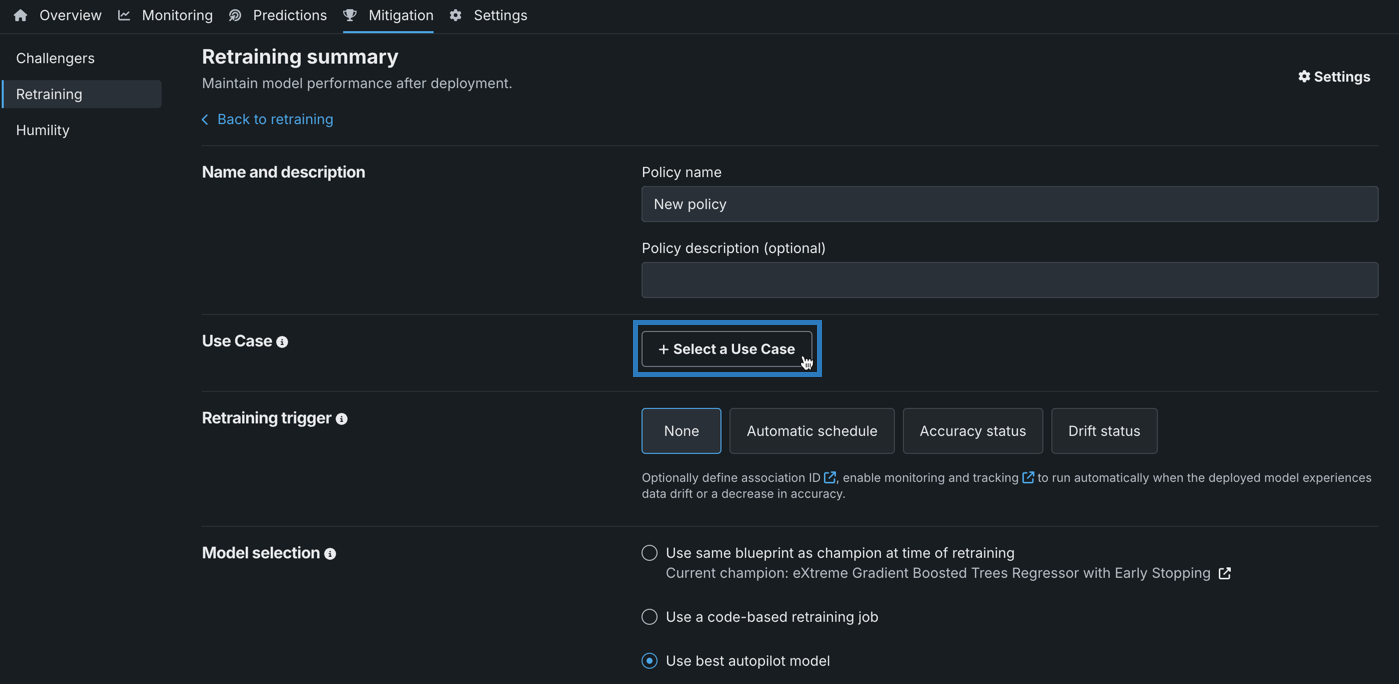
If a deployment is linked to a Use Case, that deployment's retraining policies and the resulting retrained models are automatically linked to that Use Case; however, you can override the default Use Case for each policy. If a retraining user is specified in the deployment settings, they must have Owner or User access to the Use Case.
Retraining policy management in the Classic UI
You can start retraining policies or cancel retraining policies from the Classic UI; however, to edit or delete a retraining policy, use the NextGen UI.
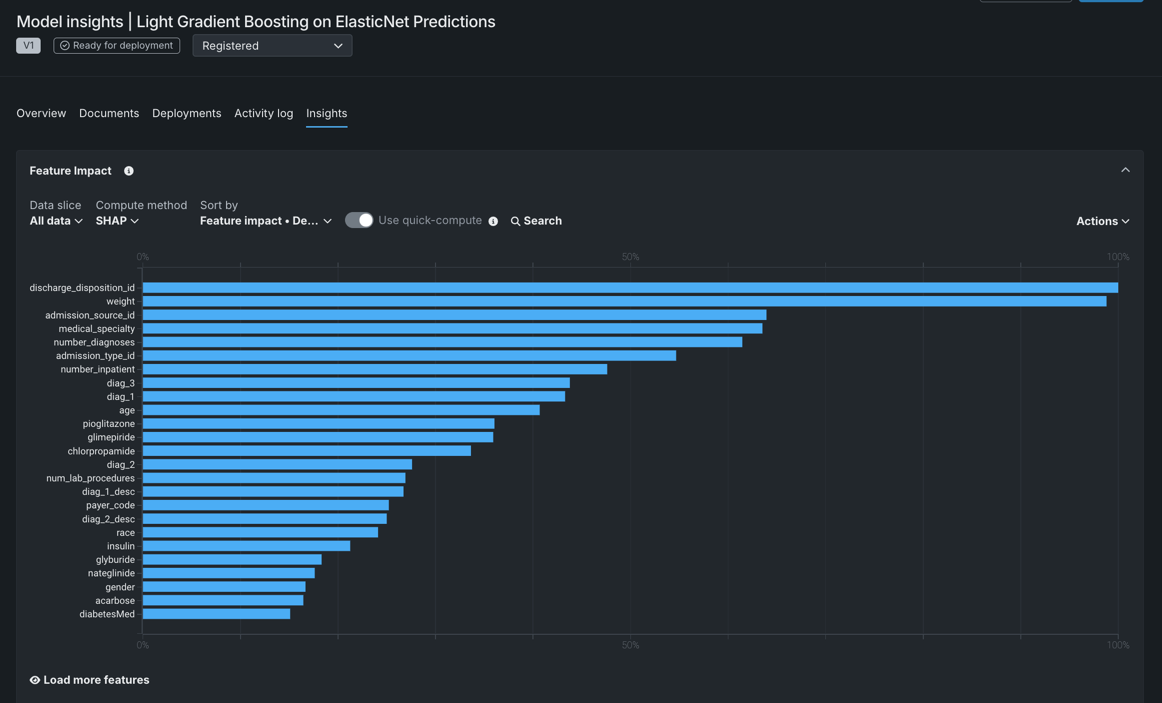
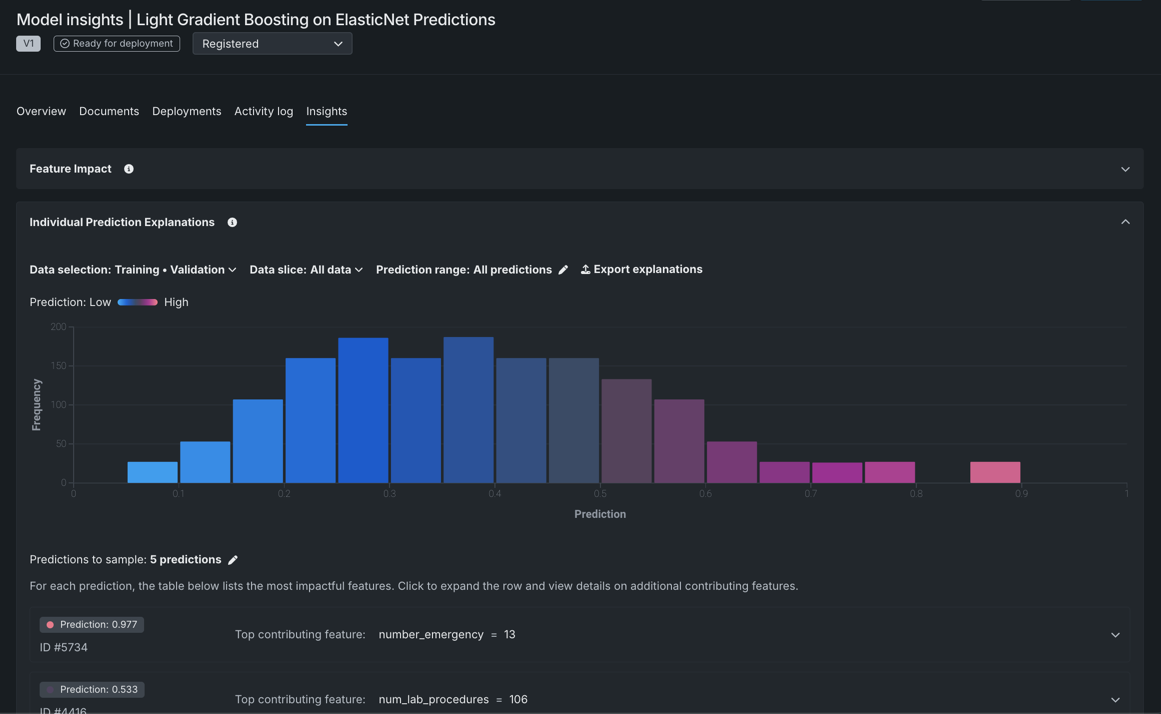
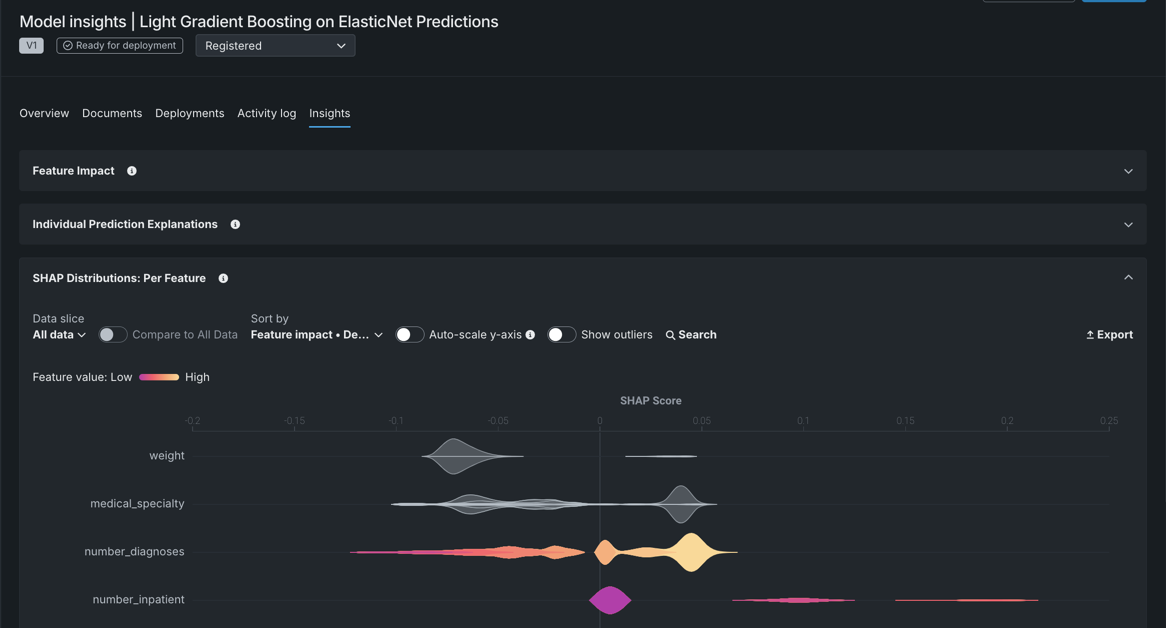
View model insights in Registry
For DataRobot and custom models in Registry, the Insights tab is now generally available. With the GA release of this feature, the following insights are available:
| Insight | Description | Problem type | Sliced insights? |
|---|---|---|---|
| Feature Impact | Shows which features are driving model decisions. | All | ✔ |
| Individual Prediction Explanations | Estimates how much each feature contributes to a given prediction, with values based on difference from the average. | Binary classification, regression | ✔ |
| SHAP Distributions: Per Feature | Displays, via a violin plot, the distribution of SHAP values and feature values to aid in the analysis of how feature values influence predictions. | Binary classification, regression | ✔ |
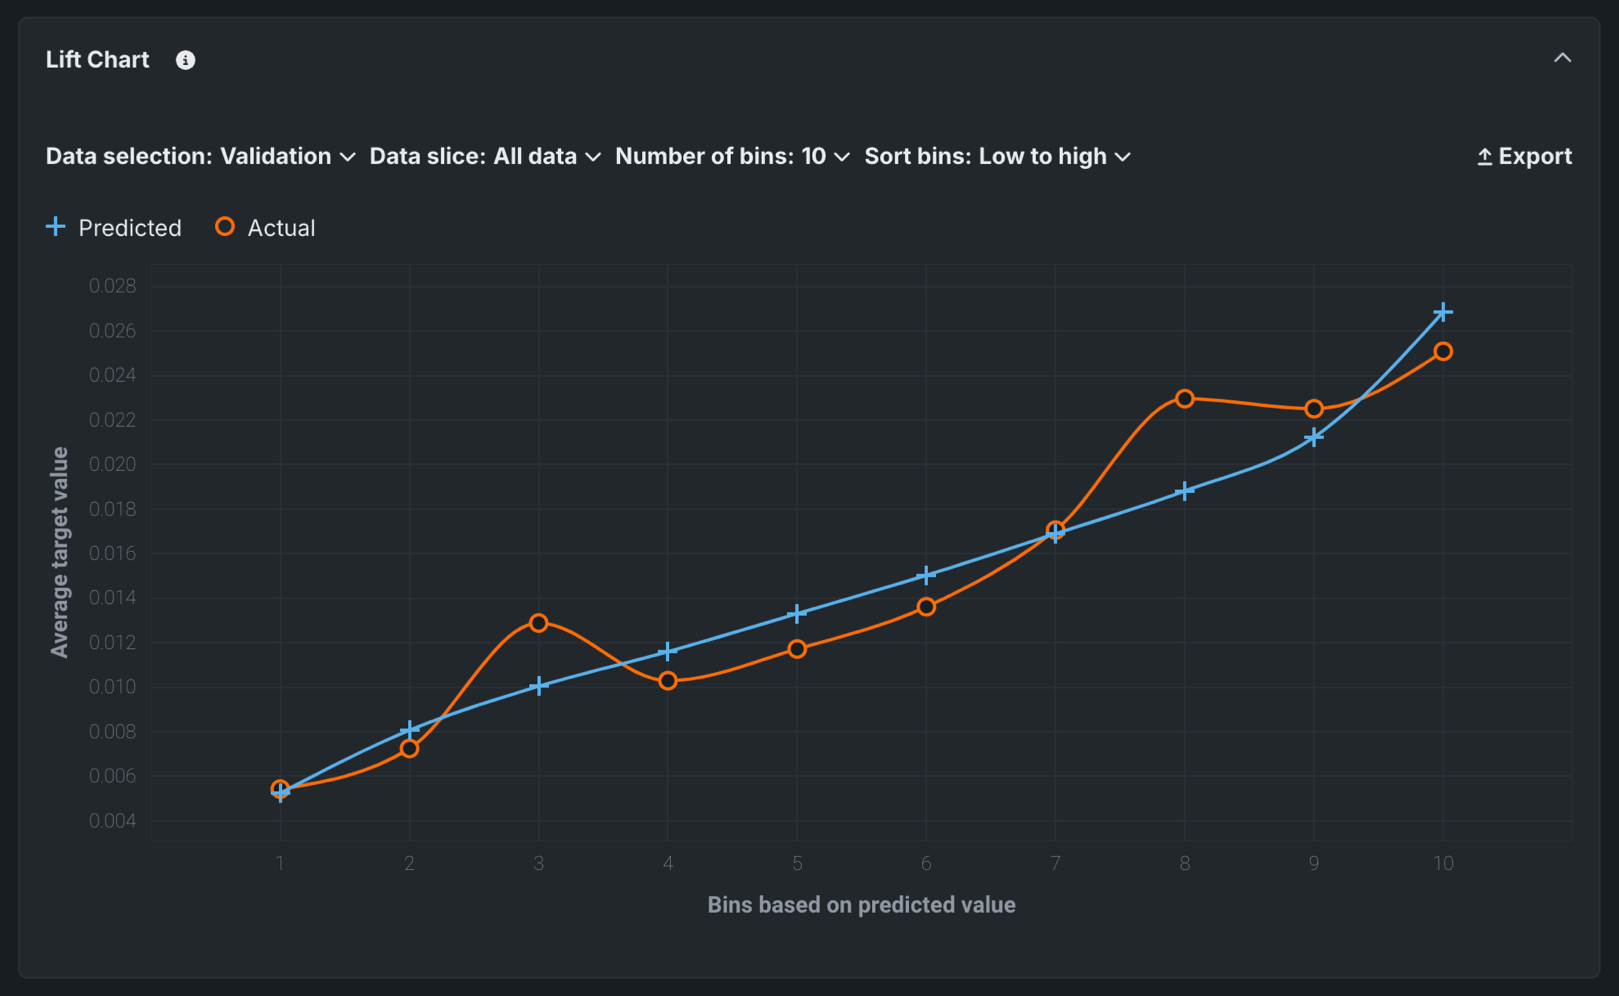
| Lift Chart | Depicts how well a model segments the target population and how capable it is of predicting the target. | All | ✔ |
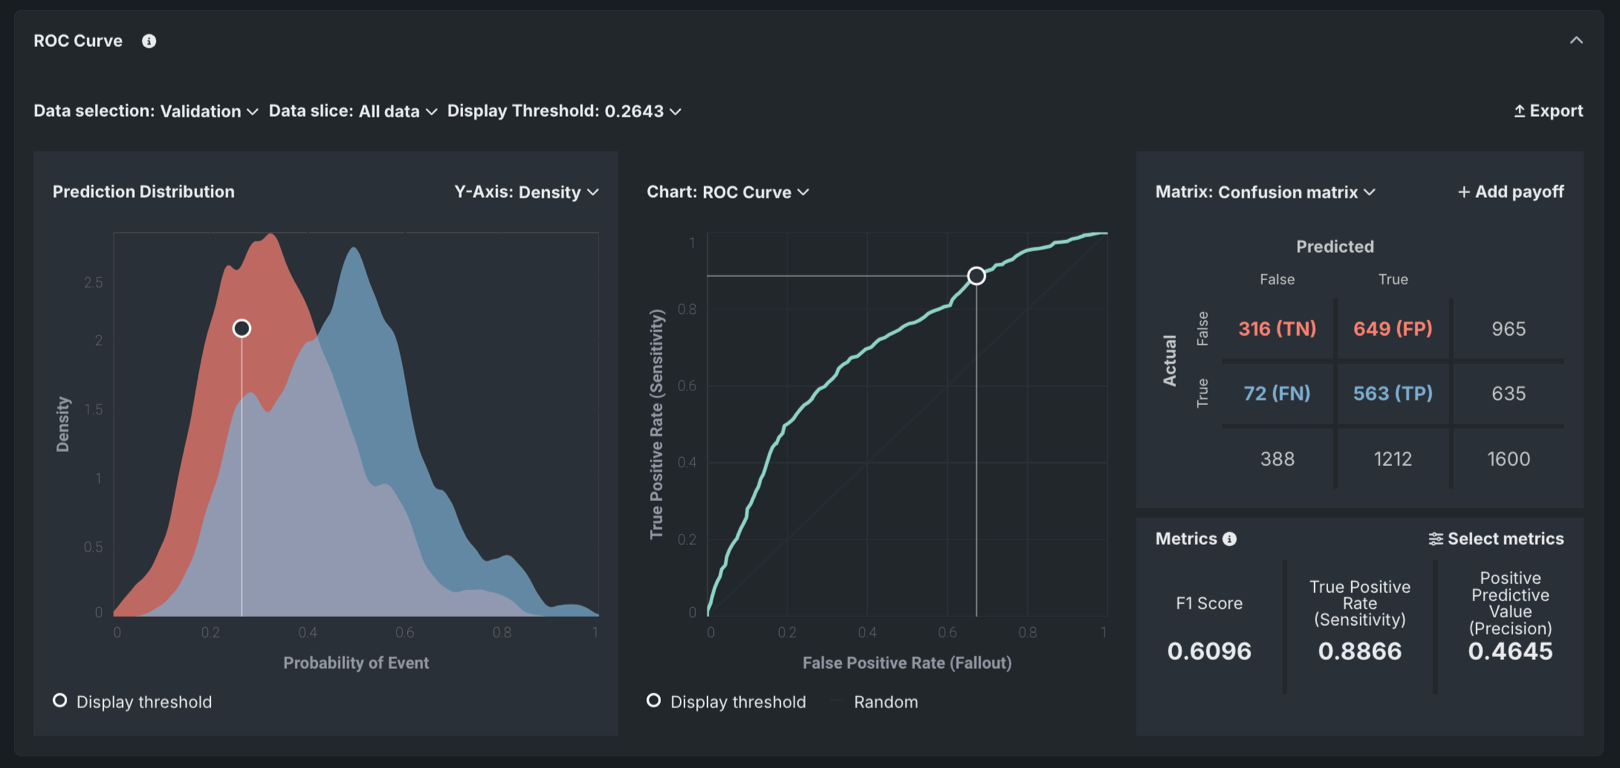
| ROC Curve | Provides tools for exploring classification, performance, and statistics related to a model. | Binary classification | ✔ |
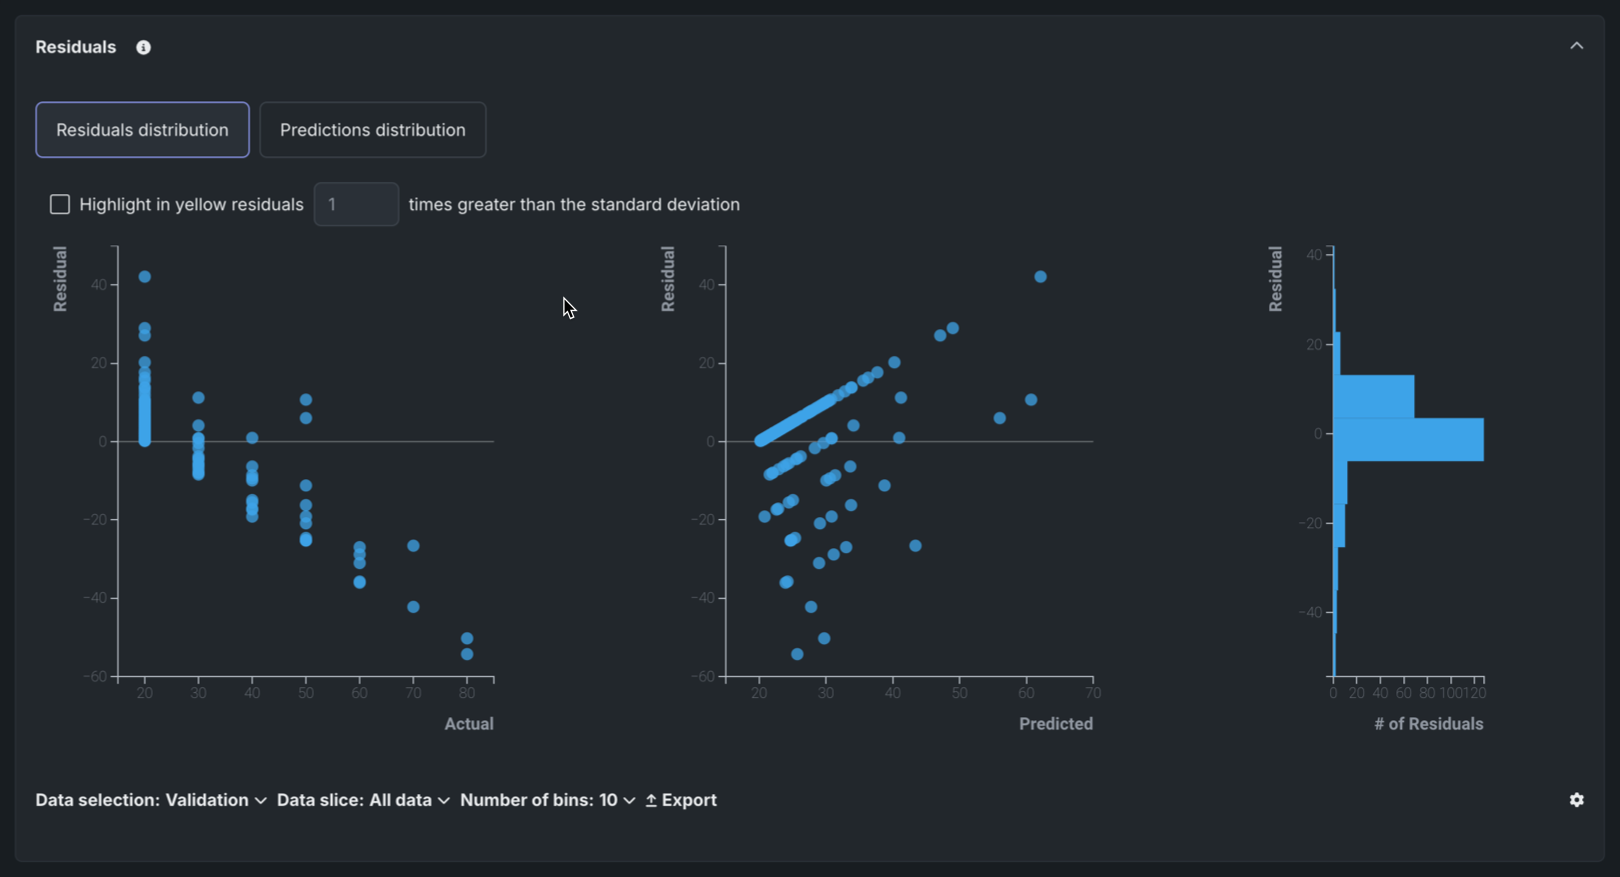
| Residuals | Provides scatter plots and a histogram for understanding model predictive performance and validity. | Regression | ✔ |
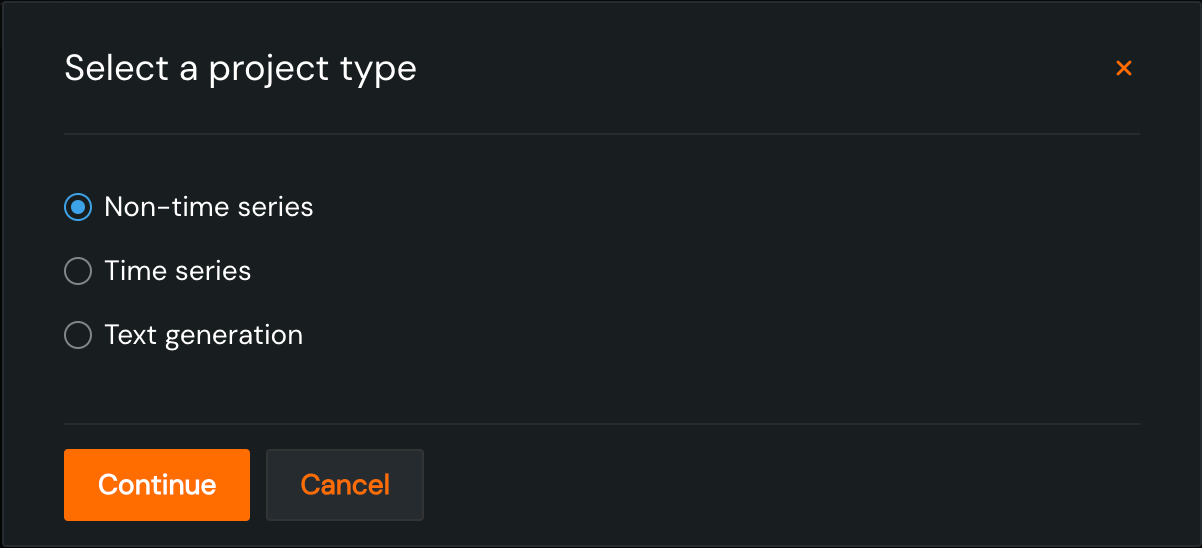
Compliance documentation template support for text generation projects
With this release, users with template administrator permissions can build compliance documentation templates for text generation projects:
For more information, see Generate compliance documentation and Template Builder for compliance reports.
Bolt-on Governance API integration for custom models
The chat function, available when assembling a structured custom model, allows text generation custom models to implement the Bolt-on Governance API, enabling streaming responses and providing chat history as context for the LLM. When using the Bolt-on Governance API with a deployed LLM blueprint, see LLM availability for the recommended values of the model parameter. Alternatively, specify a reserved value, model="datarobot-deployed-llm", to let the LLM blueprint select the relevant model ID automatically when calling the LLM provider's services.
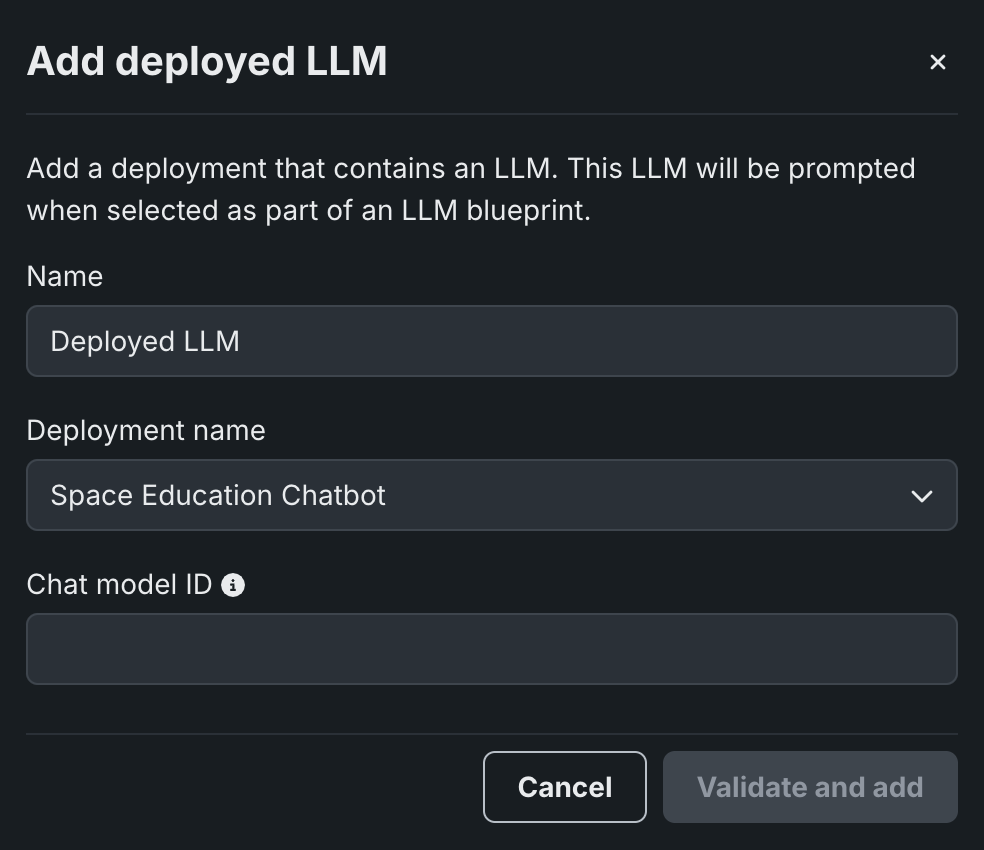
In Workbench, when adding a deployed LLM that implements the chat function, the playground uses the Bolt-on Governance API as the preferred communication method. Enter the Chat model ID associated with the LLM blueprint to set the model parameter for requests from the playground to the deployed LLM. Alternatively, enter datarobot-deployed-llm to let the LLM blueprint select the relevant model ID automatically when calling the LLM provider's services.
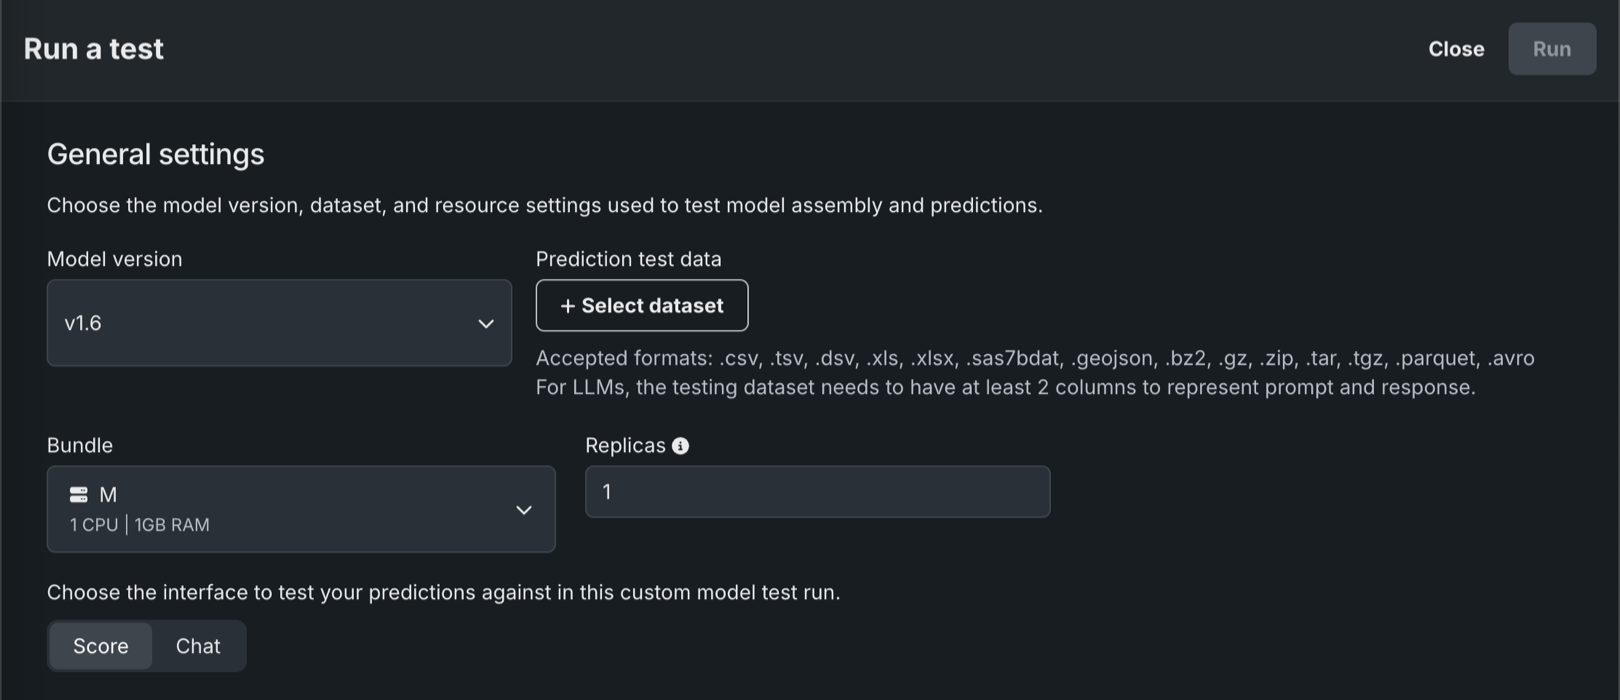
In Registry, the model workshop supports running tests using the Bolt-on Governance API. Text generation custom models can perform the startup test and either the prediction error test (Prediction API) or the chat error test (Bolt-on Governance API).
For more information, see the documentation, considerations and an example notebook.
Security-hardened custom model drop-in environments
Starting with the March 2025 Managed AI Platform release, most general purpose DataRobot custom model drop-in environments are security-hardened container images. When you require a security-hardened environment for running custom jobs, only shell code following the POSIX-shell standard is supported. Security-hardened environments following the POSIX-shell standard support a limited set of shell utilities.
Execution environment GA improvements
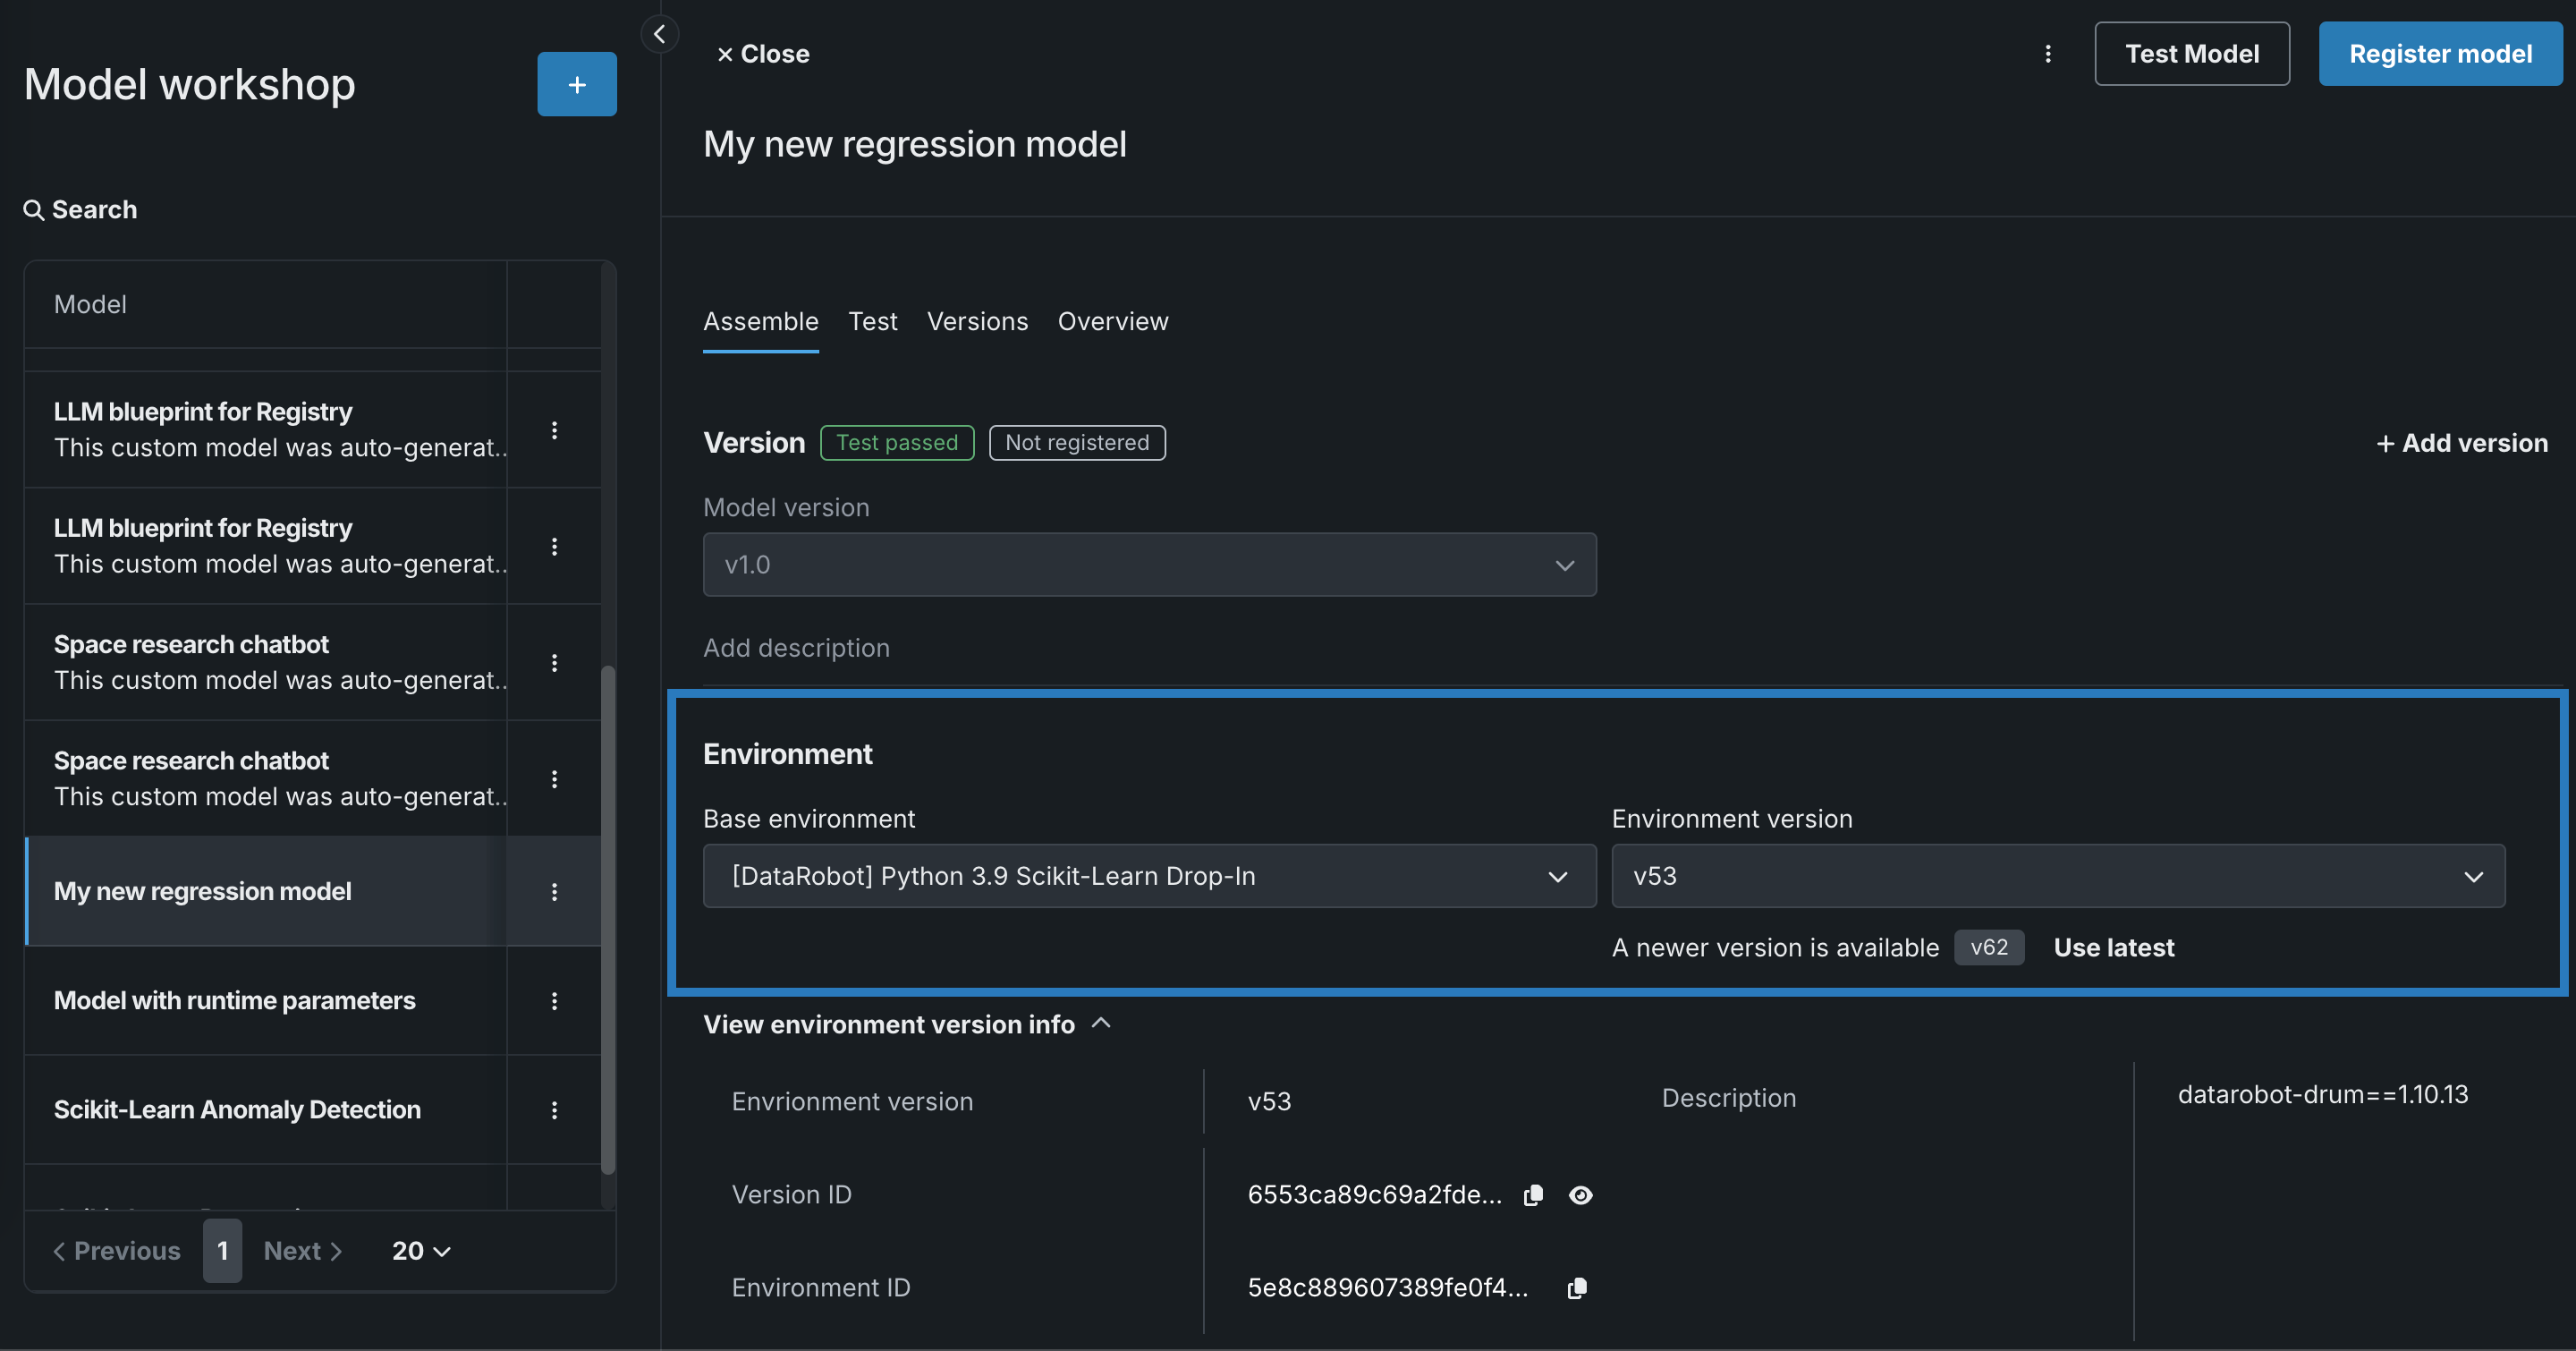
After you create a custom model and select an environment, you can manage the environment version to ensure it is up to date. For the model and version you want update, on the Assemble tab, navigate to the Environment section. In the Environment version menu, If a newer version of the environment is available, you can click Use latest to update the custom model to use the most recent version with a successful build:
In addition, you can click View environment version info to view the environment version, version ID, environment ID, and description:
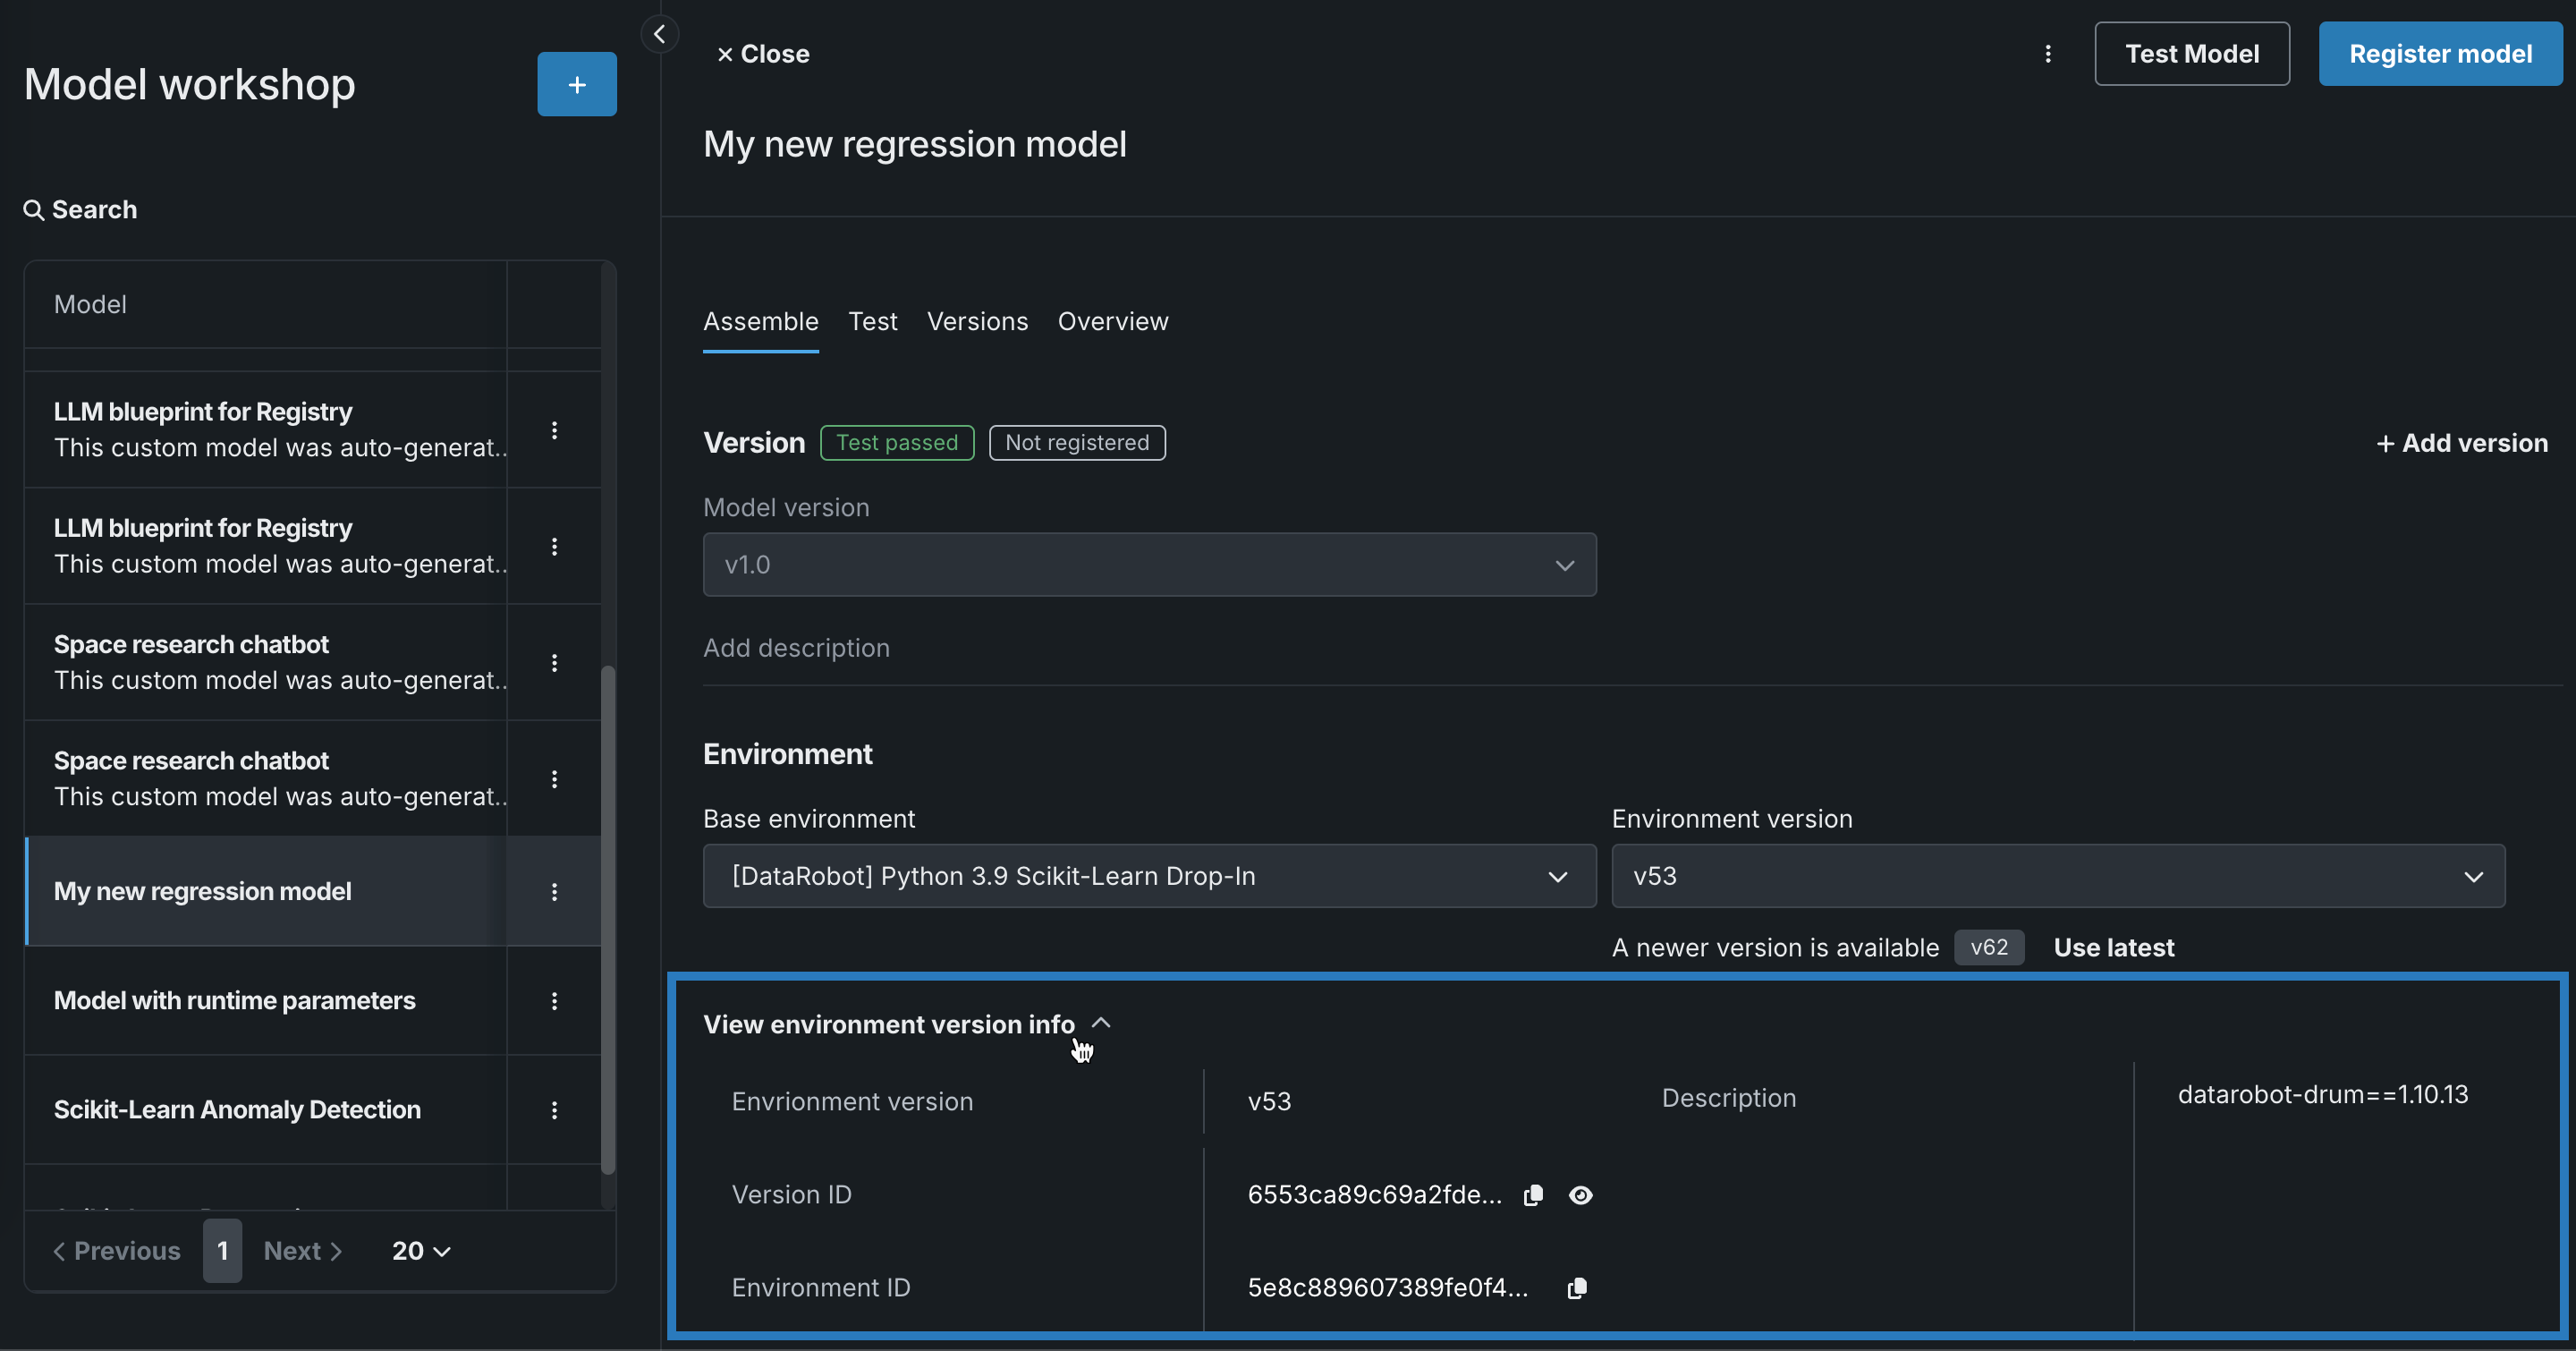
Custom environment version information is also available in the custom model’s version details.
Enable prediction warnings for a deployment
Enable prediction warnings for regression model deployments on the Humility > Prediction warnings tab. Prediction warnings allow you to mitigate risk and make models more robust by identifying when predictions do not match their expected result in production. This feature detects when deployments produce predictions with outlier values, summarized in a report that returns with your predictions.

If you enable prediction warnings for a deployment, any anomalous prediction values that trigger a warning are flagged in the Predictions over time bar chart. The yellow section of the bar chart represents the anomalous predictions for a point in time. To view the number of anomalous predictions for a specific time period, hover over the point on the plot corresponding to the flagged predictions in the bar chart.

Deprecations and migrations
MLOps library requires Java 11 or higher
From March 2025 forward, the MLOps monitoring library must run on Java 11 or higher. This includes Scoring Code models instrumented for monitoring.
All product and company names are trademarks™ or registered® trademarks of their respective holders. Use of them does not imply any affiliation with or endorsement by them.