September 2022
September 27, 2022
DataRobot's managed AI Platform deployment for September delivered the following new GA and preview features. See the this month's release notes as well as a deployment history for additional past feature announcements. See also:
Features grouped by capability
| Name | GA | Preview |
|---|---|---|
| Data and integrations | ||
| Feature cache for Feature Discovery deployments | ✔ | |
| Modeling | ||
| ROC Curve enhancements aid model interpretation | ✔ | |
| Create Time Series What-if AI Apps | ✔ | |
| Time series | ||
| Accuracy Over Time enhancements | ✔ | |
| Time series clustering now GA | ✔ | |
| Predictions and MLOps | ||
| Drift Over Time chart | ✔ | |
| Deployment for time series segmented modeling | ✔ | |
| Large-scale monitoring with the MLOps library | ✔ | |
| Batch prediction job history for challengers | ✔ | |
| Time series model package prediction intervals | ✔ | |
| Documentation changes | ||
| Documentation change summary | ✔ | |
| API enhancements | ||
| Python client v3.0 | ✔ | |
| Python client v3.0 new features | ✔ | |
| New methods for DataRobot projects | ✔ | |
| Calculate Feature Impact for each backtest | ✔ | |
Features grouped by capability
| Name | GA | Preview |
|---|---|---|
| Data and integrations | ||
| Feature cache for Feature Discovery deployments | ✔ | |
| Modeling | ||
| ROC Curve enhancements aid model interpretation | ✔ | |
| Create Time Series What-if AI Apps | ✔ | |
| Create No-Code AI Apps from Feature Discovery projects | ✔ | |
| Time series | ||
| Accuracy Over Time enhancements | ✔ | |
| Time series clustering now GA | ✔ | |
| Predictions and MLOps | ||
| Drift Over Time chart | ✔ | |
| Deployment for time series segmented modeling | ✔ | |
| Large-scale monitoring with the MLOps library | ✔ | |
| Batch prediction job history for challengers | ✔ | |
| Time series model package prediction intervals | ✔ | |
| Documentation changes | ||
| Documentation change summary | ✔ | |
| API enhancements | ||
| Python client v3.0 | ✔ | |
| Python client v3.0 new features | ✔ | |
| New methods for DataRobot projects | ✔ | |
| Calculate Feature Impact for each backtest | ✔ | |
GA
ROC Curve enhancements aid model interpretation
With this release, the ROC Curve tab introduces several improvements to help increase understanding of model performance at any point on the probability scale. Using the visualization now, you will notice:
- Row and column totals are shown in the Confusion Matrix.
- The Metrics section now displays up to six accuracy metrics.
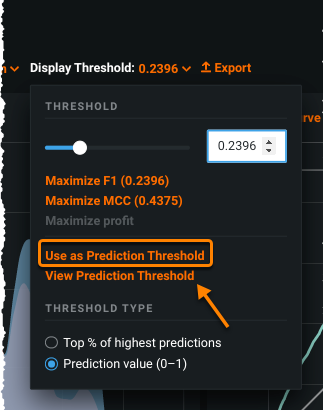
- You can use Display Threshold > View Prediction Threshold to reset the visualization components (graphs and charts) to the model's default prediction threshold.
Create Time Series What-if AI Apps
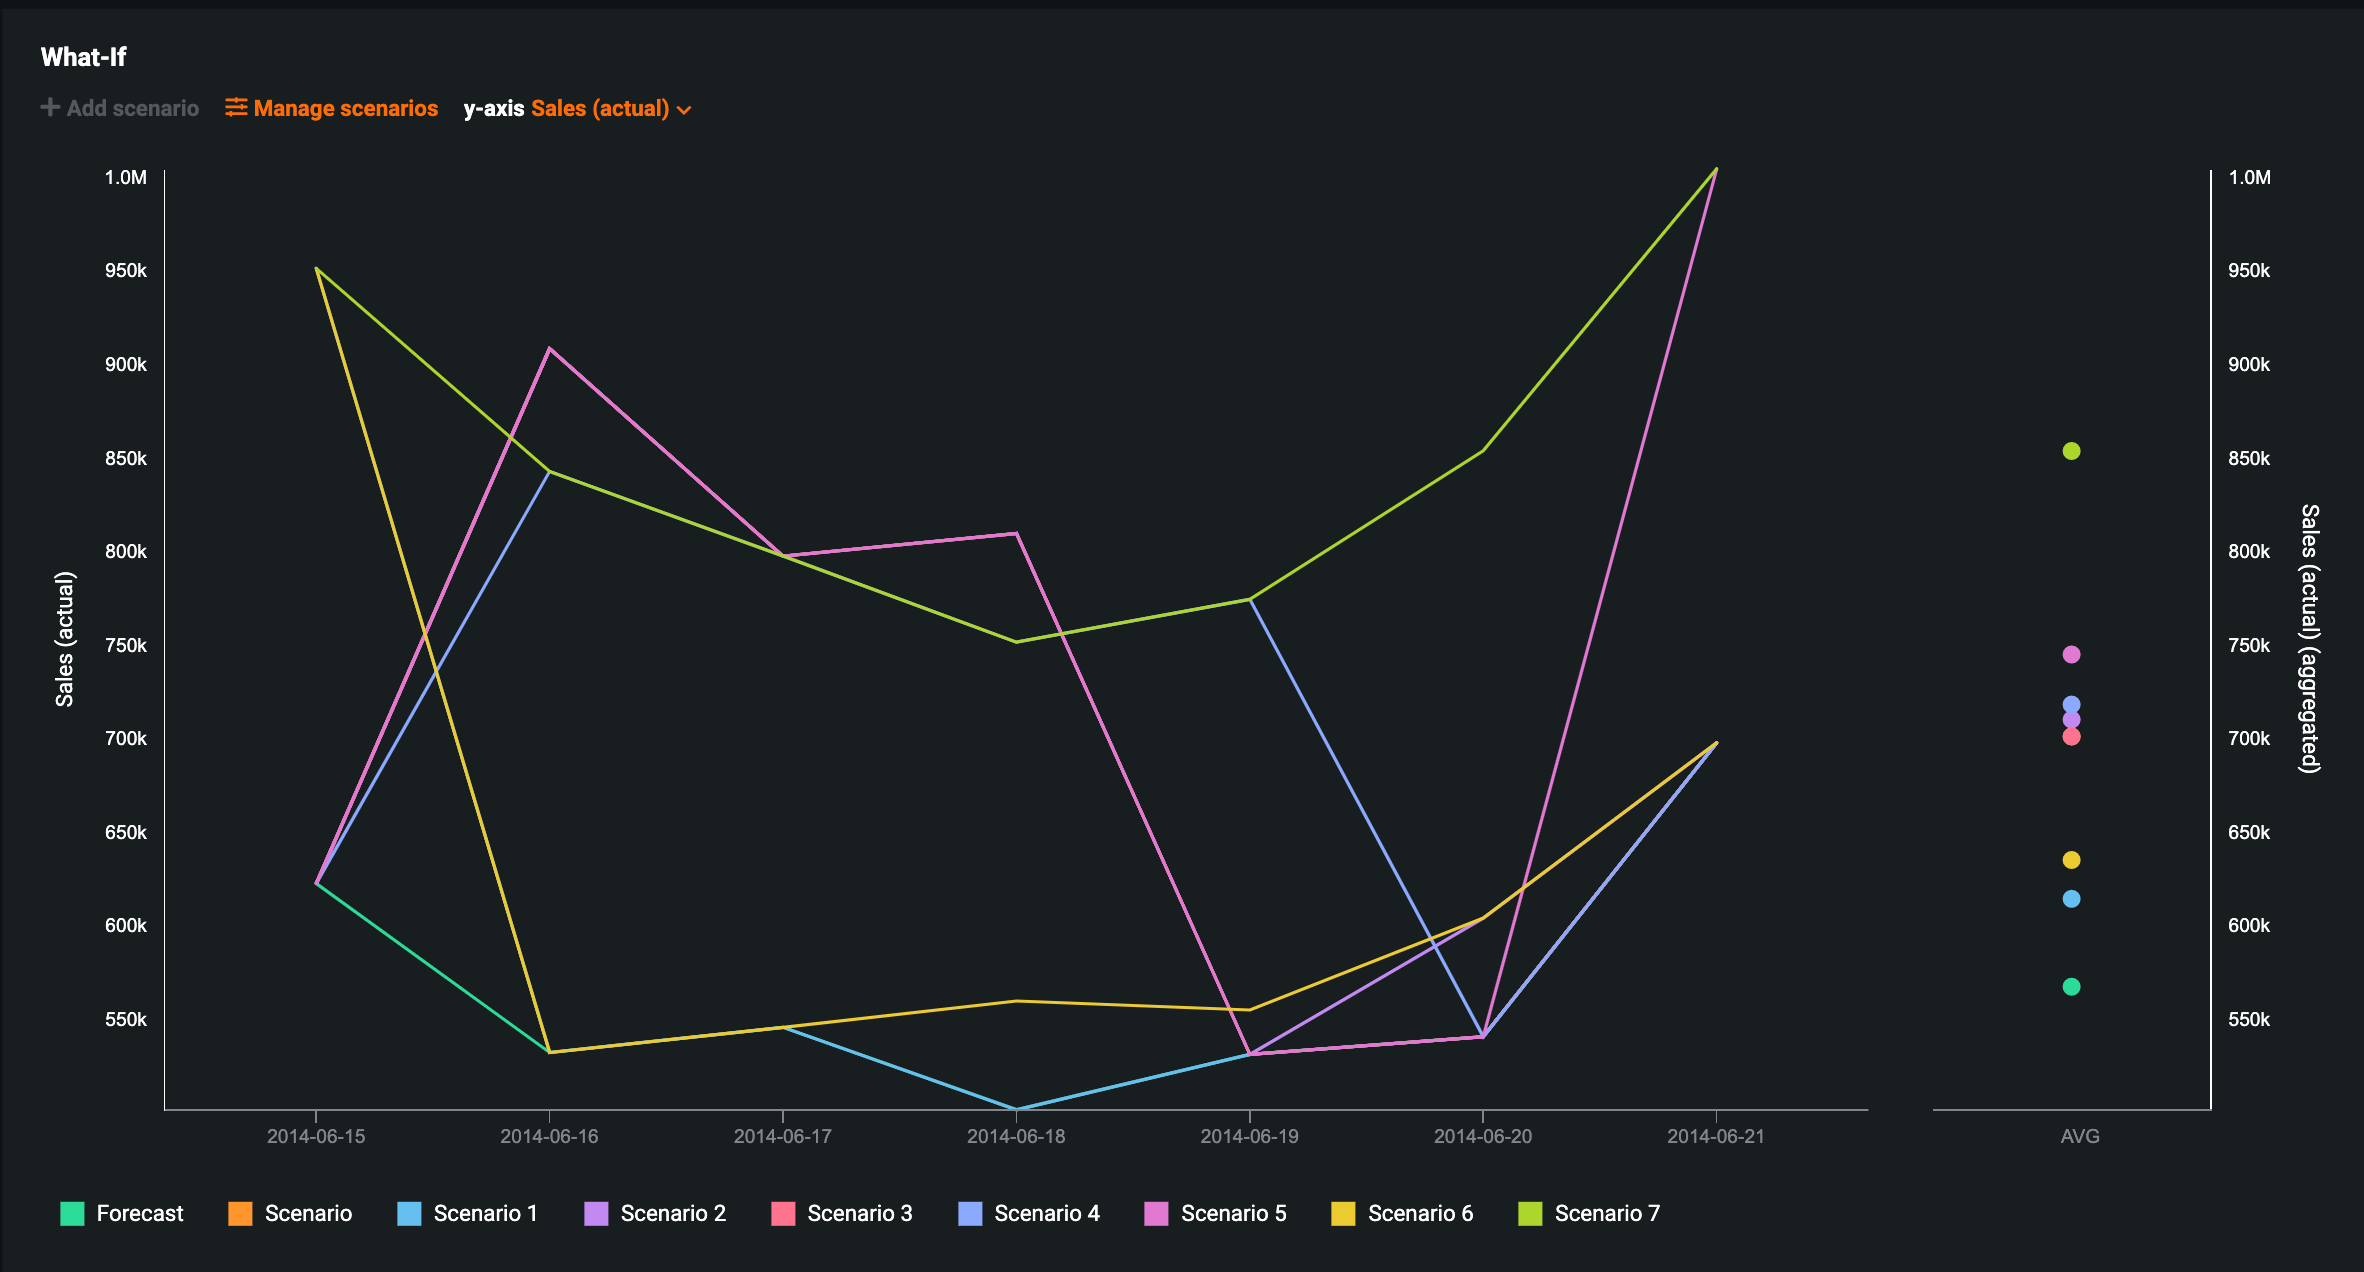
Now generally available, you can create What-if Scenario AI Apps from time series projects. This allows you to launch and easily configure applications in an enhanced visual and interactive interface, as well as share your What-if Scenario app with consumers who will be able to effortlessly build upon what’s already been generated by the builder and/or create their own scenarios on the same prediction files.
Additionally, you can edit the known in advance features for multiple scenarios at once using the Manage Scenarios feature.
For more information, see the Time series applications documentation.
Accuracy Over Time enhancements
Because multiseries modeling supports up to 1 million series and 1000 forecast distances, previously, DataRobot limited the number of series in which the accuracy calculations were performed as part of Autopilot. Now, the visualizations that use these calculations can automatically run a number of series (up to a certain threshold) and then run additional series, either individually or in bulk.
The visualizations that can leverage this functionality are:
- Accuracy Over Time
- Anomaly Over Time
- Forecast vs. Actual
- Model Comparison
For more information, see the Accuracy Over Time for multiseries documentation.
Time series clustering now GA
Time series clustering enables you to easily group similar series across a multiseries dataset from within the DataRobot platform. Use the discovered clusters to get a better understanding of your data or use them as input to time series segmented modeling. The general availability of clustering brings some improvements over the preview version:
-
A new Series Insights tab specifically for clustering provides information on series/cluster relationships and details.
-
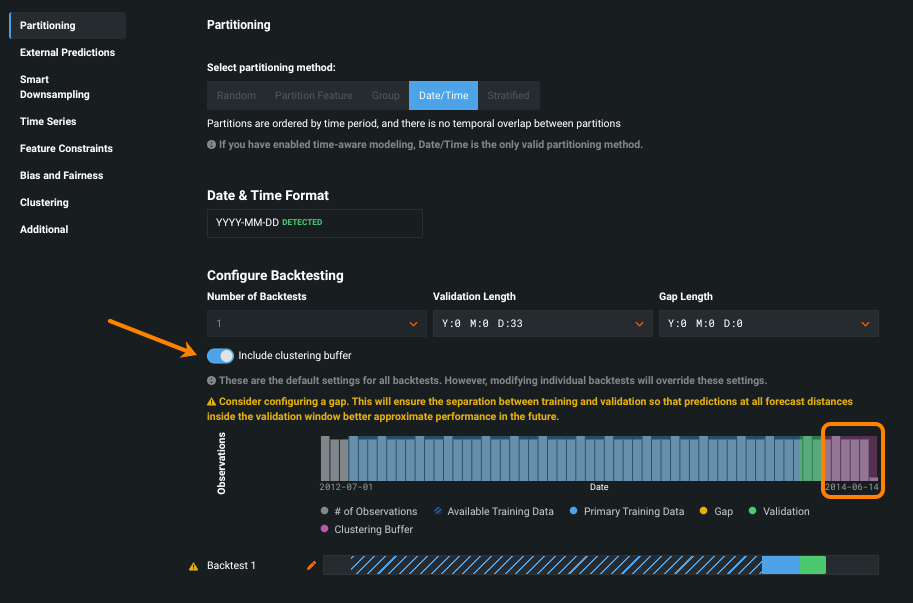
A cluster buffer prevents data leakage and ensures that you are not training a clustering model into what will be the holdout partition in segmentation.
Drift Over Time chart
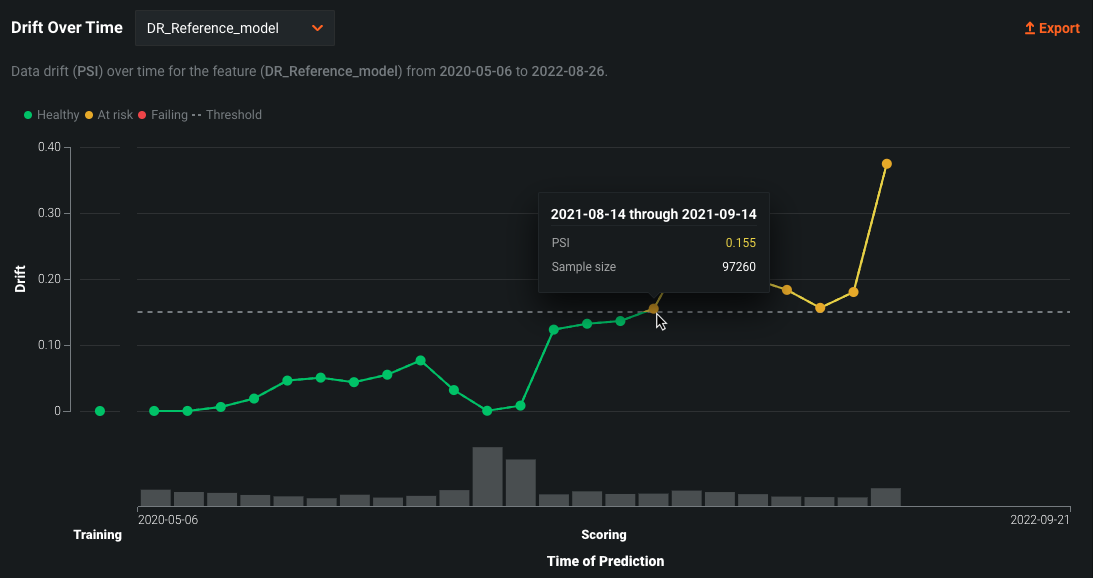
On a deployment’s Data Drift dashboard, the Drift Over Time chart visualizes the difference in distribution over time between the training dataset of the deployed model and the datasets used to generate predictions in production. The drift away from the baseline established with the training dataset is measured using the Population Stability Index (PSI). As a model continues to make predictions on new data, the change in the PSI over time is visualized for each tracked feature, allowing you to identify data drift trends:
As data drift can decrease your model's predictive power, determining when a feature started drifting and monitoring how that drift changes (as your model continues to make predictions on new data) can help you estimate the severity of the issue. You can then compare data drift trends across the features in a deployment to identify correlated drift trends between specific features. In addition, the chart can help you identify seasonal effects (significant for time-aware models). This information can help you identify the cause of data drift in your deployed model, including data quality issues, changes in feature composition, or changes in the context of the target variable. The example below shows the PSI consistently increasing over time, indicating worsening data drift for the selected feature.
For more information, see the Drift Over Time chart documentation.
Deployment for time series segmented modeling
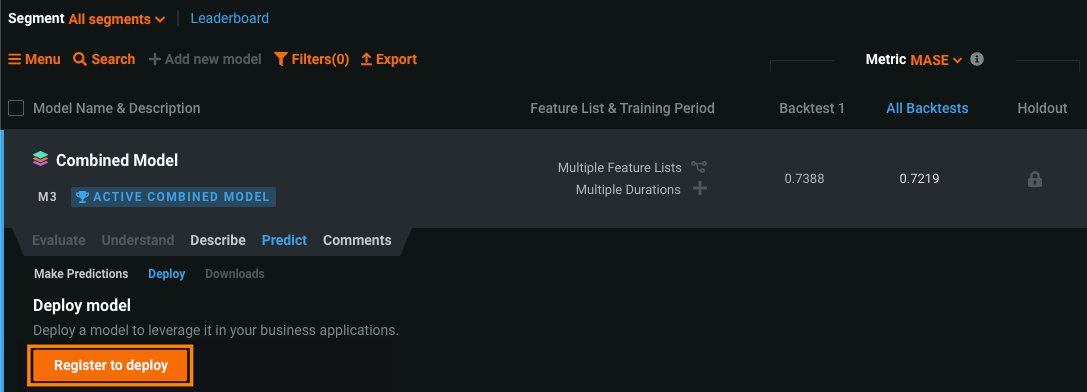
To fully leverage the value of segmented modeling, you can deploy Combined Models like any other time series model. After selecting the champion model for each included project, you can deploy the Combined Model to create a "one-model" deployment for multiple segments; however, the individual segments in the deployed Combined Model still have their own segment champion models running in the deployment behind the scenes. Creating a deployment allows you to use DataRobot MLOps for accuracy monitoring, prediction intervals, challenger models, and retraining.
Note
Time series segmented modeling deployments do not support data drift monitoring or prediction explanations.
After you complete the segmented modeling workflow and Autopilot has finished, the Model tab contains one model. This model is the completed Combined Model. To deploy, click the Combined Model, click Predict > Deploy, and then click Deploy model.
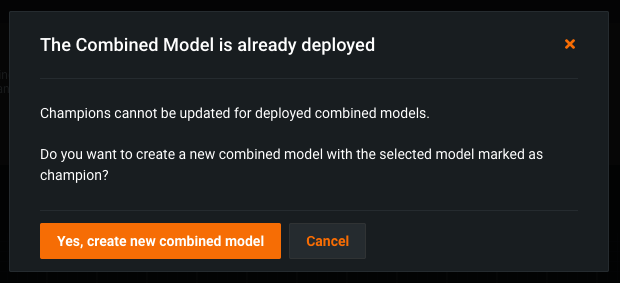
After deploying a Combined Model, you can change the segment champion for a segment by cloning the deployed Combined Model and modifying the cloned model. This process is automatic and occurs when you attempt to change a segment's champion within a deployed Combined Model. The cloned model you can modify becomes the Active Combined Model. This process ensures stability in the deployed model while allowing you to test changes within the same segmented project.
Note
Only one Combined Model on a project's Leaderboard can be the Active Combined Model (marked with a badge)
Once a Combined Model is deployed, it is labeled Prediction API Enabled. To modify this model, click the active and deployed Combined Model, and then in the Segments tab, click the segment you want to modify.
Next, reassign the segment champion, and in the dialog box that appears, click Yes, create new combined model.
On the segment's Leaderboard, you can now access and modify the Active Combined Model.
For more information, see the Deploy a Combined Model documentation.
Large-scale monitoring with the MLOps library
To support large-scale monitoring, the MLOps library provides a way to calculate statistics from raw data on the client side. Then, instead of reporting raw features and predictions to the DataRobot MLOps service, the client can report anonymized statistics without the feature and prediction data. Reporting prediction data statistics calculated on the client side is the optimal (and highly performant) method compared to reporting raw data, especially at scale (billions of rows of features and predictions). In addition, because client-side aggregation only sends aggregates of feature values, it is suitable for environments where you don't want to disclose the actual feature values.
Previously, this functionality was released for the Java SDK and MLOps Spark Utils Library. With this release, large-scale monitoring functionality is now available for Python:
To use large-scale monitoring in your Python code, replace calls to report_predictions_data() with calls to:
report_aggregated_predictions_data(
    self,
    features_df,
    predictions,
    class_names,
    deployment_id,
    model_id
)
To enable the large-scale monitoring functionality, you must set one of the feature type settings. These settings provide the dataset's feature types and can be configured programmatically in your code (using setters) or by defining environment variables.
For more information, see the Enable large-scale monitoring use case.
Batch prediction job history for challengers
To improve error surfacing and usability for challenger models, you can now access a challenger's prediction job history from the Deployments > Challengers tab. After adding one or more challenger models and replaying predictions, click Job History:
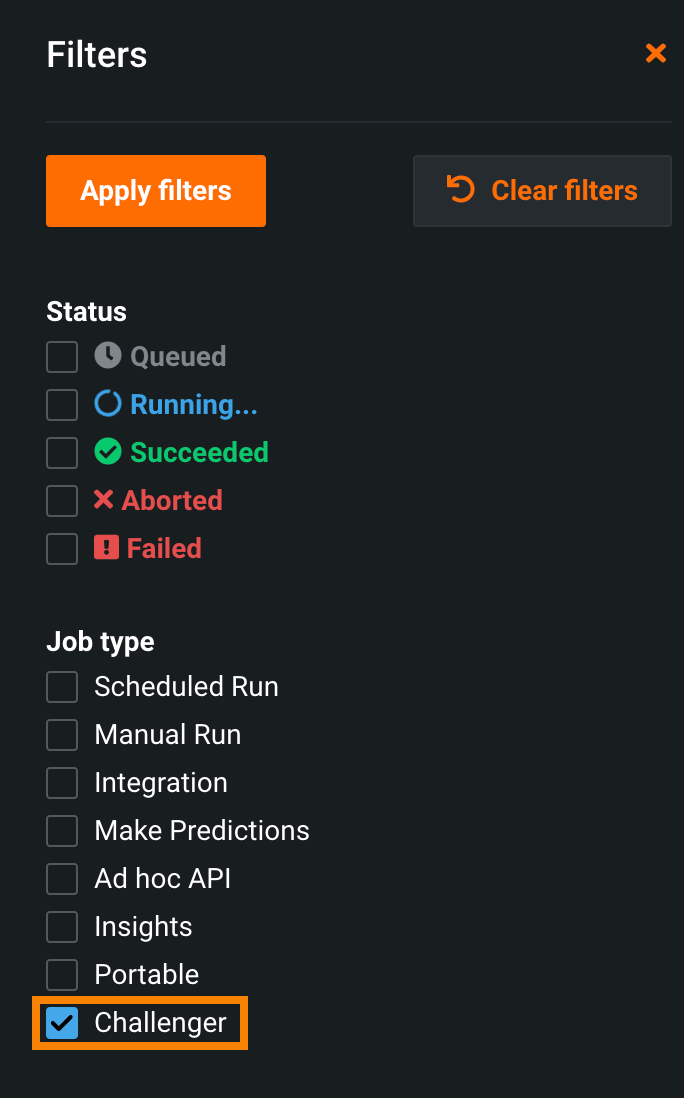
The Deployments > Prediction Jobs page opens and is filtered to display the challenger jobs for the deployment you accessed the job history from. You can also apply this filter directly from the Prediction Jobs page:
For more information, see the View challenger job history documentation.
Documentation change summary
This release brings the following improvements to the in-app and public-facing documentation:
-
Time series docs enhancement: A section on advanced modeling helps to understand how to make determinations of the best window and backtest settings for those planning to change the default settings in a time series project. Additionally, with a slight reorganization of the material, each step in the modeling process now has its own page with stage-specific instruction.
-
Learn more section added: A Learn more section has been added to the top-level navigation of the user documentation. From there, you can access the DataRobot Glossary, ELI5, and Tutorials. Additionally, the Release section has also been moved out of UI Docs and added to the top-level navigation, making it easier to access release materials.
-
Price elasticity use case: The API user guide now includes a price elasticity of demand use case, which helps you to understand the impact that changes in price will have on consumer demand for a given product. Follow the workflow in the use case’s notebook to understand how to identify relationships between price and demand, maximize revenue by properly pricing products, monitor price elasticities for changes in price and demand, and reduce manual processes used to obtain and update price elasticities.
Preview
Time series model package prediction intervals
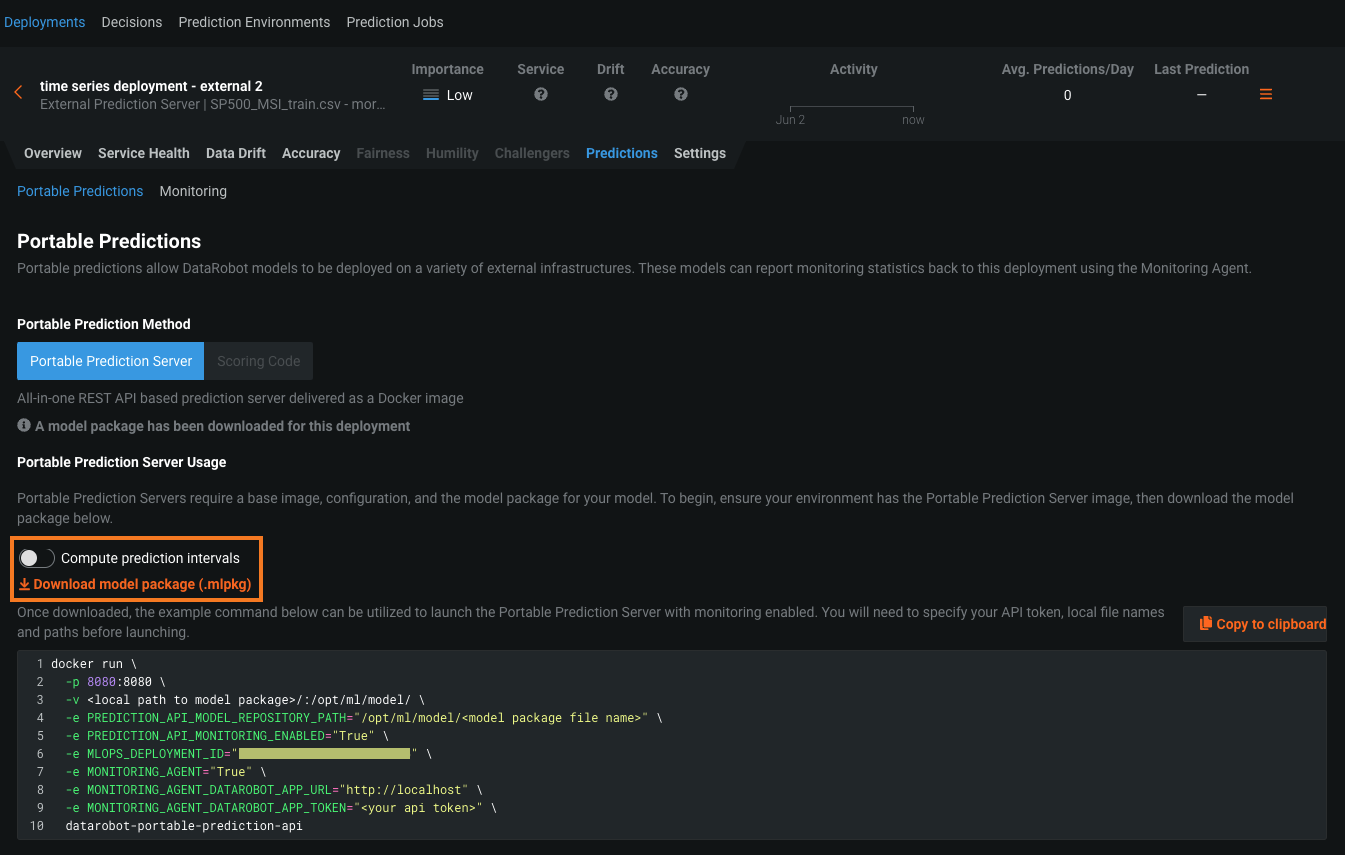
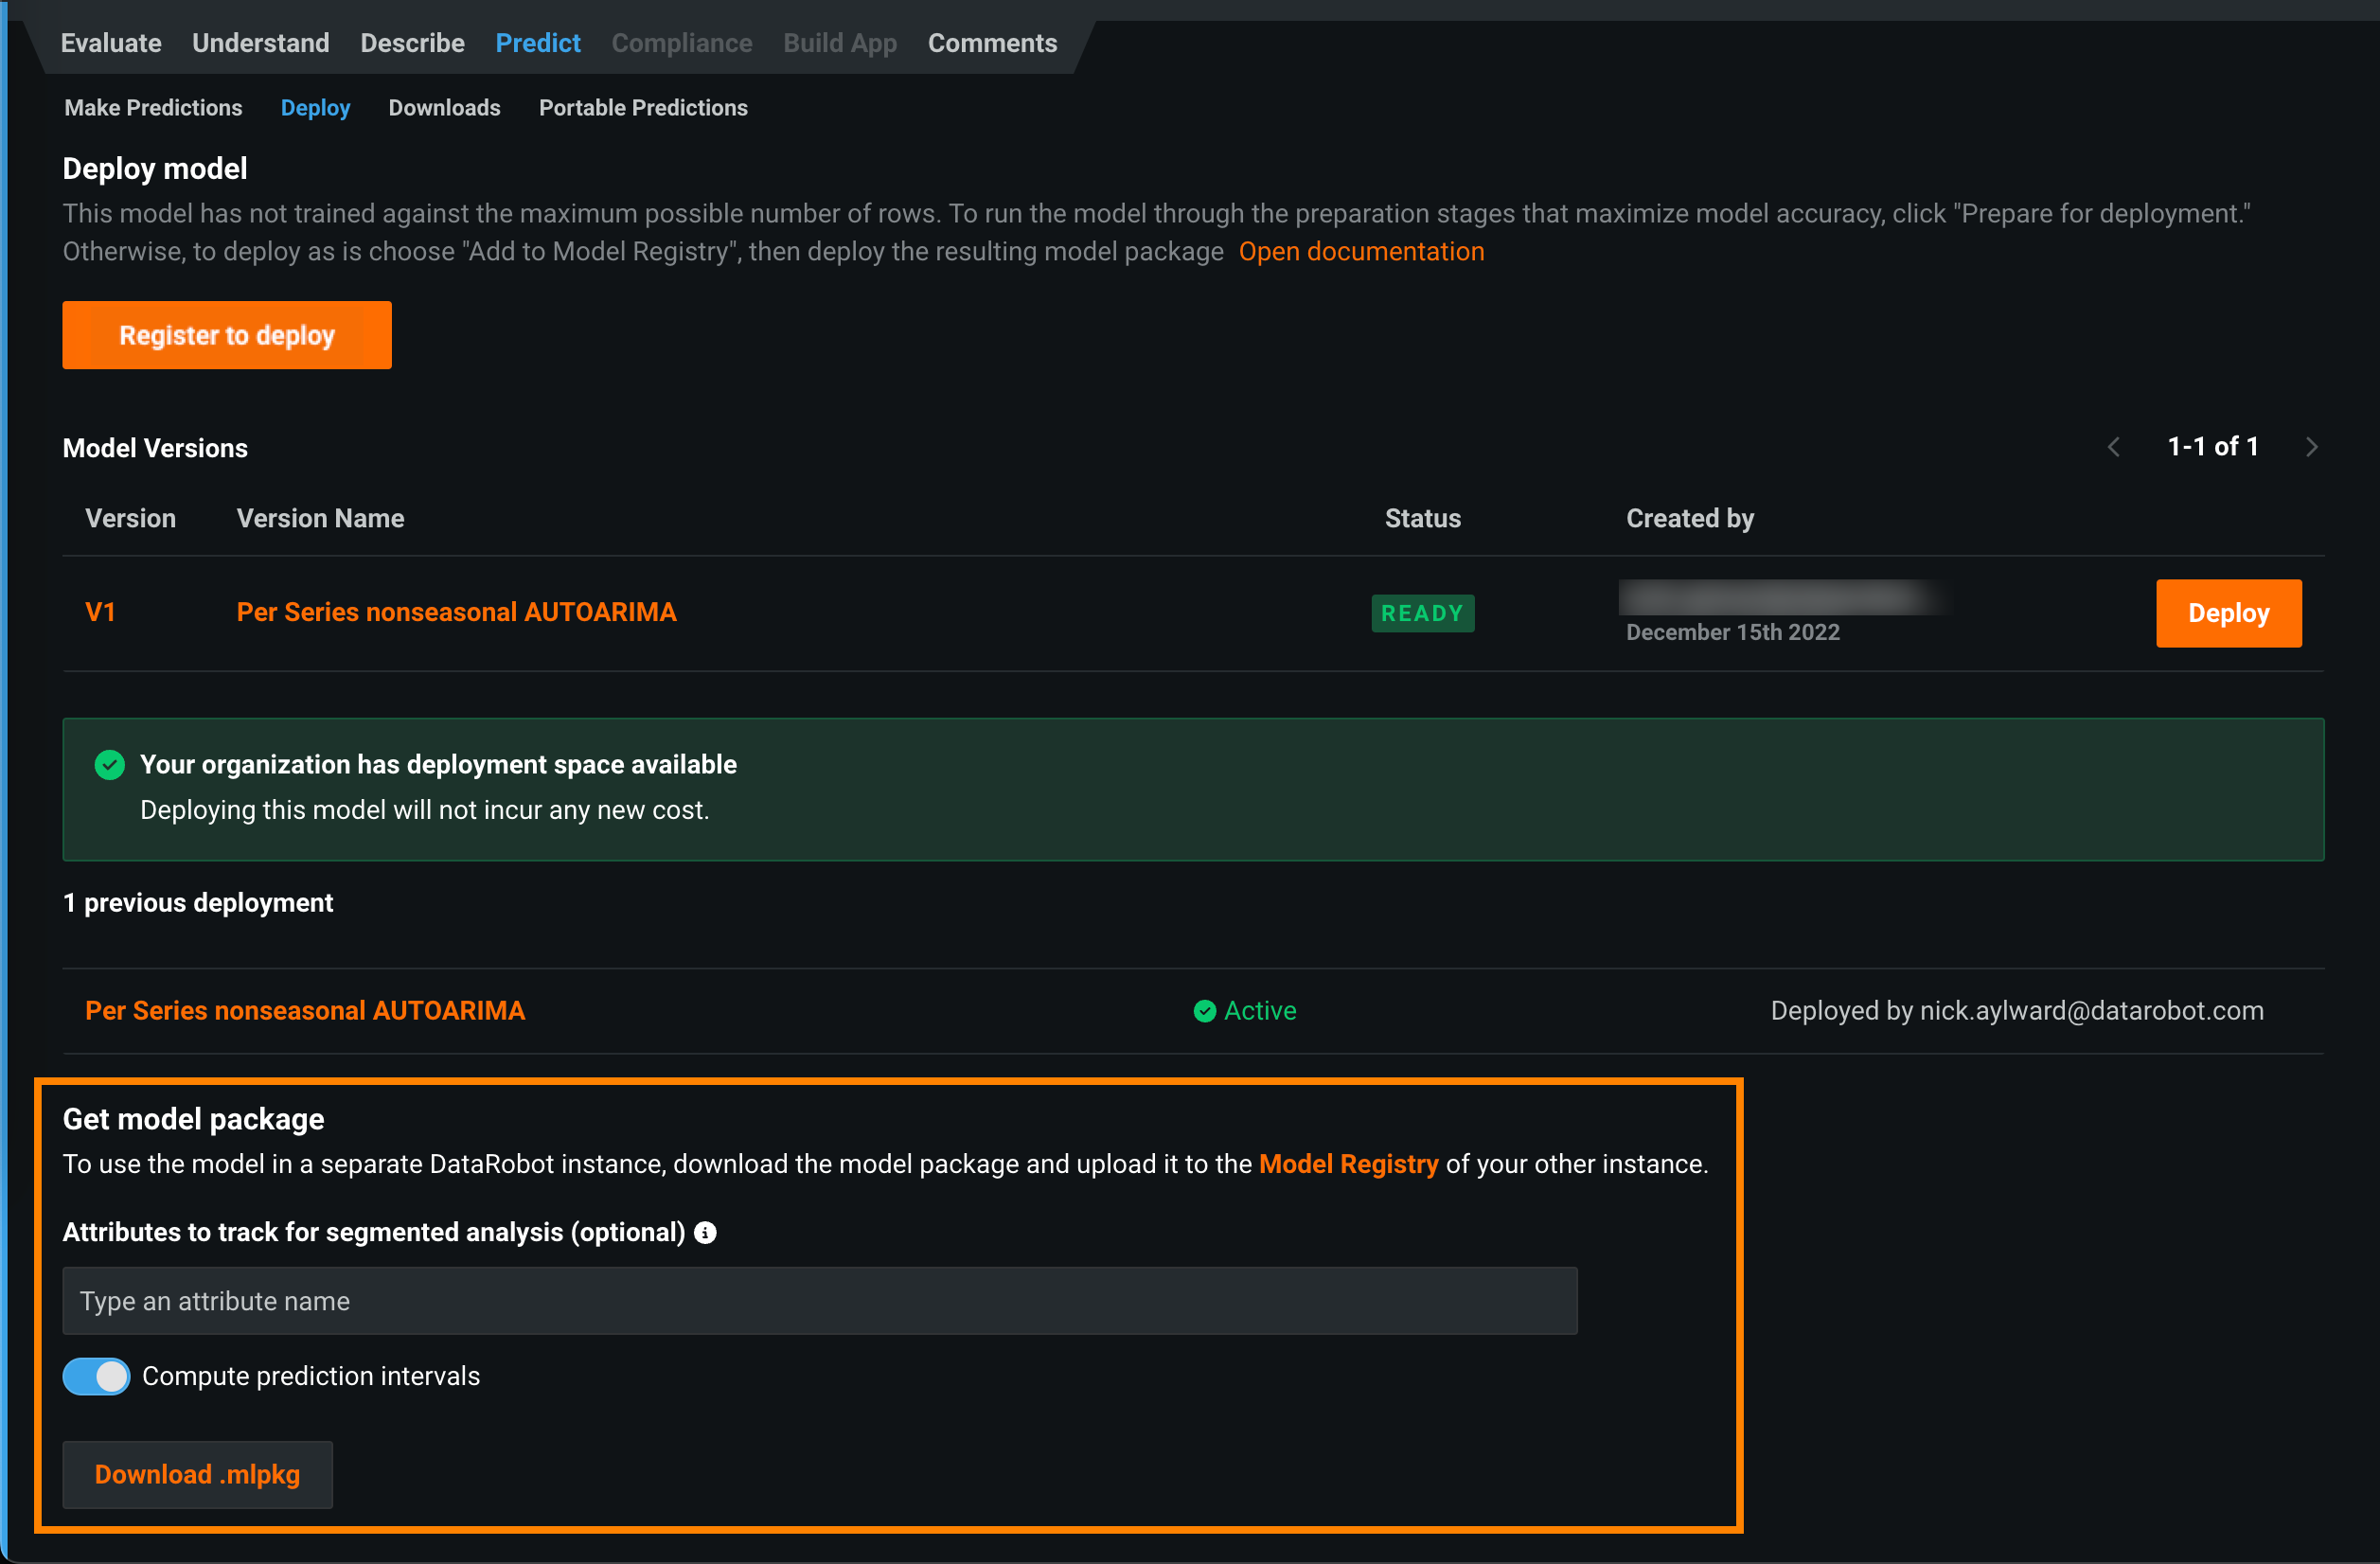
Now available for preview, you can enable the computation of a model's time series prediction intervals (from 1 to 100) during model package generation. To run a DataRobot time series model in a remote prediction environment, you download a model package (.mlpkg file) from the model's deployment or the Leaderboard. In both locations, you can now choose to Compute prediction intervals during model package generation. You can then run prediction jobs with a portable prediction server (PPS) outside DataRobot.
Before you download a model package with prediction intervals from a deployment, ensure that your deployment supports model package downloads. The deployment must have a DataRobot build environment and an external prediction environment, which you can verify using the Governance Lens in the deployment inventory:
To download a model package with prediction intervals from a deployment, in the external deployment, you can use the Predictions > Portable Predictions tab:
To download a model package with prediction intervals from a model in the Leaderboard, you can use the Predict > Deploy or Predict > Portable Predictions tab.
For more information, see the documentation.
Create No-Code AI Apps from Feature Discovery projects
SaaS users only. Now available for preview, you can create No-Code AI Apps from Feature Discovery projects (i.e., projects built with multiple datasets) with feature cache enabled. Feature cache instructs DataRobot to source data from multiple datasets and generate new features in advance, storing this information in a "cache," which is then drawn from to make predictions.
Required feature flags:
- Enable Application Builder Feature Discovery Support
- Enable Feature Cache for Feature Discovery
Preview documentation.
Feature cache for Feature Discovery deployments
Now available for preview, you can schedule feature cache for Feature Discovery deployments, which instructs DataRobot to pre-compute and store features before making predictions. Generating these features in advance makes single-record, low-latency scoring possible for Feature Discovery projects.
To enable feature cache, go to the Settings tab of a Feature Discovery deployment. Then, turn on the Feature Cache toggle and choose a schedule for DataRobot to update cached features.
Once feature cache is enabled and configured in the deployment's settings, DataRobot caches features and stores them in a database. When new predictions are made, the primary dataset is sent to the prediction endpoint, which enriches the data from the cache and returns the prediction response. The feature cache is then periodically updated based on the specified schedule.
Required feature flag: Enable Feature Cache for Feature Discovery
Preview documentation.
API enhancements
The following is a summary of API new features and enhancements. Go to the API Documentation home for more information on each client.
Tip
DataRobot highly recommends updating to the latest API client for Python and R.
Python client v3.0
Now generally available, DataRobot has released version 3.0 of the Python client. This version introduces significant changes to common methods and usage of the client. Many prominent changes are listed below, but view the changelog for a complete list of changes introduced in version 3.0.
Python client v3.0 new features
A summary of some new features for version 3.0 are outlined below:
- Version 3.0 of the Python client does not support Python 3.6 and earlier versions. Version 3.0 currently supports Python 3.7+.
- The default Autopilot mode for the
project.start_autopilotmethod has changed toAUTOPILOT_MODE.QUICK. - Pass a file, file path, or DataFrame to a deployment to easily make batch predictions and return the results as a DataFrame using the new method
Deployment.predict_batch. - You can use a new method to retrieve the canonical URI for a project, model, deployment, or dataset:
Project.get_uriModel.get_uriDeployment.get_uriDataset.get_uri
New methods for DataRobot projects
Review the new methods available for datarobot.models.Project:
Project.get_optionsallows you to retrieve saved modeling options.Project.set_optionssavesAdvancedOptionsvalues for use in modeling.Project.analyze_and_modelinitiates Autopilot or data analysis using data that has been uploaded to DataRobot.Project.get_datasetretrieves the dataset used to create the project.Project.set_partitioning_methodcreates the correct Partition class for a regular project based on input arguments.Project.set_datetime_partitioningcreates the correct Partition class for a time series project.Project.get_top_modelreturns the highest scoring model for a metric of your choice.
Calculate Feature Impact for each backtest
Feature Impact provides a transparent overview of a model, especially in a model's compliance documentation. Time-dependent models trained on different backtests and holdout partitions can have different Feature Impact calculations for each backtest. Now generally available, you can calculate Feature Impact for each backtest using DataRobot's REST API, allowing you to inspect model stability over time by comparing Feature Impact scores from different backtests.
Deprecation announcements
API deprecations
Review the deprecations introduced in version 3.0:
Project.set_targethas been removed. UseProject.analyze_and_modelinstead.PredictJob.createhas been removed. UseModel.request_predictionsinstead.Model.get_leaderboard_ui_permalinkhas been removed. UseModel.get_uriinstead.Project.open_leaderboard_browserhas been removed. UseProject.open_in_browserinstead.ComplianceDocumentationhas been removed. UseAutomatedDocumentinstead.
DataRobot Prime models to be deprecated
DataRobot Prime, a method for creating a downloadable, derived model for use outside of the DataRobot application, will be removed in an upcoming release. It is being replaced with the new ability to export Python or Java code from Rulefit models using the Scoring Code capabilities. Rulefit models differ from Prime only in that they use raw data for their prediction target rather than predictions from a parent model. There is no change in the availability of Java Scoring Code for other blueprint types, and any existing Prime models will continue to function.
Automodel functionality to be removed
An upcoming release will bring the removal of the preview "Automodel" functionality. There is no impact to existing projects, but the feature will no longer be accessible from the product.
All product and company names are trademarks™ or registered® trademarks of their respective holders. Use of them does not imply any affiliation with or endorsement by them.
