AutoML (V7.2)
2021年9月13日
The DataRobot v7.2.0 release includes many new AutoML features and enhancements described in this section. See also the new features described in the time series (AutoTS) and MLOps release notes.
期限切れの古い機能に対するサポートの変更については、サポート終了に関する重要なお知らせをご覧ください。 このドキュメントでは、DataRobotの修正された問題についても説明します。
注目の新機能...
リリース7.2の主な新機能には以下が含まれます。
- Purpose-built AI applications with the AI App Builder
- Preview: External prediction insights
- Preview: Bias and Fairness monitoring for deployments
User interface enhancements
New login experience
This release introduces a new login experience for DataRobot platform application users. The new page is redesigned to convey the level of innovation and technical revolution this company and product are offering without affecting the existing log in workflow.

ROC曲線の再設計
The ROC Curve tab has been redesigned to streamline the model evaluation strategies you can perform. Along with the Prediction Distribution graph, ROC curve, confusion matrix, and a summary of metrics, you can now generate profit curves, precision-recall curves, and custom charts in the ROC Curve tab.
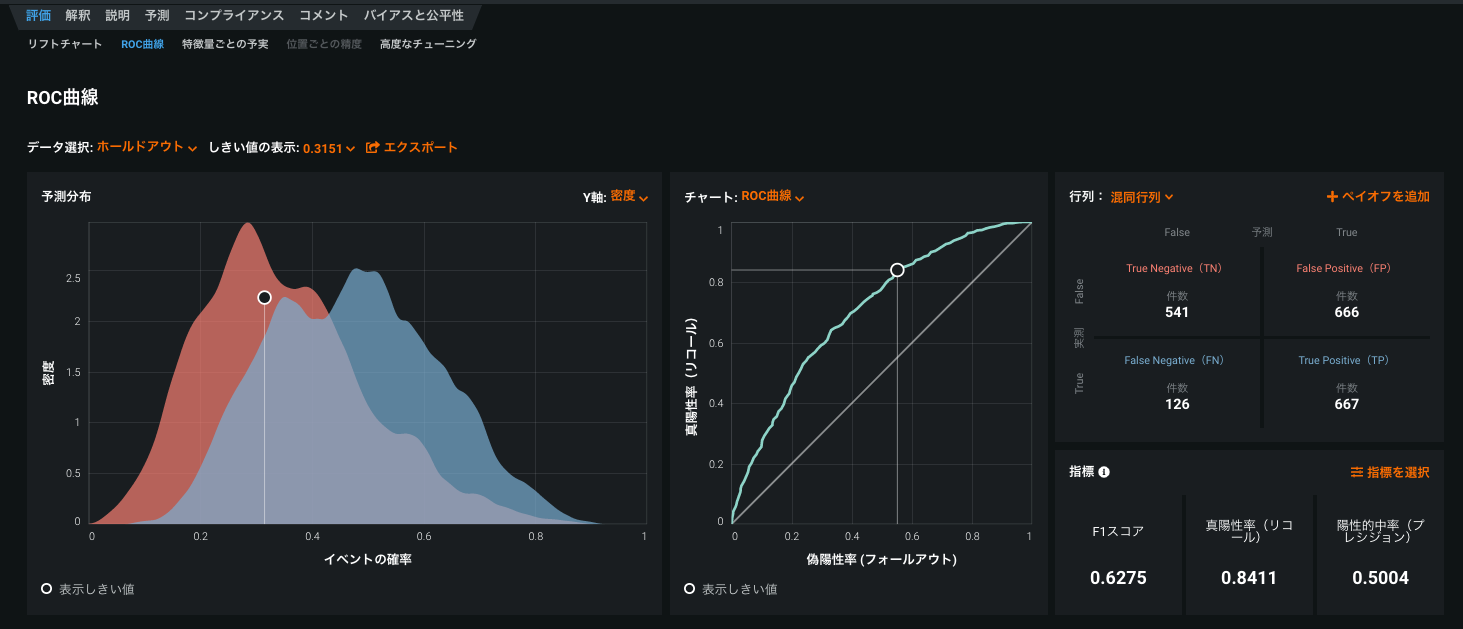
For details, see ROC Curve.
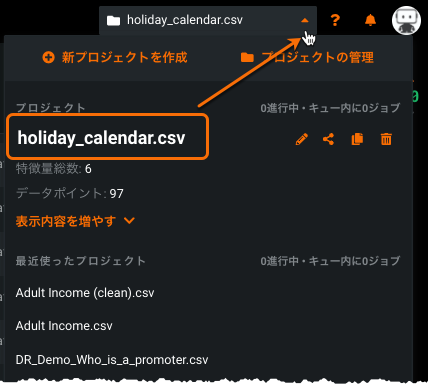
New location for tools to share and edit project names
To improve navigation, this release brings a new home for the project sharing and project name editing tools. While still available from the project control center (Manage Projects), you can now more quickly access the tools directly from the project dropdown.
データの強化
Spark SQL 3.4.1対応
Release 7.2 upgrades the Spark version used for Feature Discovery and Spark SQL to Spark 3.0. In addition to Spark performance improvements, the upgrade brings improved JDBC compatibility with the AI Catalog (which uses Java 11) and a smaller shippable codebase. DataRobot now supports all drivers that are compatible with any Java version 8 or later.
Connect to Snowflake and Google BigQuery using OAuth
SnowflakeおよびGoogle BigQueryのユーザーは、OAuthのシングルサインオンを使用してデータ接続を設定できます。 設定した後は、運用データベースからデータを読み取ってモデル構築と予測に使用することができます。 For details, see Data connection with OAuth.
Feature Discovery features
Feature Discovery Relationship Editor setup guide
With Feature Discovery, DataRobot generates new features from multiple datasets so that you don’t need to perform feature engineering manually to consolidate multiple datasets. Use the Relationship Editor to join the datasets to prepare for Feature Discovery.
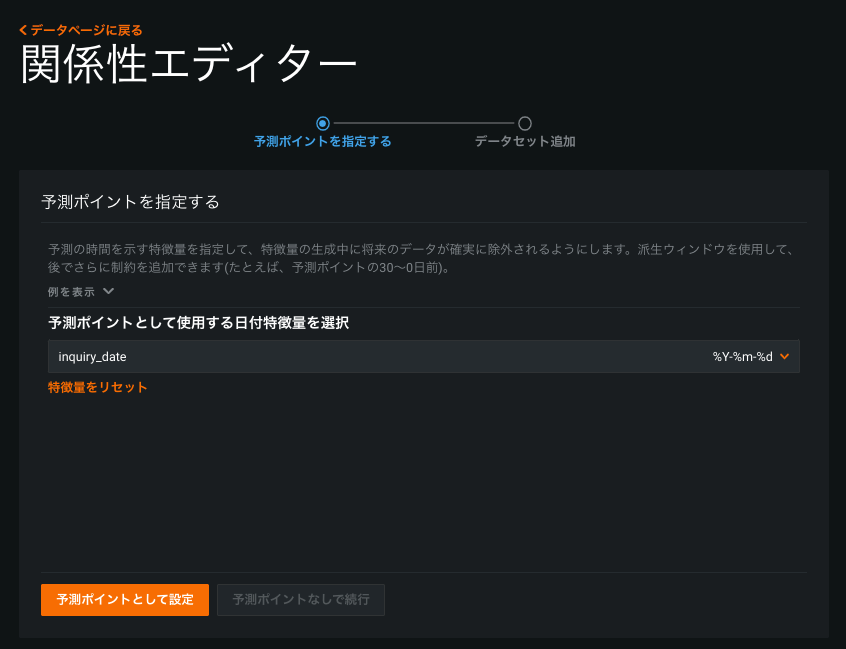
The Relationship Editor setup guide is a new intermediate screen that displays when you click the Add datasets button on the EDA (Data) page. It walks you through the process of specifying prediction points for time-aware features and adding the datasets to be joined for Feature Discovery. For details, see Create a Feature Discovery project.
Feature Discovery engineering controls
Feature Discovery engineering controls, now publicly available, let you influence how DataRobot conducts feature engineering.
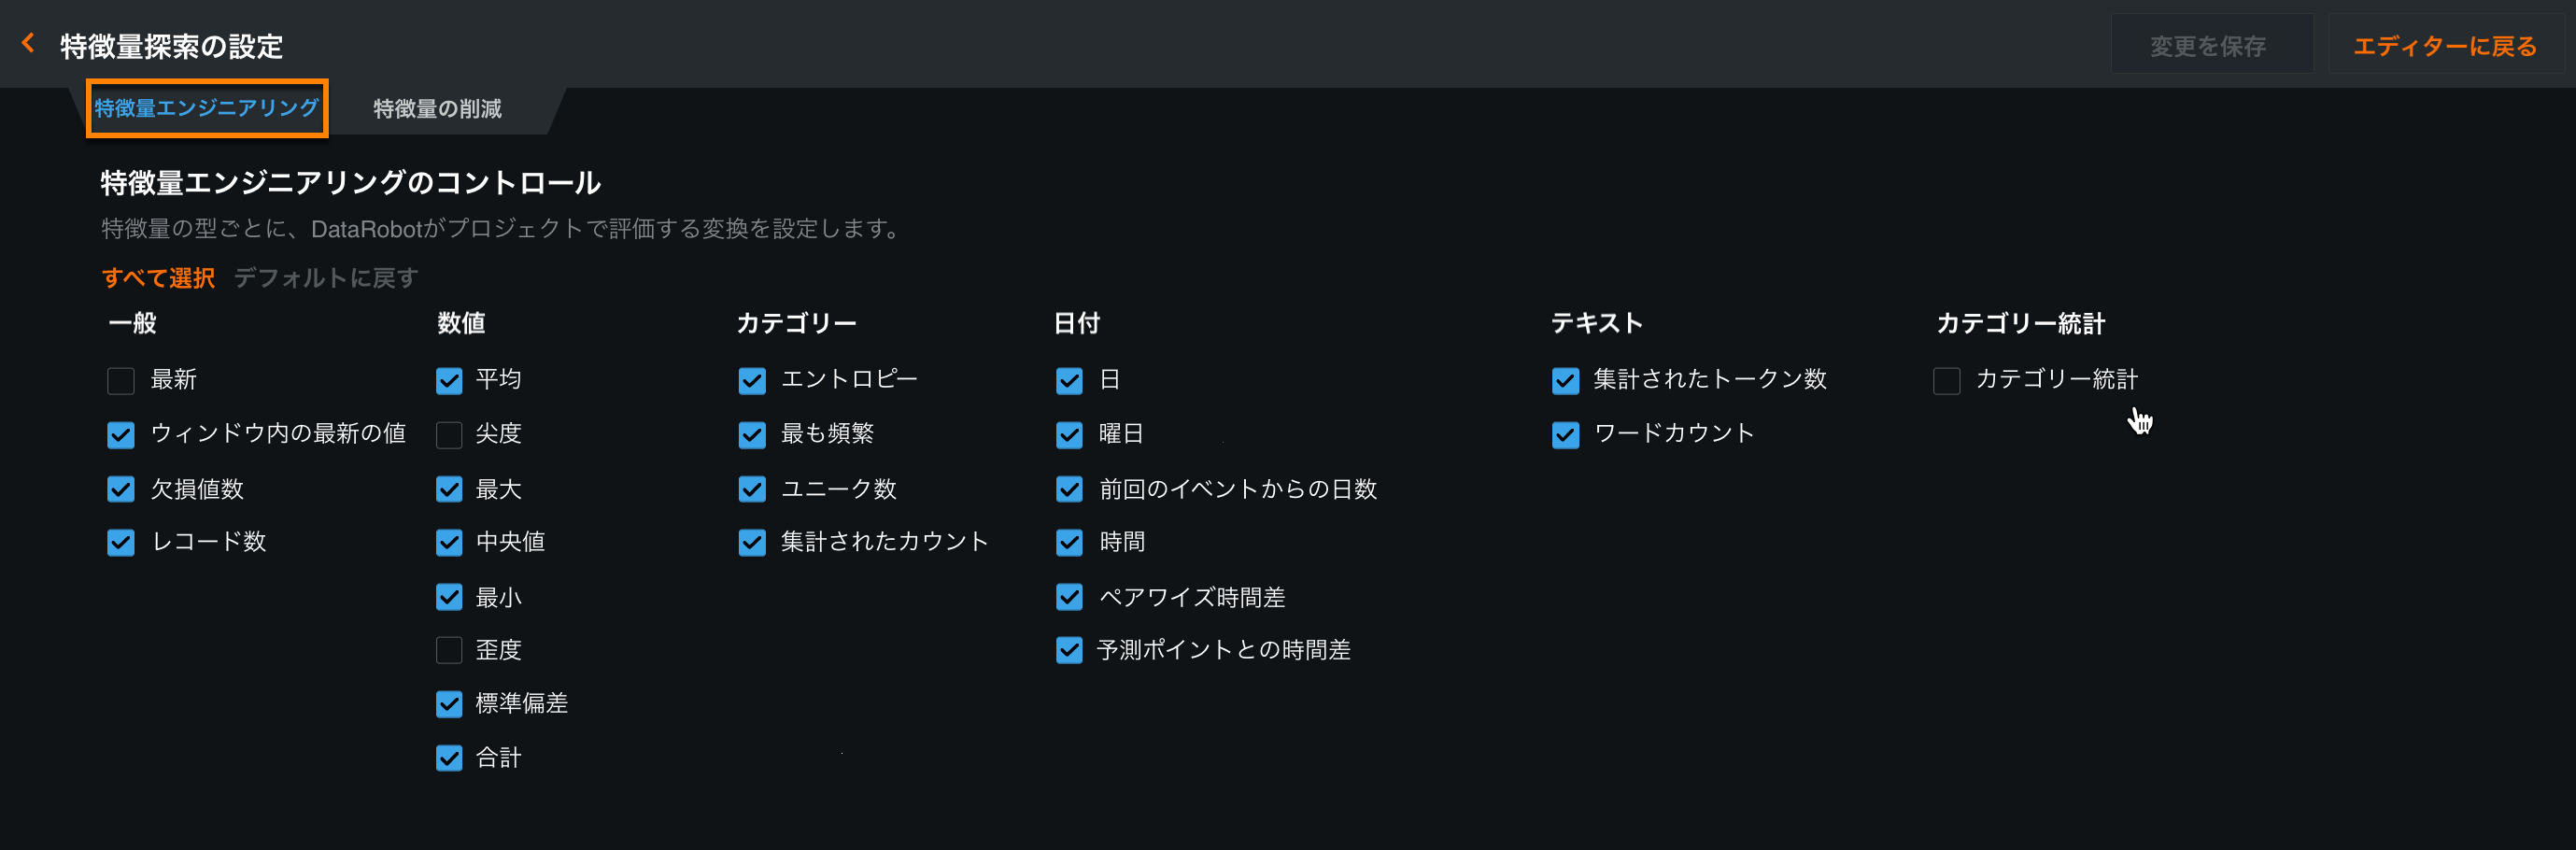
You can enable specific controls to use your domain knowledge to guide feature engineering or to improve accuracy. You might want to exclude specific transformations that slow down processing or are difficult to explain to stakeholders. For details, see Set feature engineering controls.
Feature Discovery settings enhanced
The Feature Discovery tab on the Data page provides dataset relationship details, a feature derivation summary, and a feature derivation log. You can now see the number of secondary datasets, explored features, and derived features that resulted from Feature Discovery. Click Show more to see which feature engineering controls were used during Feature Discovery and to learn about each.
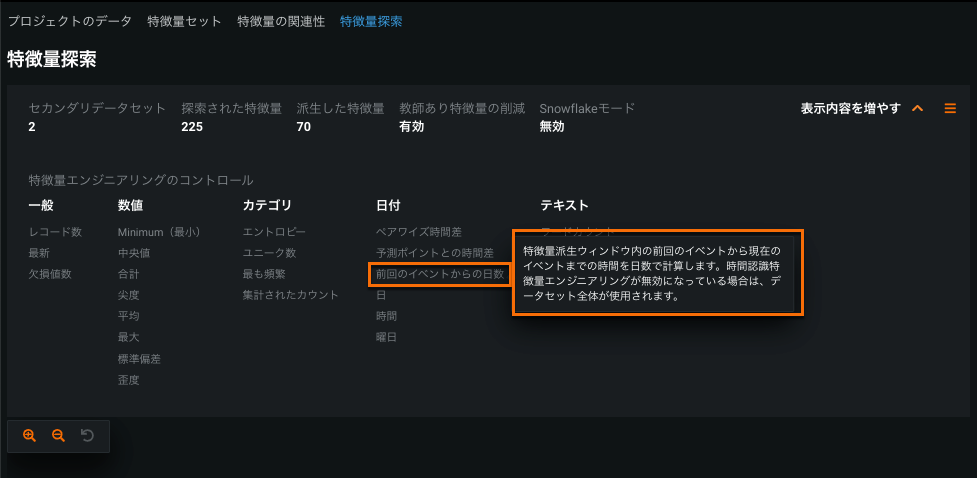
For details, see Define relationships.
Categorical Statistics feature type
Categorical Statistics let you explore numeric statistics like sum, max, and average for each category of a categorical feature. In the following example, during Feature Discovery, DataRobot explores Spending numeric statistics for each category of the Product-Type feature:
- Spending(最小30日)
- Spending(Product_タイプ = Aで最小30日)
- Spending(Product_タイプ = Bで最小30日)
- Spending(Product_タイプ = Cで最小30日) ..
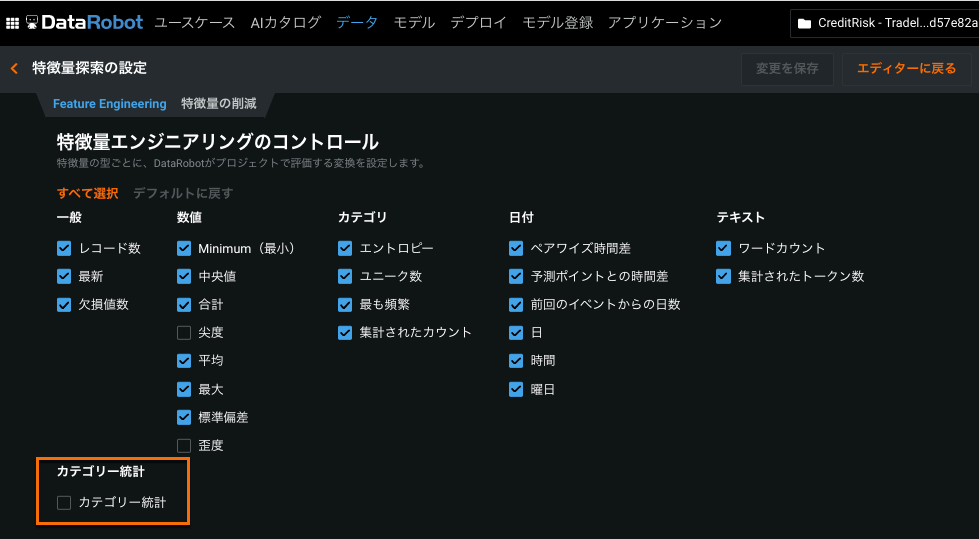
カテゴリー別統計の集計はデフォルトで無効化されています。 You can enable it on the Feature Engineering tab of the Feature Discovery Settings page. For details, see Categorical Statistics.
モデリング特徴量
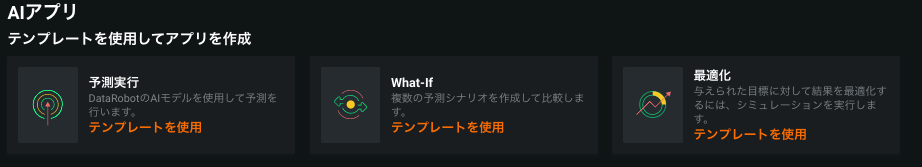
Purpose-built AI applications with the AI App Builder
The AI App Builder, available from the Applications tab, provides a no-code platform to enable core DataRobot services (making predictions, optimizing outcomes, simulating scenarios, and more) without having to build models and evaluate their performance in DataRobot.
Each application starts with a template and data source—either a deployment or dataset in the AI Catalog. However, the App Builder lets you configure additional widgets, custom features, and pages to tailor the application to a specific use case.
Once deployed, applications can be easily shared and do not require users to own full DataRobot licenses in order to use them, offering a great solution for broadening your organization’s ability to use DataRobot’s functionality.
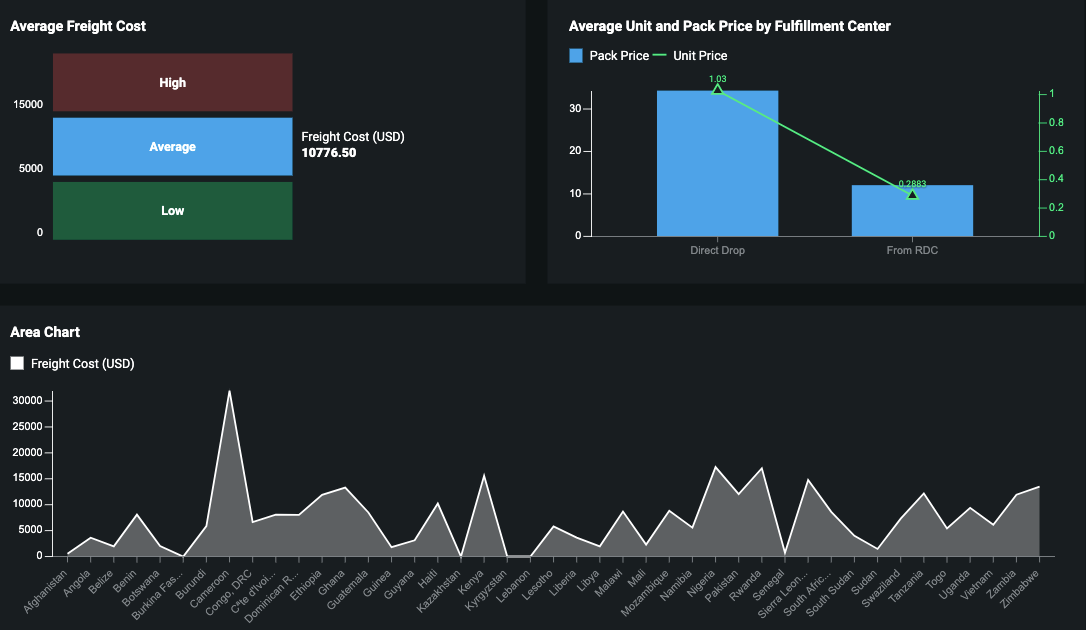
ウィジェット
アプリケーションは、視覚的でインタラクティブな目的駆動型のエンドユーザーアプリケーションを作成するウィジェットで構成されています。 利用可能なウィジェットには、チャートウィジェットとヘッダーウィジェットの2つのタイプがあります。 チャートウィジェットは、アプリケーションに視覚化を追加し、データと予測結果の重要なインサイトを明らかにするように設定できます。 ヘッダーウィジェットは、アプリケーション内で追加のフィルタリングオプションを提供します。
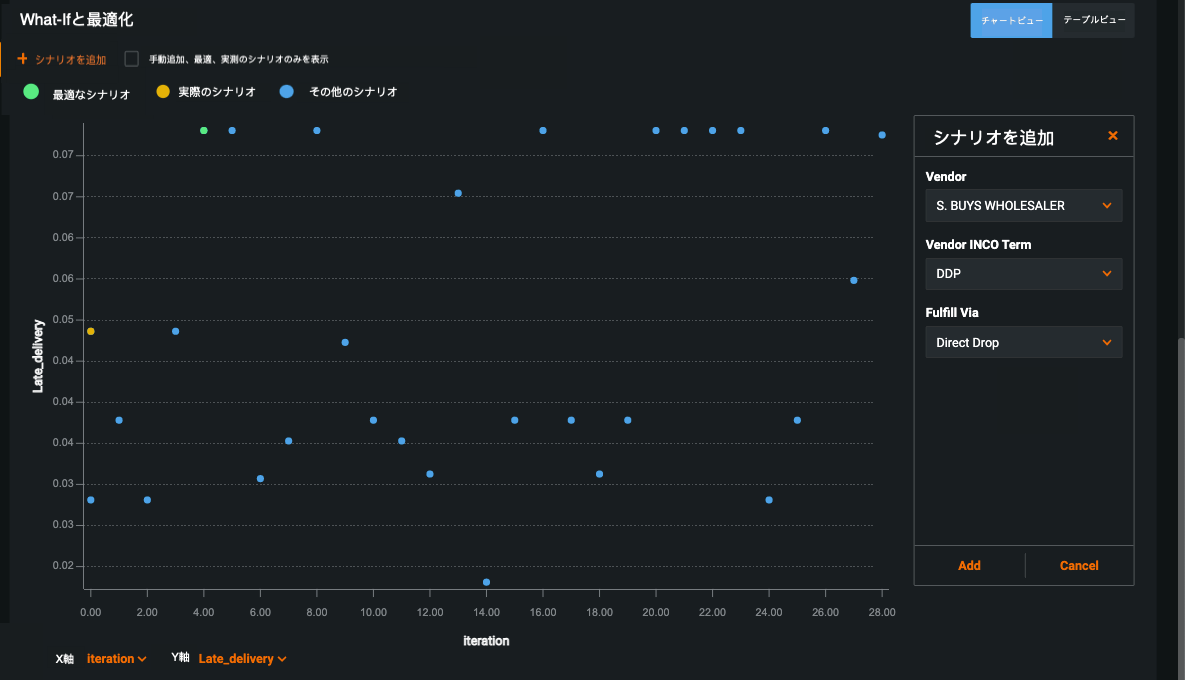
What-Ifと最適化ウィジェット
What-ifとOptimizerウィジェットでは、予測結果を操作するための2つのツールを用意しています。
- What-if:最善の結果を提供するオプションを識別するために、複数の予測シミュレーションを作成して比較できる意思決定ツール。 予測を作成した後、1つまたは複数の入力を変更して新しいシミュレーションを作成し、その変更がターゲット特徴量にどのように影響するかを確認することもできます。
- 最適化:モデルの操作可能な特徴量の選択の値を変更することによって、ターゲットの予測の最大値または最小値を識別します。
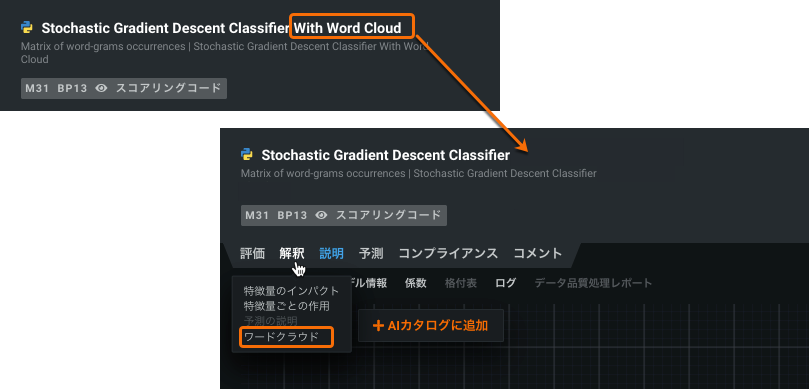
Word Cloud blueprints for multiclass projects
An improvement has been made so that all Stochastic Gradient Descent (SGD) blueprints create a Word Cloud if even a single text feature is present in a multiclass project. Previously, there was a specialized SGD blueprint, available from the Repository, that had to be run manually. Access the new visualizations from either the model’s Describe > Word Cloud or Insights > Word Cloud tabs.
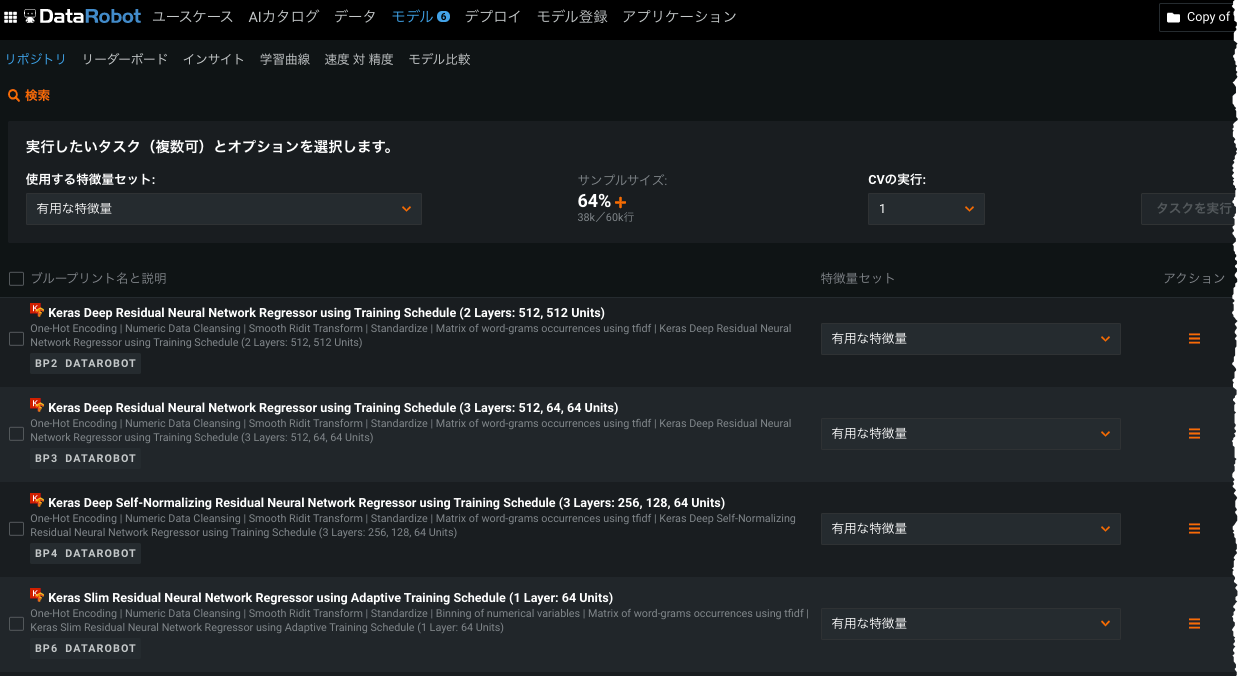
New Keras DeepCTR models available in the Repository
To support data scientists with CTR data (categoricals with high cardinality), DataRobot introduces three DeepCTR models, available from the Repository. These models—neural factorization machine, autoint, and deep cross network—can be particularly useful when building clickthrough rate or recommendation models.
Bias and Fairness improvements
With this release, DataRobot has upgraded the user experience for calculating Bias and Fairness for your models. The first improvement allows you to enable Bias and Fairness insights after modeling has already started. モデルを選択し、バイアスと公平性 > 設定をクリックします。 Once configured, Bias and Fairness insights are enabled for every model on the Leaderboard.
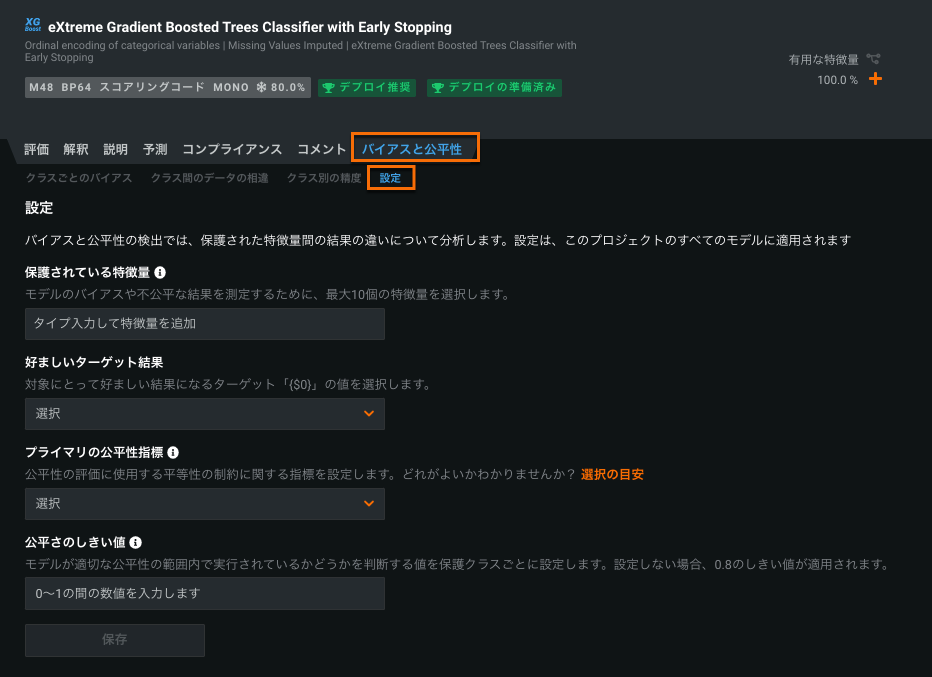
The second improvement is the ability to view multiple fairness metrics in the Per-Class Bias page. This functionality allows you to view fairness scores for all five fairness metrics using a dropdown menu.
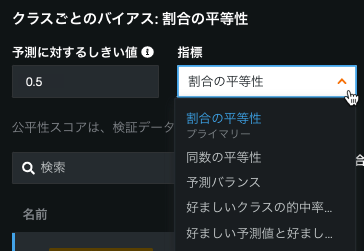
For details, see the Bias and Fairness documentation.
TLS options for Portable Prediction Server
By default, the Portable Prediction Server (PPS) serves predictions over an insecure listener on an :8080 port (clear text HTTP over TCP). また、8443ポート上のセキュアなリスナー(HTTP over TLS/SSL、または単にHTTPS)を介して予測を提供することもできます。 セキュアなリスナーを有効にした場合、セキュアでないリスナーは使用できなくなります。 The configuration is accomplished using environment variables, which are described in the documentation along with accompanying examples.
プレビュー機能
ROC曲線の再設計
The ROC Curve tab has been redesigned to streamline the model evaluation strategies you can perform. Along with the Prediction Distribution graph, ROC curve, confusion matrix, and a summary of metrics, you can now generate profit curves, precision-recall curves, and custom charts in the ROC Curve tab.
関係性エディターで特徴量セットを作成
The ability to create feature lists in the Feature Discovery Relationship Editor is now available as a preview feature.
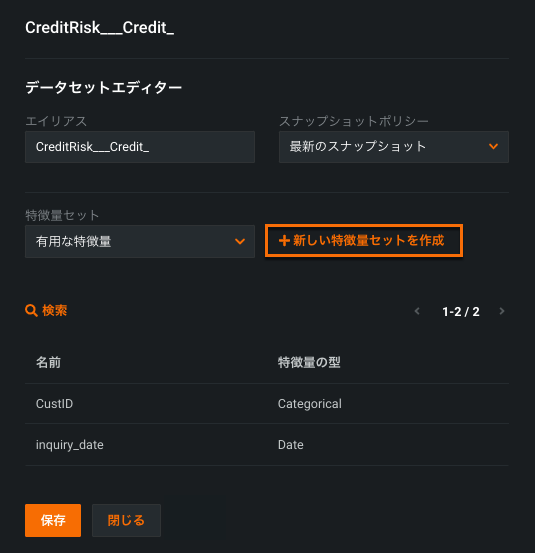
Once you create your feature list, you can transform the features directly in the Relationship Editor.
![]()
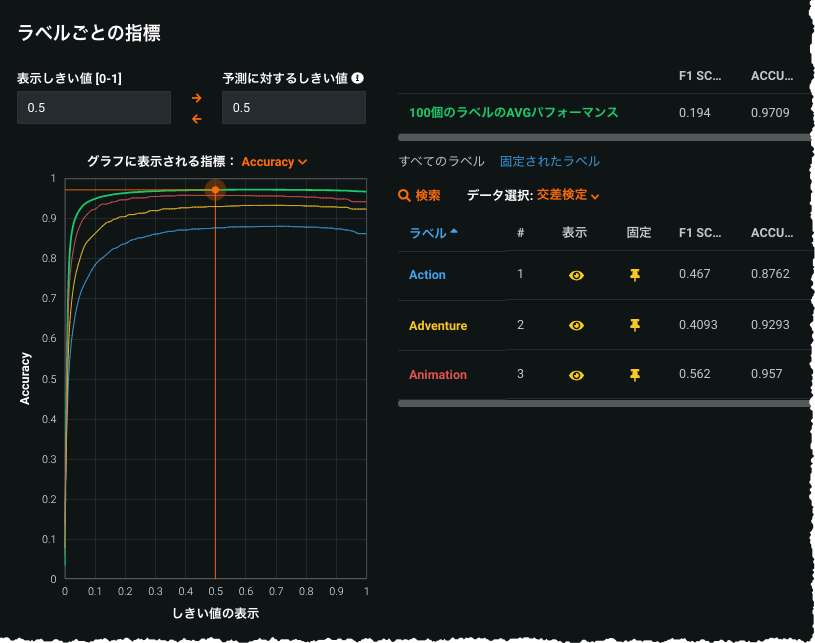
Further enhancements to multilabel modeling
In response to user feedback, the multilabel modeling preview feature introduces several usability improvements, including:
- Addition of Feature Effects visualization for multilabel projects
- Increased speed of per-label metric
- New per-label Word Clouds
- Ability to easily pin labels
- Model packages and access to the Portable Prediction Server for MLOps
[一般提供ドキュメント(バージョン7.3時点での内容)](multilabel-classic
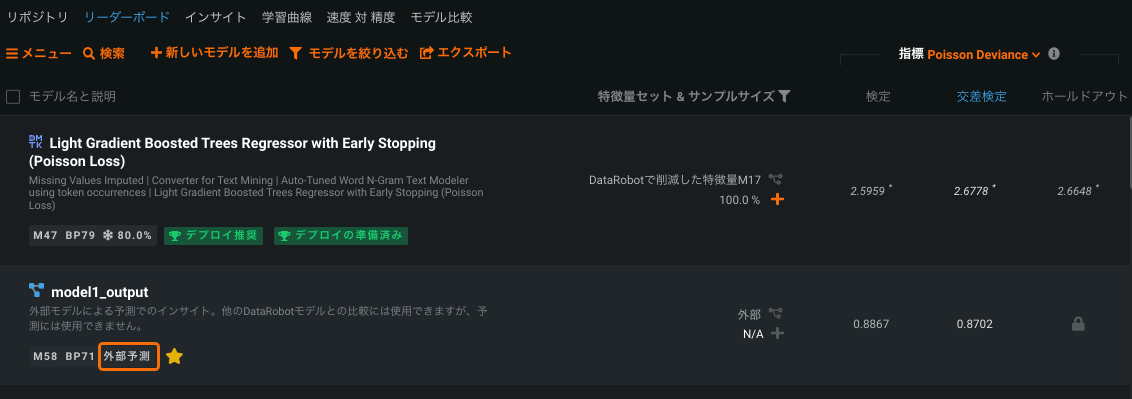
Insights available for external models
外部予測の[詳細オプション]タブから外部モデルをDataRobot AutoML環境に取り込み、リーダーボードに表示したり、DataRobotの評価インサイトのサブセットを実行してDataRobotモデルと比較したりすることができます。 Simply add external model predictions as a new column in your training dataset, identify the predictions and partition column, and press Start. The external model becomes available on the Leaderboard, which you can then compare against DataRobot models, investigate further using select DataRobot visualizations, and (for binary classification projects) explore bias testing.
サポート終了のお知らせ
Note the following to better plan for later migration to new releases.
Hadoop deployment and scoring deprecated
スタンドアロンスコアリングエンジン(SSE)を含むHadoopのデプロイとスコアリングは、リリースv7.3(クラウドユーザーは2021年12月13日)から使用できなくなり、完全に使用非推奨となります(サポート終了)。 廃止後は、Hadoopを使って予測を生成することはできません。
Enterprise database integrations deprecated
Enterprise database integrations will be unavailable and fully deprecated (end-of-life) starting with release v7.3 (December 13th, 2021 for Cloud users). Post-deprecation, integrations should not be used to generate predictions with deployments.
Open source models deprecated
Open source models have been deprecated.
お客様から報告された問題の修正
v7.1.3以降、以下の問題が修正されています。
プラットフォーム
- EP-1535:DockerベースのインストールのストレージとしてMinioを使用する場合のマップタイル管理ワークフローに関する問題を修正しました。
- EP-1495: Sets
PYSPARK_PYTHONandPYSPARK_DRIVER_PYTHONin datarobot scoring to point to DataRobot's python. - UIUX-2520: Fixes an issue with the Insights view when the page is refreshed.
- UIUX-2518: Fixes blueprint task descriptions.
- UIUX-2510: Fixes the business mode model info view.
- UIUX-1950: Fixes an issue related to the add/delete column in beginner mode.
- UIUX-2146: Hides the resource usage summary under each model's Model Info tab by default. Enable the user-level flag to display this information.
- UIUX-3207: The confusion matrix now displays an error message if an issue occurred while loading matrix data.
- UIUX-5113: Disables the confusion matrix for multiclass projects that are run with slim-run (no stacked predictions) when the model was trained into validation.
時系列
- TIME-8176: Fixes an issue when Prediction Explanations failed to compute with new series modelers.
- TIME-8425: Anomaly assessment records are now filtered properly when backtest 0 is specified as filtering condition.
- TIME-8992: Fixes an issue with custom feature lists for KIA new series modelers.
- TIME-9074: Fixes an issue that caused an error in the computation of a valid forecast point range due to the incorrect minimum number of rows count required to perform the validation.
記載されている製品名および会社名は、各社の商標または登録商標です。 製品名または会社名の使用は、それらとの提携やそれらによる推奨を意味するものではありません。