Attention Maps
| タブ | 説明 |
|---|---|
| 説明 | Highlights regions of an image according to its importance to a model's prediction, highlighting areas of high and low attention. |
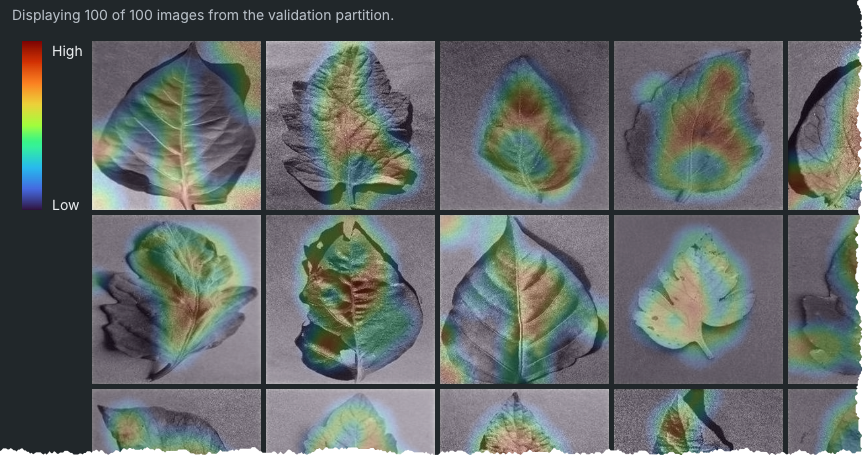
Attention Maps show which image areas the model is using when making predictions—which parts of the images are driving the algorithm's prediction decision.
An attention map can indicate whether your model is looking at the foreground or background of an image or whether it is focusing on the right areas. For example, is it looking only at “healthy” areas of a plant when there is disease and because it does not use the whole leaf, classifying it as "no disease"? Is there a problem with overfitting or target leakage? These maps help to determine whether the model would be more effective if the augmentation settings were tuned.
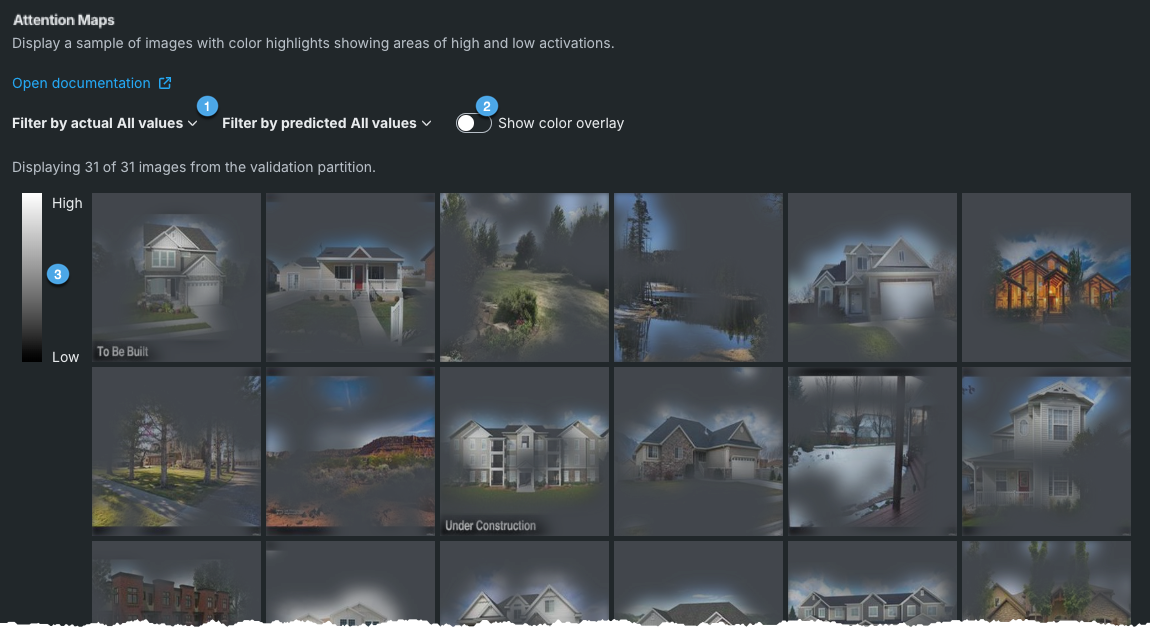
プロジェクトの検定セットから最大100のサンプル画像のプレビューが表示されます。 Use the following filters to modify the display:
| 要素 | 説明 | |
|---|---|---|
| 1 | 予測値または実測値のフィルター | 予測クラス値と実測クラス値に基づいて表示を絞り込むことができます。 詳細については、フィルターを参照してください。 |
| 2 | カラーオーバーレイを表示 | Sets whether to set the display to show only what the model deemed "important" for predictions or whether to show the important area in context of the whole image. 詳細については、カラーオーバーレイを参照してください。 |
| 3 | Attention scale | 領域が予測に影響を与えている度合いを表示します。 See Attention scale for details. |
フィルター
フィルターを使用すると、予測クラス値と実測クラス値に基づいて表示を絞り込むことができます。 初期表示にはサンプル全体が表示されます(つまり、両方のフィルターがすべてに設定されています)。 You can instead set the display to filter by specific classes, limiting the display.
If you choose a value from the dropdown but it returns zero results, it indicates that there was a row in that range or with that value, but it wasn't in the sample from the validation set. Target ranges are extracted from the initial training partition, which might not overlap with the validation partition.
Consider some examples from a plant health dataset:
| 「予測」フィルター | 「実測」フィルター | 結果の表示 |
|---|---|---|
| すべて | すべて | All (up to 100) samples from the validation set. |
| トマト黄化葉巻病 | すべて | All samples in which the predicted class was Tomato Leaf Mold. |
| トマト黄化葉巻病 | トマト黄化葉巻病 | All samples in which both the predicted and actual class were Tomato Leaf Mold. |
| トマト黄化葉巻病 | ジャガイモの病気 | Any sample in which DataRobot predicted Tomato Leaf Mold but the actual class was potato blight. |
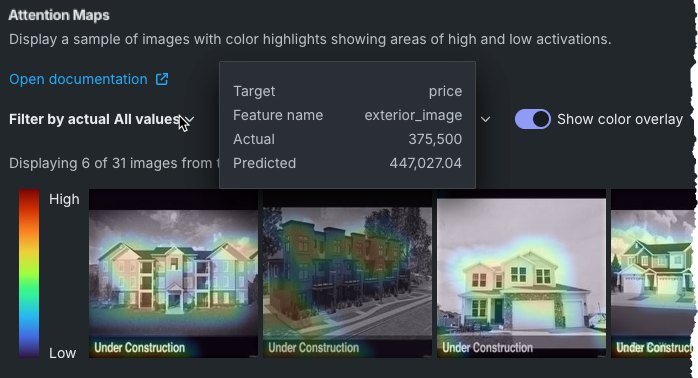
Hover over an image to see details:
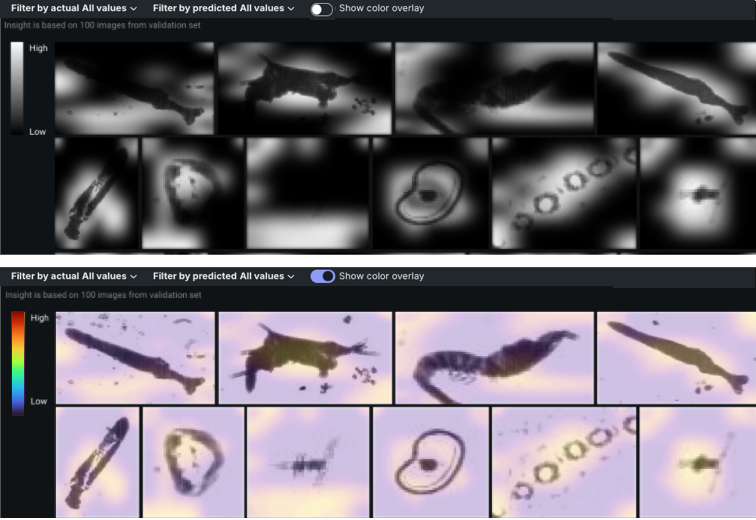
カラーオーバーレイ
DataRobot provides two different views of the attention maps, one with and one without a color overlay. Choices are controlled by the Show color overlay toggle.
- When disabled (toggle off), the map shows only the more important areas of each image, covering the rest in opaque bland and white coloring.
- When enabled, the map shows the entire image with the important areas highlighted in color.
Use this option to check whether the model is working as expected—is it using the 'right' areas of the image to make a prediction or is it focusing on random areas that don't fit the use case? This insight can be thought of as the image equivalent of feature importance in tabular datasets.
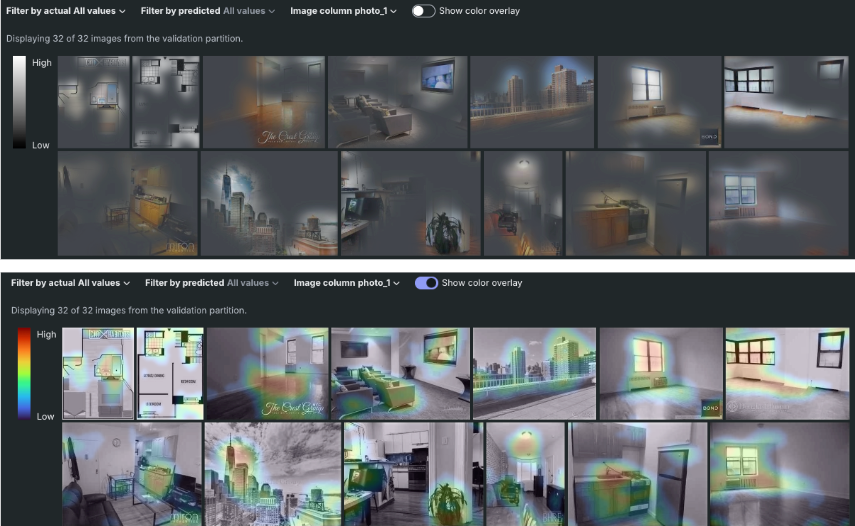
コントラストが最もはっきりするオプションを選択します。 For example, for black and white datasets, the alternative color overlay may make attention areas more obvious (instead of using a black-to-transparent scale). カラーオーバーレイの表示を切り替えて比較します。
Attention scale
The high-to-low attention scale indicates how much of an image region is influencing the prediction. Areas that colored higher on the scale have a higher predictive influence—the model used something that was there (or not there, but should have been) to make the prediction. 例としては、葉にみられる黄色の変色、葉の下の影、または特定の形でカールする葉の縁などがあります。
スケールについては、モデルが画像の特定の領域に「反応」している度合いを反映しているということも言えます。 これは一種の予測の説明で、モデルの予測の理由を説明するものです。マップは、アルゴリズムで当該領域においてxが確認されたことを示します。その結果、xに類似する視覚情報に対するフィルターの感度が上がりました。