ニューラルネットワーク視覚化ツール
| タブ | 説明 |
|---|---|
| 詳細 | Provides a visual breakdown of each layer in the model's neural network. |
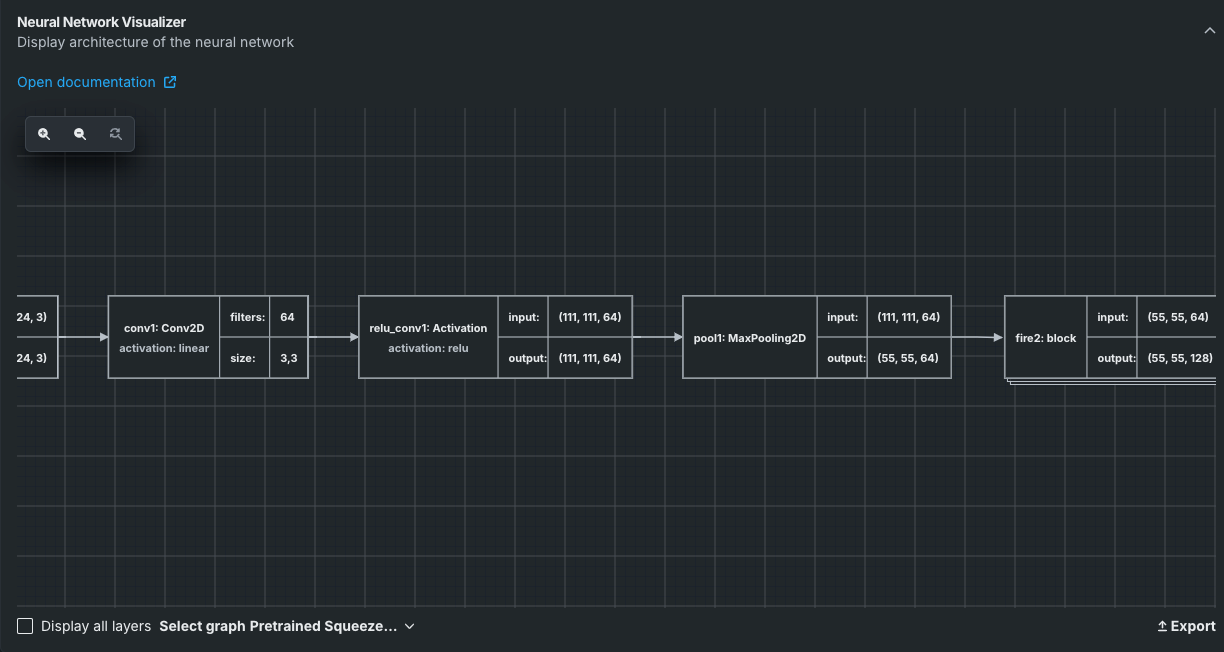
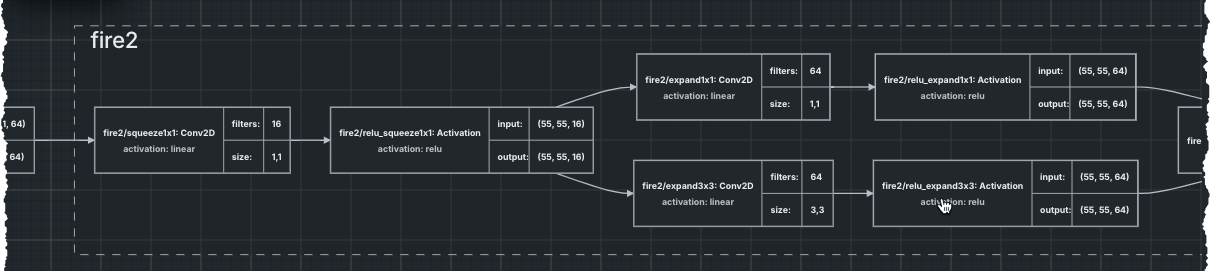
The Neural Network Visualizer illustrates the order of, and connections between, layers for each layer in a model's neural network. ネットワークの各層の接続の順序と入出力が示されるので、予期した順序でネットワーク層が接続されているかどうかを理解するのに役立ちます。
There are several ways to interact with the visualizer display:
-
Click and drag left and right to see all layers.
-
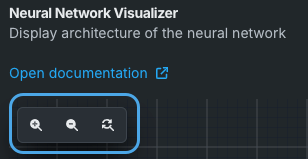
Use the canvas tools to zoom in or out, or to reset to the default.
-
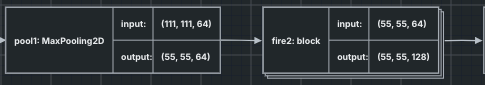
Click a grouped layer to expand and display, or collapse and hide, all layers in the group (cluster). These clusters are parallel groups of CNNs with the same architecture, but with different weights and biases. Each can be thought of as a separate feature detector applied on the same input.
-
Click Display all layers to reload the blueprint with all layers expanded.
-
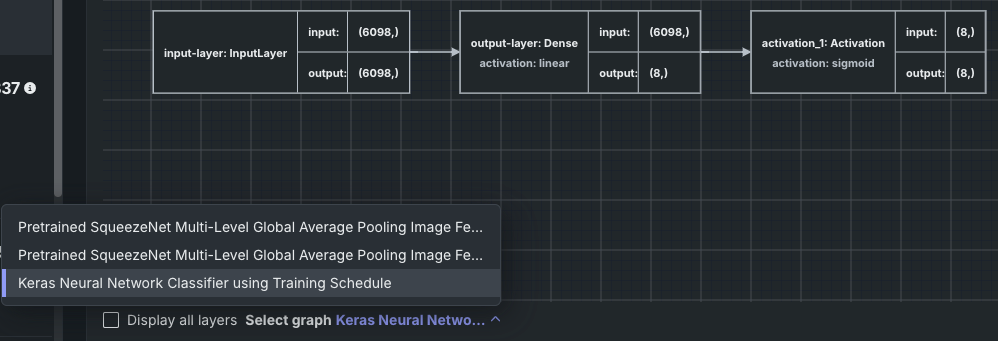
For blueprints that contain multiple neural networks in a single blueprint, the Select graph dropdown becomes available, allowing you to display the associated visualization for that neural network.