画像埋め込み
| タブ | 説明 |
|---|---|
| 説明 | Shows projections of images in two dimensions to see visual similarity between a subset of images and help identify outliers. |
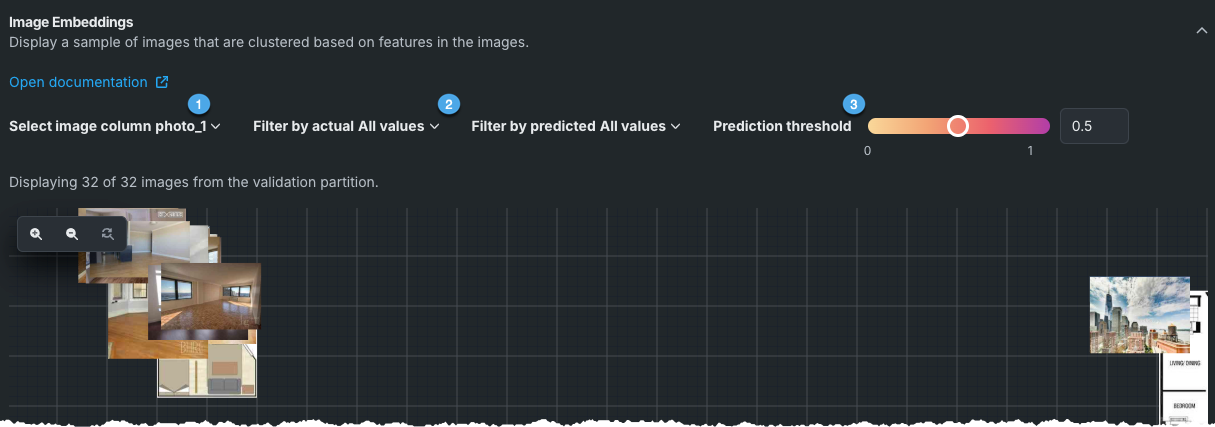
Image Embeddings displays up to 100 images from the validation set, projected onto a two-dimensional plane (using a technique that preserves similarity among images). This visualization answers the questions: What does the featurizer consider to be similar? Does this match human intuition? Is the featurizer missing something obvious?
フィルタリング
Use filters to limit the display by specific classes, actual values, predicted values, and for supported experiment types, values that fall within a prediction threshold:
| 要素 | 説明 | |
|---|---|---|
| 1 | 画像列を選択 | For datasets with more than one image feature, use the dropdown to display clusters based on the selected image. If the dataset contains only a single column, the dropdown is not present. |
| 2 | Filter by actual or predicted | 予測クラス値と実測クラス値に基づいて表示を絞り込むことができます。 |
| 3 | 予測しきい値 | For supported experiment types,shown in the table below,filters the display to show values that fall within a specified threshold. |
Image Embeddings filter options differs depending on the project type. The options are described in the following table:
| 要素 | 説明 | プロジェクトタイプ |
|---|---|---|
| 実測値でフィルター(ドロップダウン) | 実測値が選択したクラスに属する画像を表示します。 デフォルトでは、すべてのクラスが表示されます。 | 二値分類、多クラス、多ラベル |
| 実測値でフィルター(スライダー) | 実測値がカスタム範囲内にある画像を表示します。 | 連続値 |
| 予測値でフィルター(ドロップダウン) | 予測値が選択したクラスに属する画像を表示します。 予測しきい値を変更すると(多クラスは該当しません)、出力が変更されます。 | Binary classification, multiclass, multilabel, anomaly detection, clustering |
| 予測値でフィルター(スライダー) | 予測値が選択した範囲内にある画像を表示します。 | 連続値 |
| 予測しきい値 | 確率のしきい値を調整した場合に、予測値がどのように変化するかを視覚化するのに役立ちます。 しきい値が移動すると、予測結果が変化し、キャンバス(枠線の色)が更新されます。 つまり、しきい値を変更すると、画像の予測ラベルが変更される可能性があります。 異常検知プロジェクトの場合、しきい値を使用して、しきい値が変更されたときに何が異常になるかを確認します。 | Binary classification, multilabel, anomaly detection |
| 画像列を選択 | データセットに複数の画像列がある場合、列に一致する画像の埋め込みのみを表示します。 | 多ラベル |
表示を解釈する
画像の枠の色は予測確率を示します。 確率が予測しきい値より高い画像にはすべて、色の付いた枠線が表示されます。 Note that colors may take some time to appear as the predictions compute.
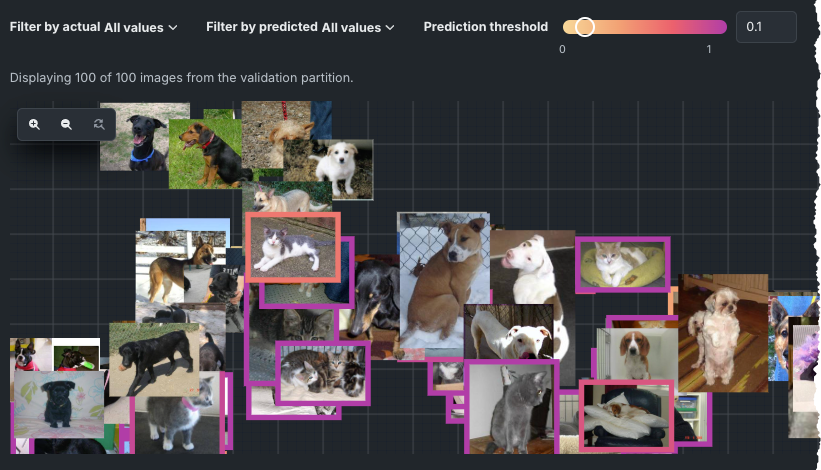
予測確率がしきい値を下回る画像には枠線がなく、フィルターして完全にキャンバスから消すこともできます。 クラスタリングプロジェクトでは、色の付いた枠線がクラスターのメンバーを視覚的に示しています。
Work with the canvas
The Image Embeddings canvas displays projections of images in two dimensions to help you visualize similarities between groups of images and to identify outliers. コントロールを使用すれば、画像をより詳細に表示できます。 次のコントロールを使用できます。
-
ズームコントロールを使用して、すべての画像にアクセスします。
キャンバス上の画像間のスペースを拡大または縮小(またはリセット)して、画像間の詳細をより見やすくしたり、別の画像に隠れている画像にアクセスしたりできるようにします。 このアクションは、マウスでも実行できます(MacではCMD + スクロール、WindowsではSHIFT + スクロール)。
-
Click and drag to move areas of the display into focus.
-
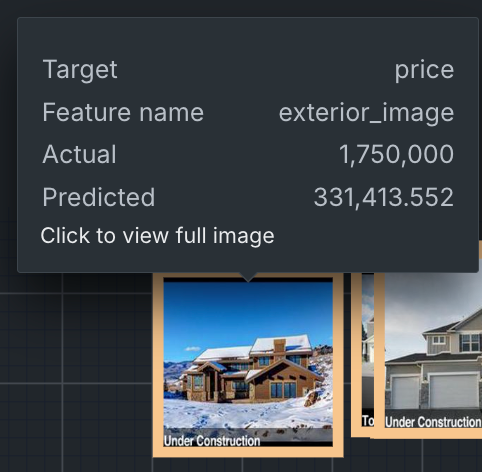
Hover on an image to see details, including the actual and predicted class information. このツールチップを使用して画像を比較し、DataRobotのグループ化画像が期待どおりかどうかを確認します。
-
画像をクリックすると、その画像の予測確率が表示されます。 出力はプロジェクトタイプによって異なります。 たとえば、二値分類を多ラベルプロジェクトと比較します。
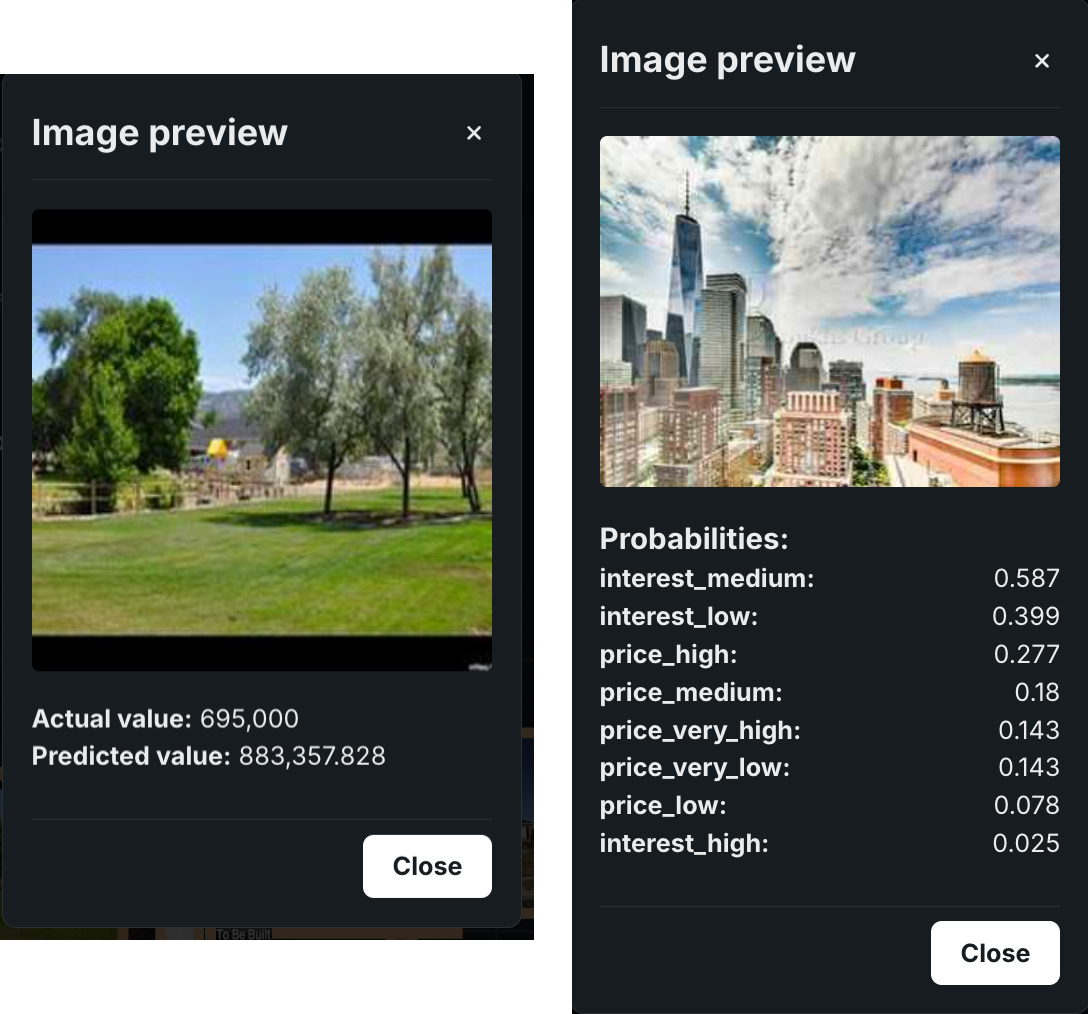
プレビューに表示される予測値は、予測しきい値を変更した場合に更新されます。