オプションのウィジェット
オプションのウィジェットは、アプリケーションで使用する前にすべて設定する必要があります。
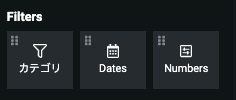
フィルター
フィルターウィジェットは、アプリケーション内で追加のフィルターオプションを提供します。アプリケーションに追加した場合、すべてのページでアクセスできます(つまり、フィルターウィジェットはページ固有ではありません)。 フィルタリングウィジェットで指定されたパラメーターは、すべての可視のチャートウィジェットとすべての行ウィジェットに適用されます。
備考
利用モードでフィルタードロップダウンに結果が表示されない場合、データセットには必要な特徴量型が含まれていません。
カテゴリー
1つ以上のカテゴリー特徴量でフィルターします。
プロパティタブで、使用可能なパラメーターを使用してウィジェットをカスタマイズします。
| パラメーター | 説明 |
|---|---|
| ウィジェット名 | ウィジェットの名前を変更します。 ウィジェットタイプを表示するテキストを置き換えます。 |
| フィルターする特徴量 | ドロップダウンからカテゴリー特徴量を選択します。 それから、特徴量値でアプリケーションのフィルタリングができます。 |
日付
日付特徴量でフィルターします。
プロパティタブで、使用可能なパラメーターを使用してウィジェットをカスタマイズします。
| パラメーター | 説明 |
|---|---|
| ウィジェット名 | ウィジェットの名前を変更します。 ウィジェットタイプを表示するテキストを置き換えます。 |
| 日付を設定する特徴量 | ドロップダウンから日付特徴量を選択します。 それから、特定の日付でアプリケーションのフィルタリングができます。 |
数字
数値特徴量でフィルタリングされます。
プロパティタブで、使用可能なパラメーターを使用してウィジェットをカスタマイズします。
| パラメーター | 説明 |
|---|---|
| ウィジェット名 | ウィジェットの名前を変更します。 ウィジェットタイプを表示するテキストを置き換えます。 |
| 範囲を設定する特徴量 | ドロップダウンから数値特徴量を選択します。 |
| 最小 | 範囲の始まりを表す値(つまり、最小値)を入力します。 |
| 最大 | 範囲の終わりを表す値(つまり、最大値)を入力します。 |
チャート
チャートウィジェットは、アプリケーションに視覚化を追加し、データと予測結果の重要なインサイトを明らかにするように設定できます。
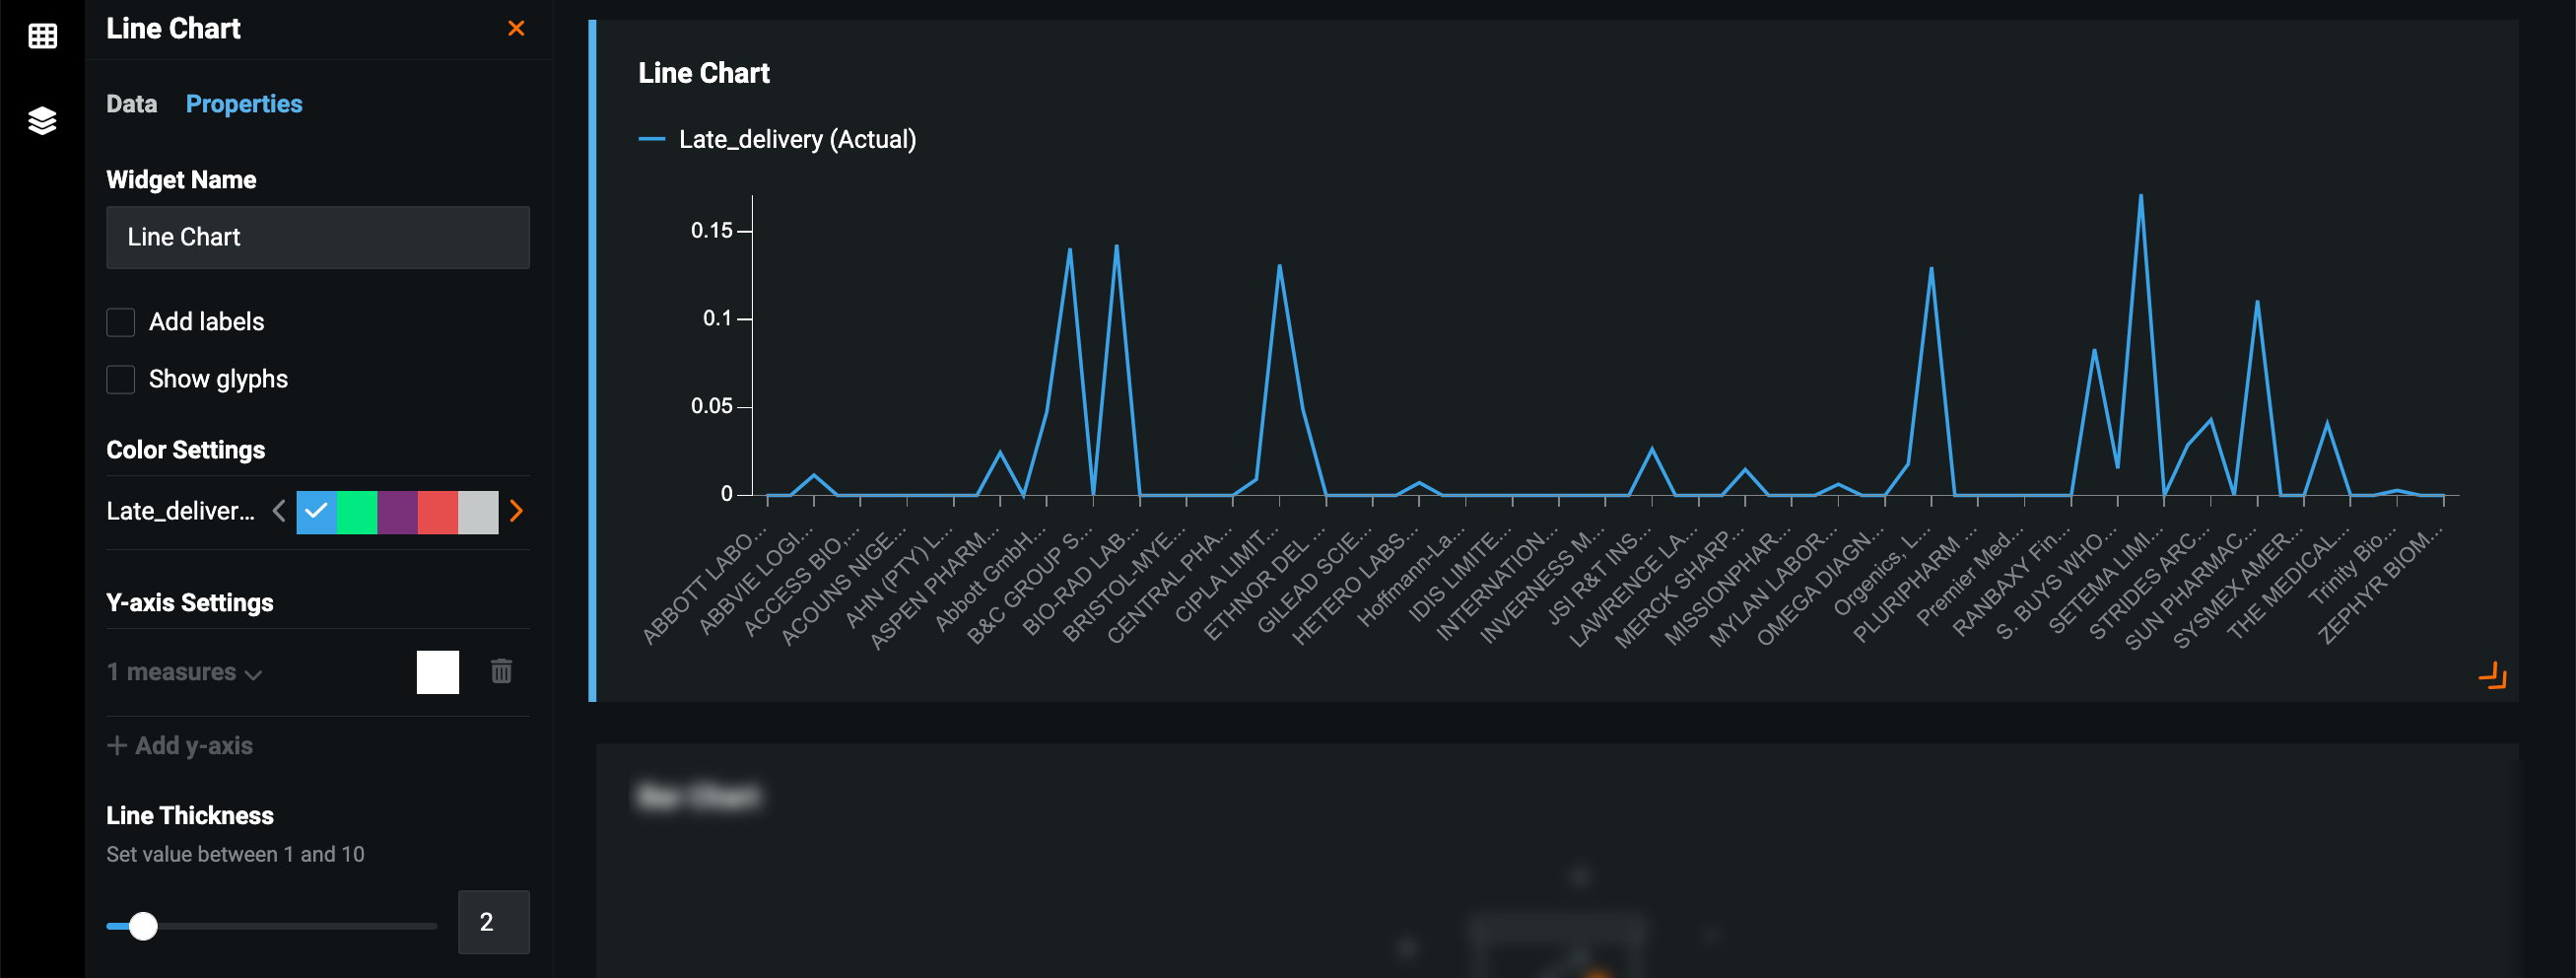
折れ線
選択した特徴量の折れ線グラフを表示します—傾向の視覚化、データの分布の理解、より大きなデータセットの値の比較、および値セット間の関係性の把握に役立ちます。
プロパティタブで、使用可能なパラメーターを使用してウィジェットをカスタマイズします。
| パラメーター | 説明 |
|---|---|
| ウィジェット名 | ウィジェットの名前を変更します。 ウィジェットタイプを表示するテキストを置き換えます。 |
| ラベルを追加 | 各ディメンション上で測定値を表示するラベルを追加します。 |
| マーカーを表示 | 各ディメンション上で測定値をハイライトするマーカーを折れ線グラフに追加します。 選択すると、円、正方形、または三角形のマーカータイプを選択できます。 |
| カラー設定 | チャートに表示される各ディメンションの色をカスタマイズします。 |
| Y軸設定 | Y軸に2つ目のメジャーを追加し、それぞれにカラー設定を指定します。 データタブのメジャーとして複数の特徴量が追加された場合にのみ使用できます。 |
| 線の太さ | 各ディメンションの平均値を表示するラベルを追加します。 |
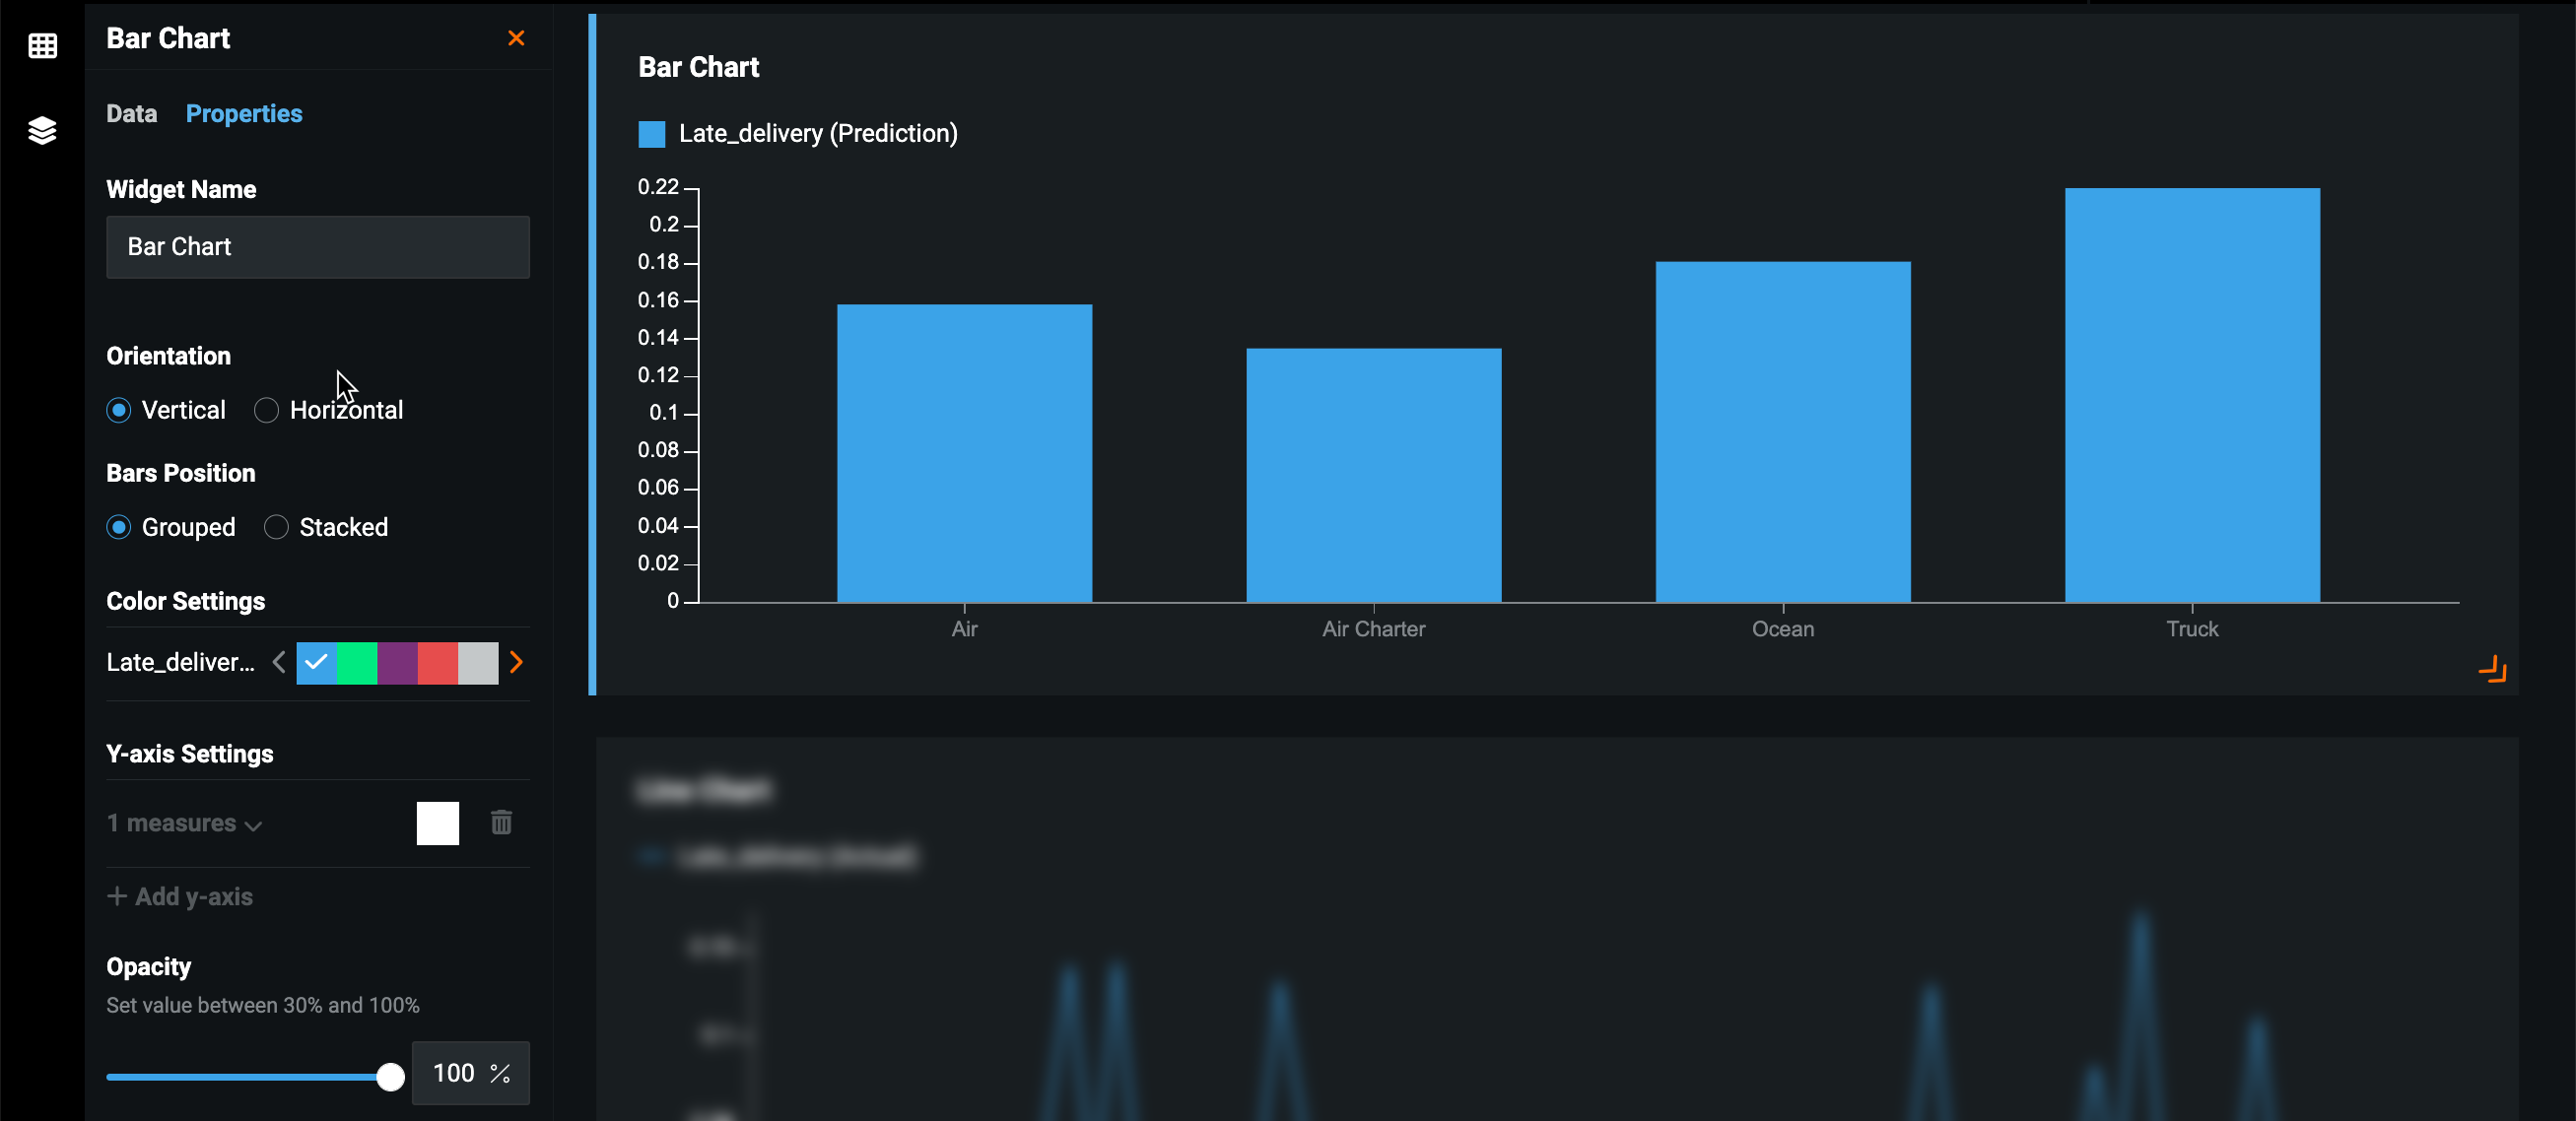
棒
選択した特徴量の棒グラフを表示します—データの分布を理解し、小さなデータセットの値を比較するのに役立ちます。
プロパティタブで、使用可能なパラメーターを使用してウィジェットをカスタマイズします。
| パラメーター | 説明 |
|---|---|
| ウィジェット名 | ウィジェットの名前を変更します。 ウィジェットタイプを表示するテキストを置き換えます。 |
| 方向 | チャートを垂直または水平に向けます。 |
| 棒の位置 | 棒グラフのバーの幅を広くします。 |
| カラー設定 | チャートに表示される各ディメンションの色をカスタマイズします。 |
| Y軸設定 | Y軸に2つ目のメジャーを追加し、それぞれにカラー設定を指定します。 データタブのメジャーとして複数の特徴量が追加された場合にのみ使用できます。 |
| 不透明度 | チャートディメンションの不透明度を制御します。 |
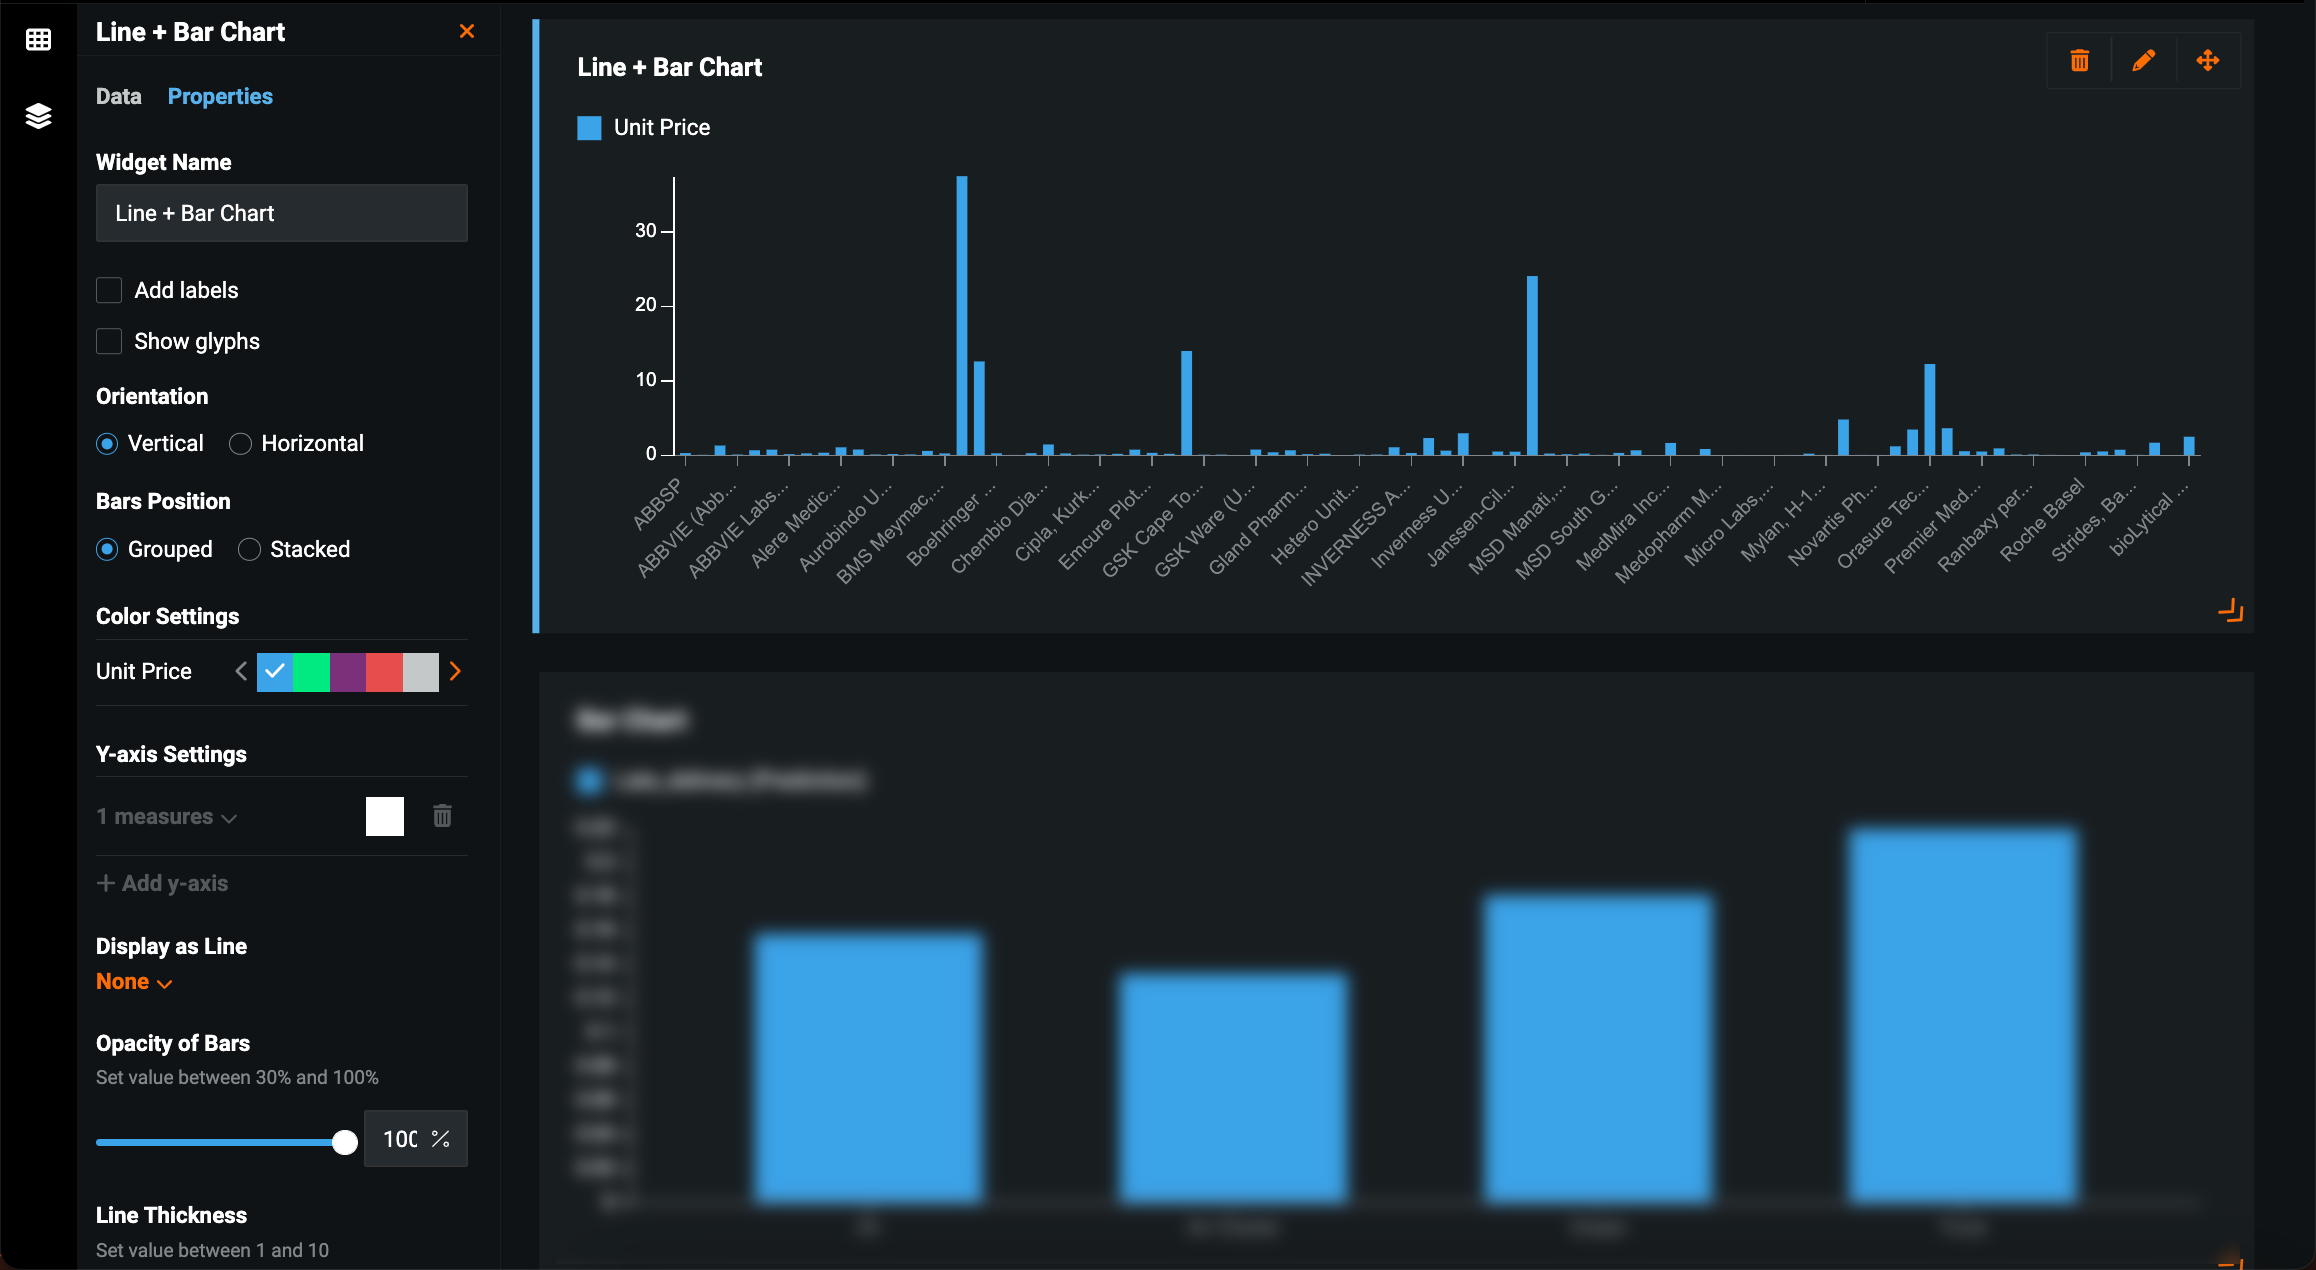
折れ線と棒
選択した特徴量の折れ線グラフと棒グラフを表示します。 この2つの切り替えは開いているアプリケーションで行えます。
プロパティタブで、使用可能なパラメーターを使用してウィジェットをカスタマイズします。
| パラメーター | 説明 |
|---|---|
| ウィジェット名 | ウィジェットの名前を変更します。 ウィジェットタイプを表示するテキストを置き換えます。 |
| ラベルを追加 | 各ディメンション上で測定値を表示するラベルを追加します。 |
| マーカーを表示 | 各ディメンション上で測定値をハイライトするマーカーを折れ線グラフに追加します。 選択すると、円、正方形、または三角形のマーカータイプを選択できます。 |
| 方向 | チャートを垂直または水平に向けます。 |
| 棒の位置 | 棒グラフのバーの幅を広くします。 |
| カラー設定 | チャートに表示される各ディメンションの色をカスタマイズします。 |
| Y軸設定 | Y軸に2つ目のメジャーを追加し、それぞれにカラー設定を指定します。 データタブのメジャーとして複数の特徴量が追加された場合にのみ使用できます。 |
| 線として表示 | 各ディメンションの平均値を表示するラベルを追加します。 |
| 棒の不透明度 | チャートディメンションの不透明度を制御します。 |
| 線の太さ | 各ディメンションの平均値を表示するラベルを追加します。 |
面
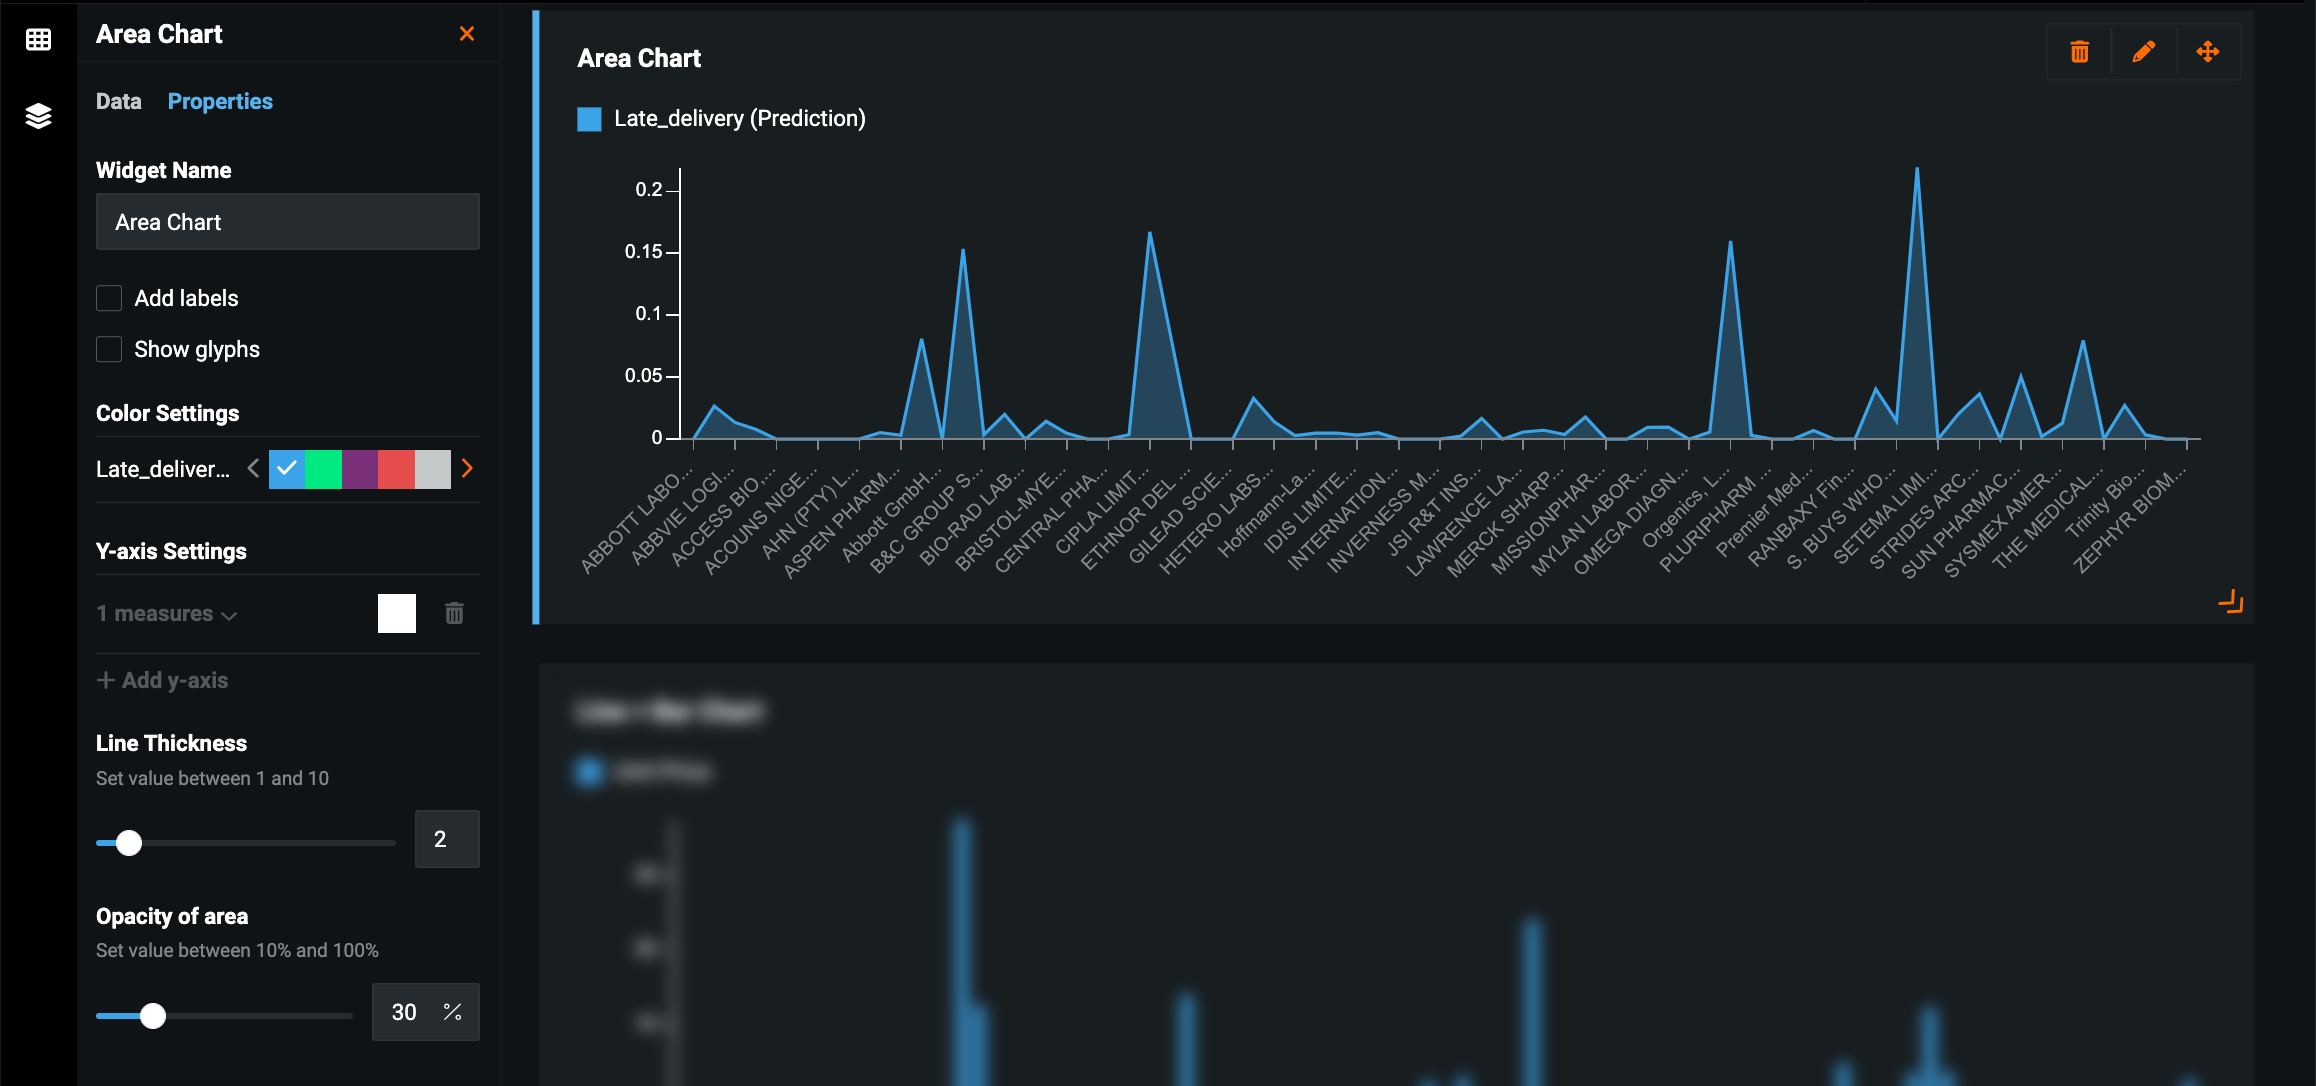
選択した特徴量の面グラフを表示します—データの構成を視覚化するのに役立ちます。
プロパティタブで、使用可能なパラメーターを使用してウィジェットをカスタマイズします。
| パラメーター | 説明 |
|---|---|
| ウィジェット名 | ウィジェットの名前を変更します。 ウィジェットタイプを表示するテキストを置き換えます。 |
| ラベルを追加 | 各ディメンション上で測定値を表示するラベルを追加します。 |
| マーカーを表示 | 各ディメンション上で測定値をハイライトするマーカーを折れ線グラフに追加します。 選択すると、円、正方形、または三角形のマーカータイプを選択できます。 |
| カラー設定 | チャートに表示される各ディメンションの色をカスタマイズします。 |
| Y軸設定 | Y軸に2つ目のメジャーを追加し、それぞれにカラー設定を指定します。 データタブのメジャーとして複数の特徴量が追加された場合にのみ使用できます。 |
| 線の太さ | 各ディメンションの平均値を表示するラベルを追加します。 |
| 領域の不透明度 | チャートディメンションの不透明度を制御します。 |
円
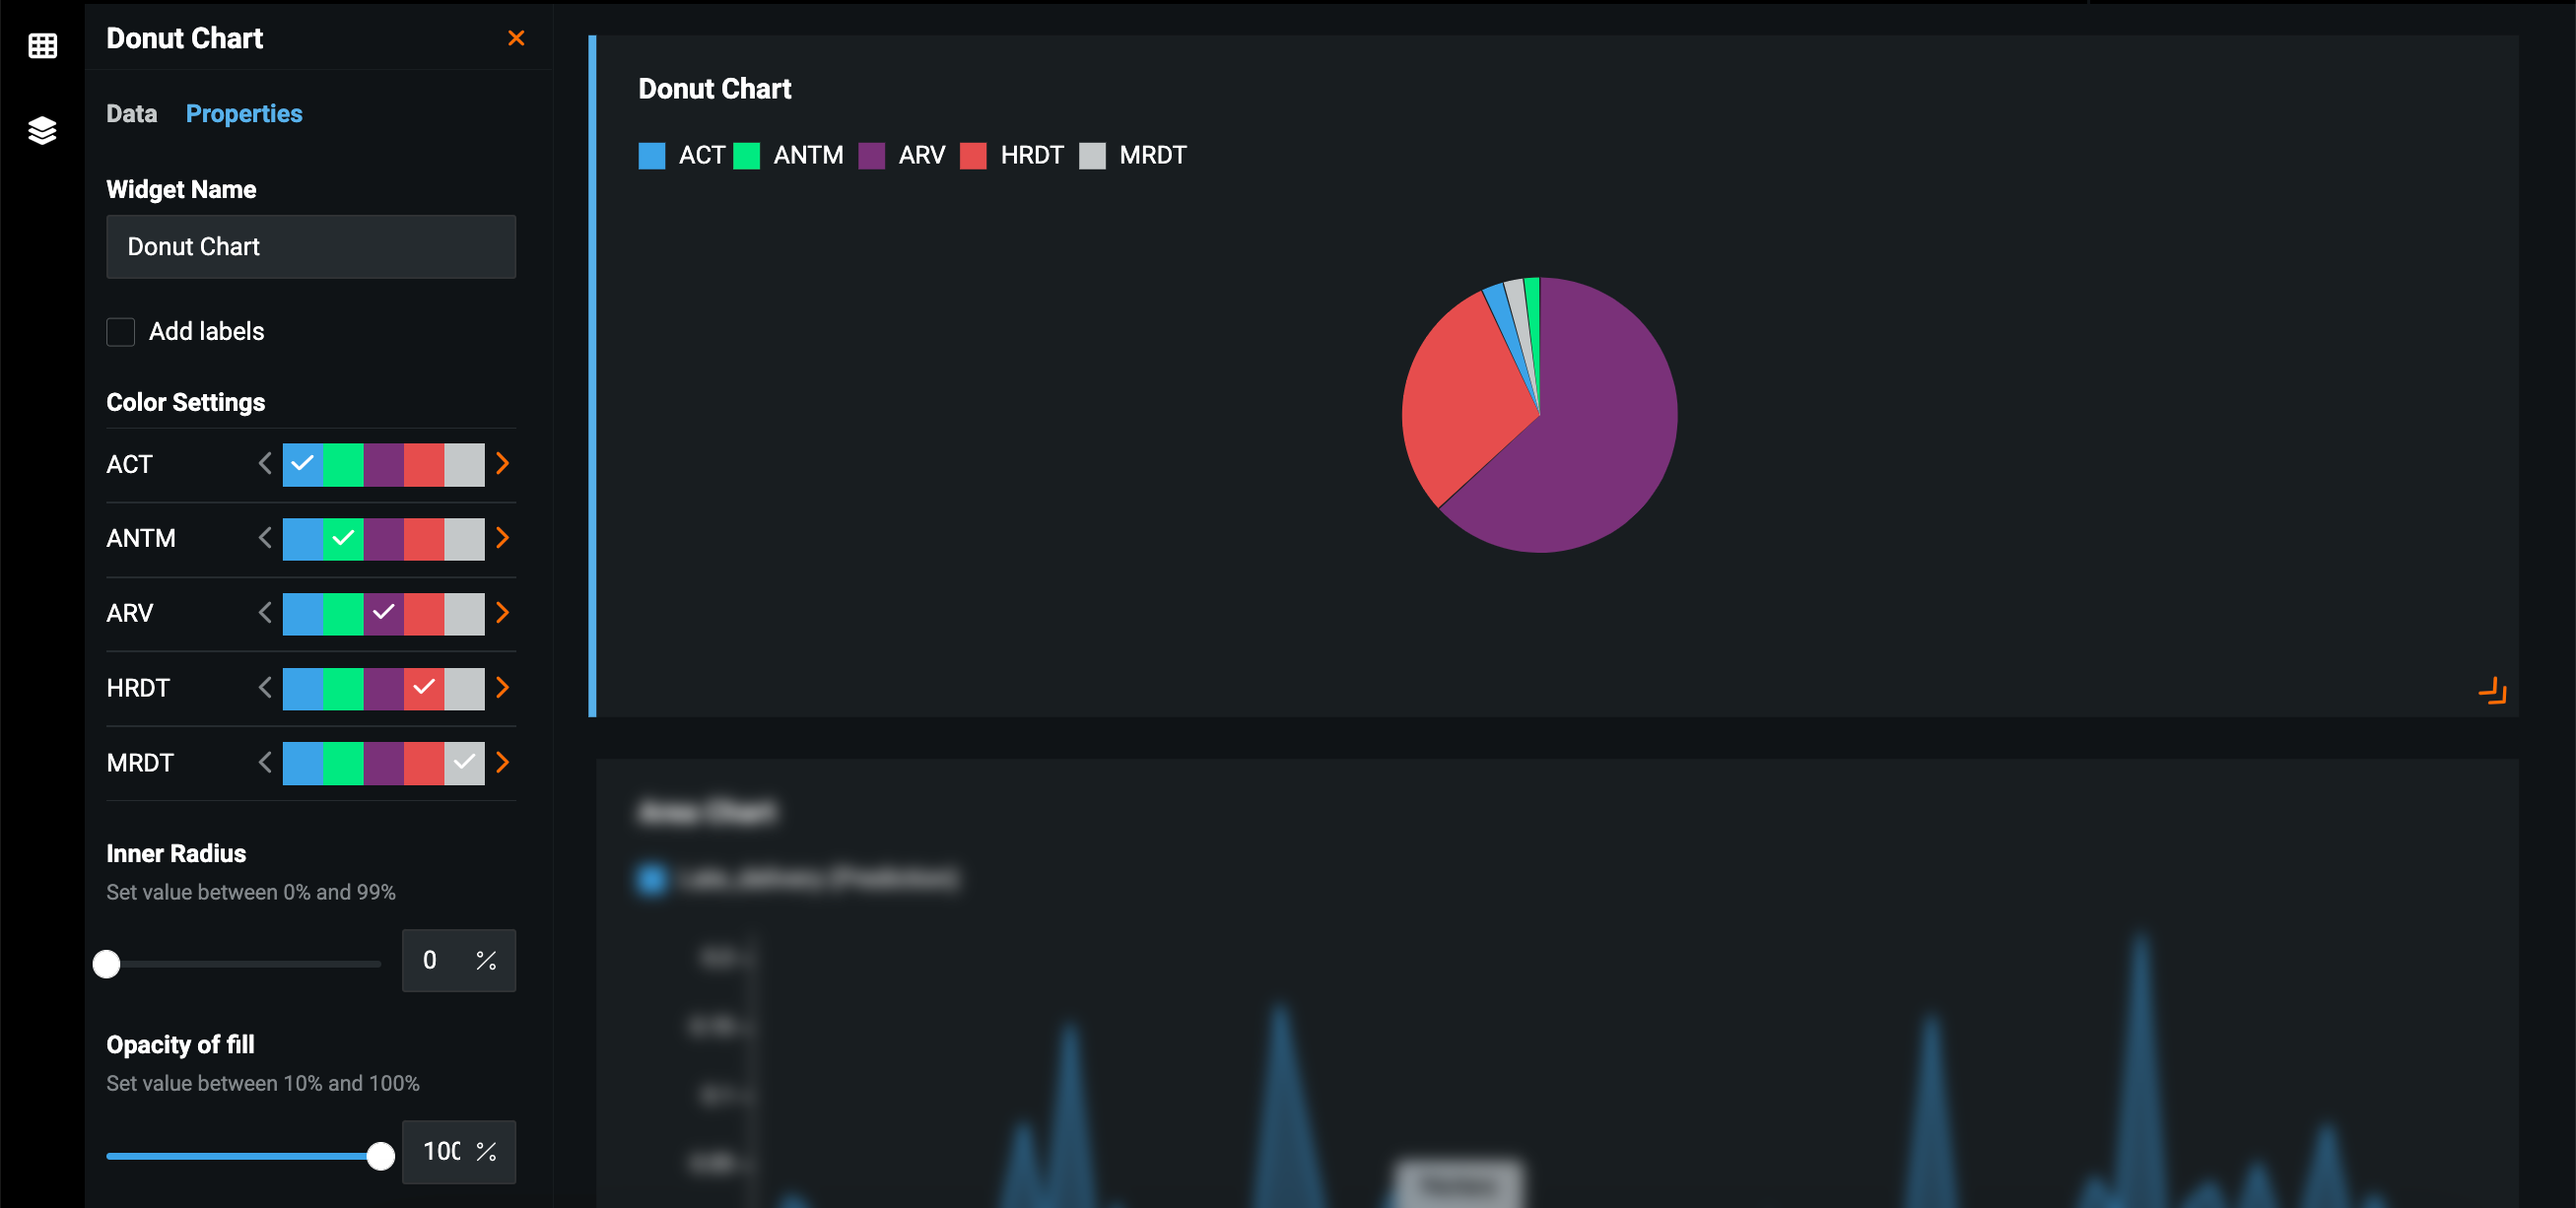
1つのディメンションと1つのメジャーに基づいた円グラフを表示します—データの構成、特に各部分が全体とどのように比較されるかを視覚化するのに役立ちます。
プロパティタブで、使用可能なパラメーターを使用してウィジェットをカスタマイズします。
| パラメーター | 説明 |
|---|---|
| ウィジェット名 | ウィジェットの名前を変更します。 ウィジェットタイプを表示するテキストを置き換えます。 |
| ラベルを追加 | 各ディメンションの平均値を表示するラベルを追加します。 |
| カラー設定 | チャートに表示される各ディメンションの色をカスタマイズします。 |
| 内径 | ドーナツグラフの中央に負のスペースを追加します。 |
| 塗りつぶしの不透明度 | チャートディメンションの不透明度を制御します。 |
単一の値
デフォルトでは、選択した数値特徴量の平均値を表示します。 制約の設定機能を使用すると、ウィジェットを設定して、個別のカウント、最小値、最大値、および特徴量の値の合計を表示できます。
プロパティタブで、使用可能なパラメーターを使用してウィジェットをカスタマイズします。
| パラメーター | 説明 |
|---|---|
| ウィジェット名 | ウィジェットの名前を変更します。 ウィジェットタイプを表示するテキストを置き換えます。 |
| 値にカテゴリーを割り当てる | 範囲ごとに値をグループ化するカテゴリーを作成します。 |
