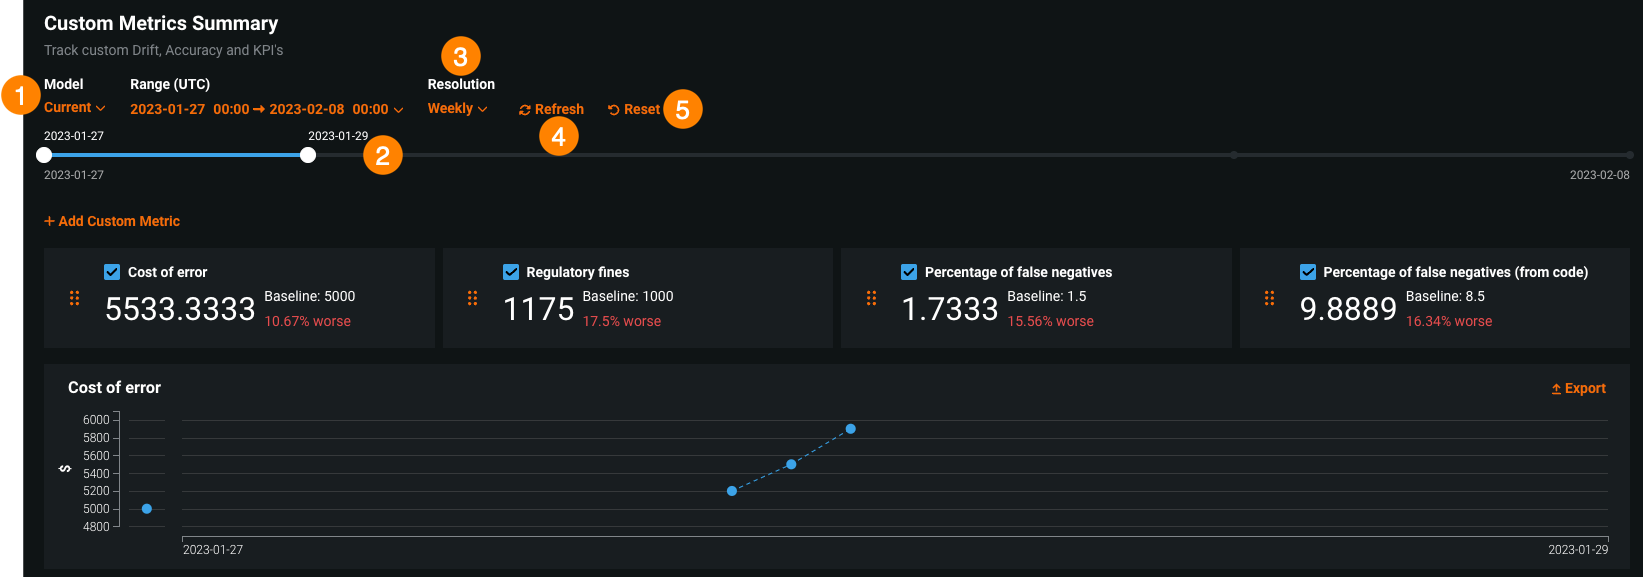
「カスタム指標」タブ
デプロイのカスタム指標タブでは、 データ探索タブから収集するデータ(または他のカスタム指標を介して計算されたデータ)を使用して、カスタムビジネスまたはパフォーマンス指標を計算および監視できます。 これらの指標は、変更可能なカスタム指標のサマリーダッシュボードに記録され、そこで各指標の経時変化を監視、視覚化、およびエクスポートします。 この機能により、組織固有の指標を実装して、DataRobotに組み込まれているサービスの正常性、データドリフト、精度の各指標によって提供されるインサイトを拡張できます。
カスタム指標数の上限
デプロイごとに最大50個のカスタム指標を設定でき、その50個のうち5個をホストされたカスタム指標にすることができます。
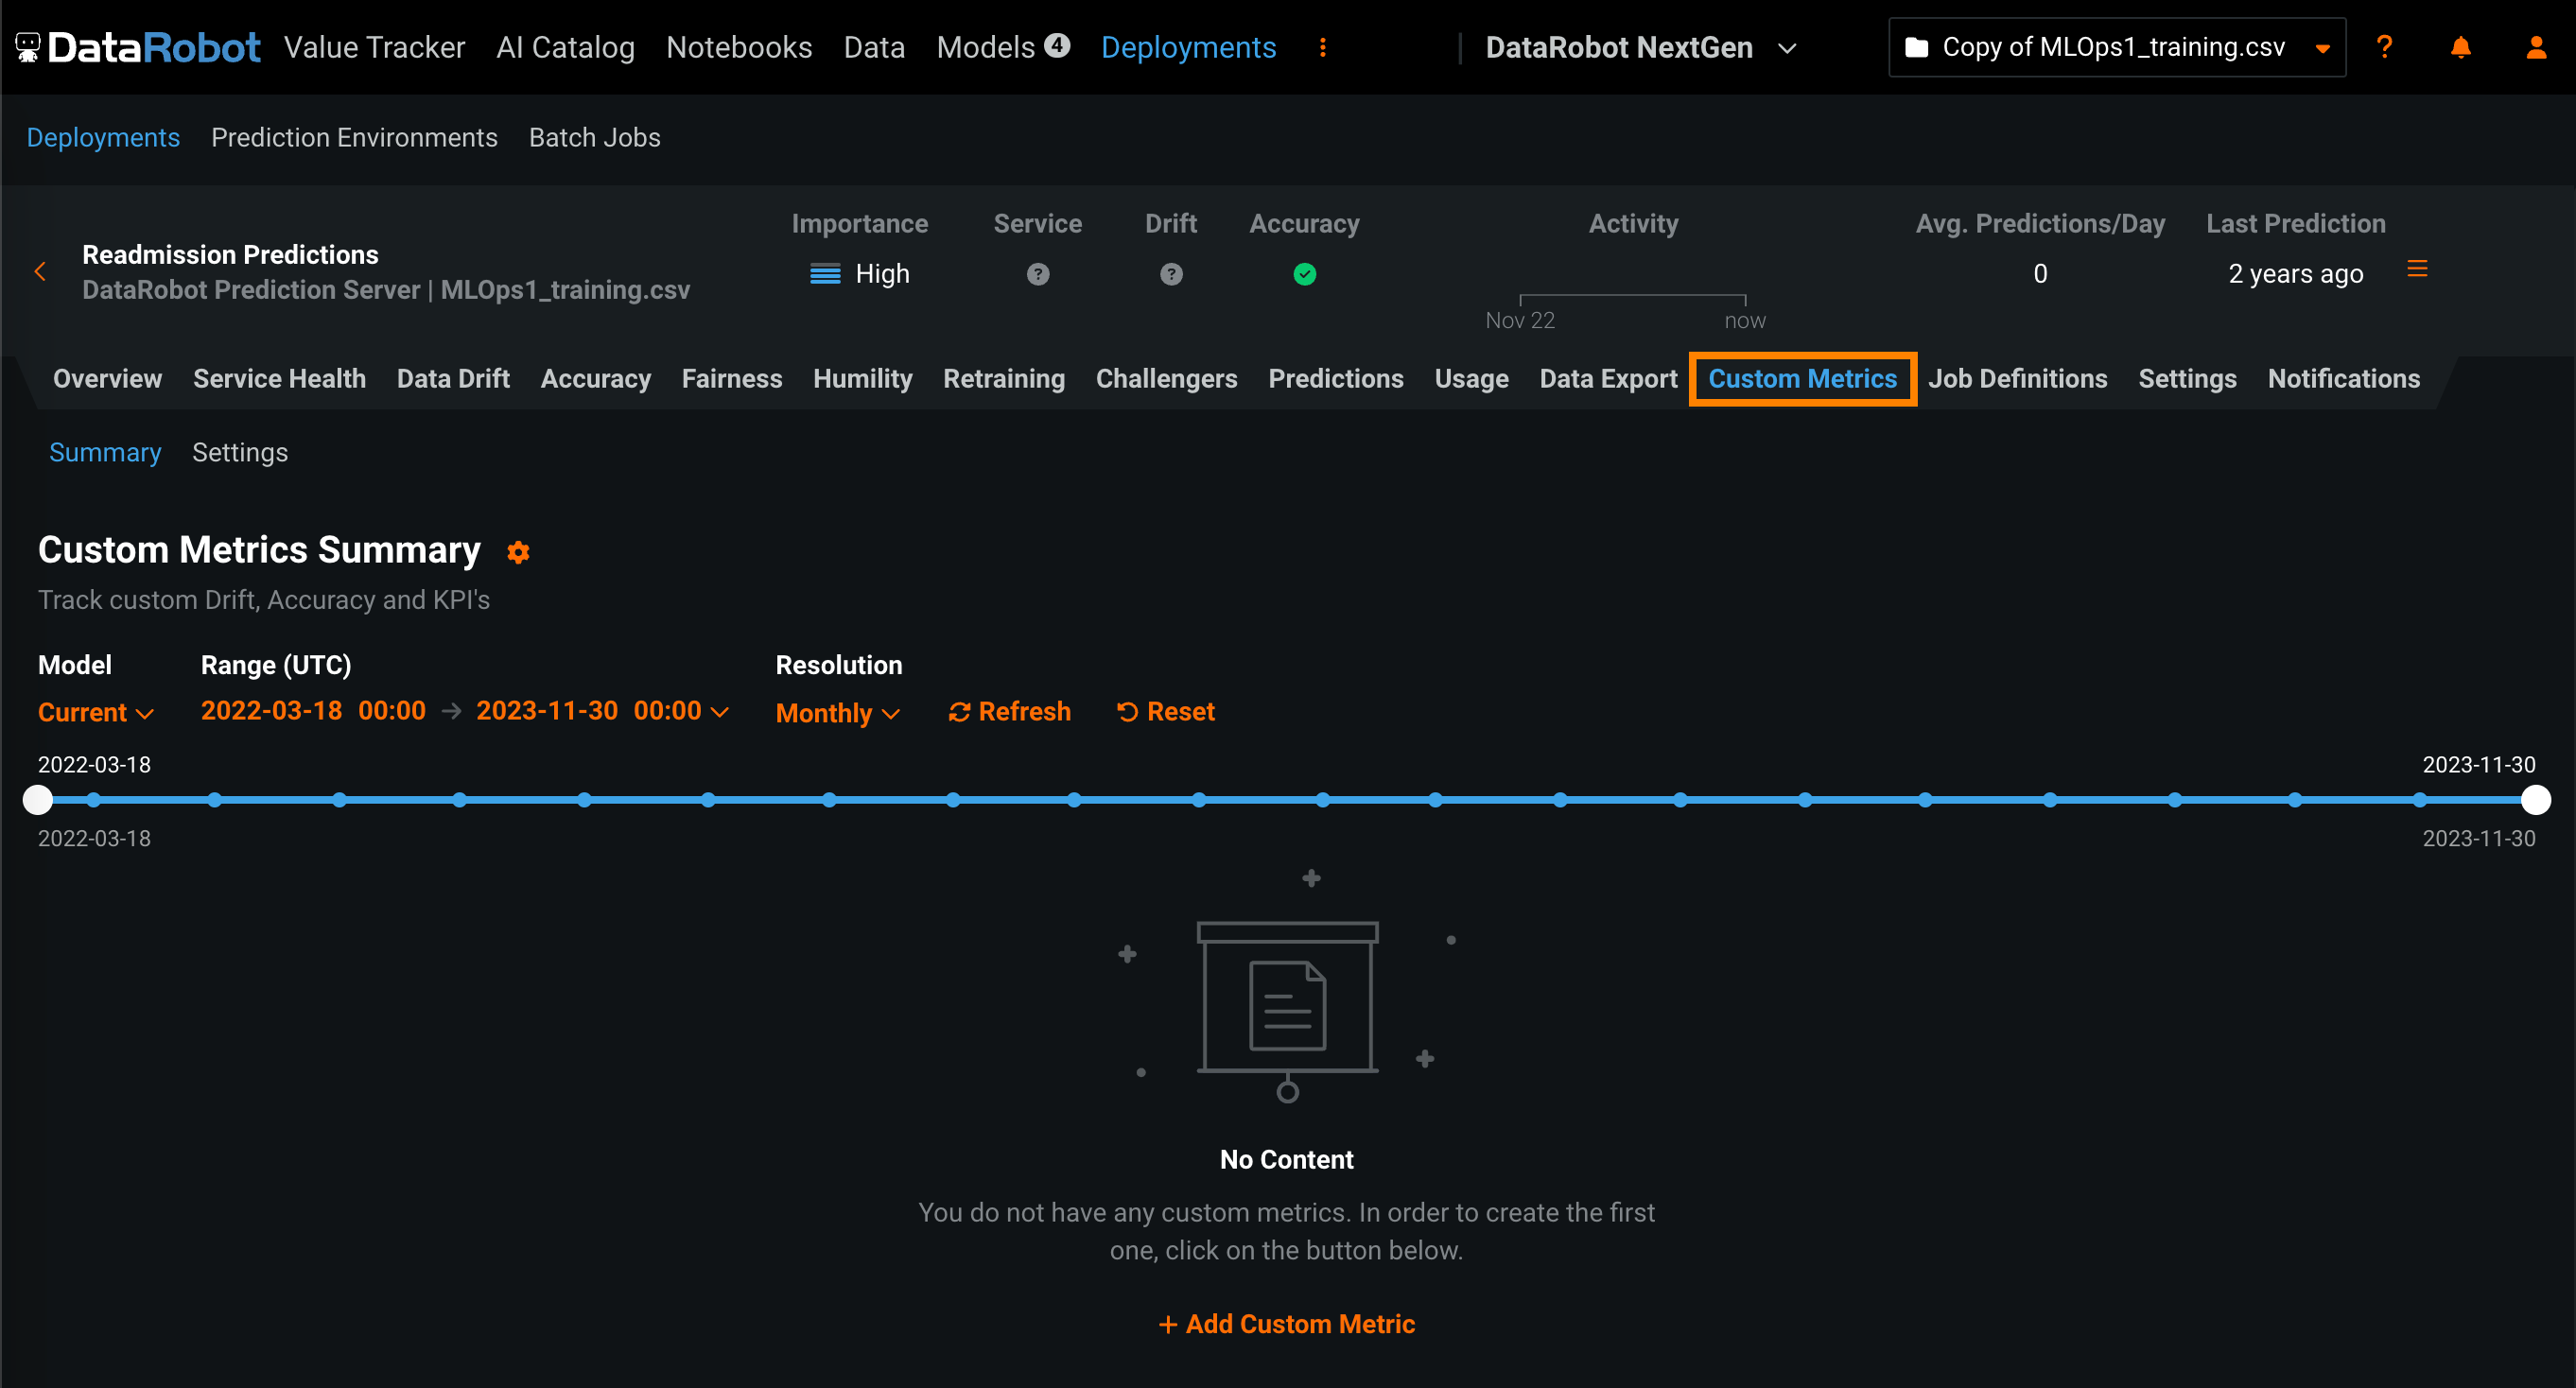
カスタム指標にアクセスするには、上部のナビゲーションバーでデプロイをクリックし、デプロイタブでカスタム指標を作成するデプロイをクリックします。 次に、デプロイで、カスタム指標タブをクリックします。 サマリータブが開きます。
どのようなカスタム指標がサポートされていますか?
3つのタイプのカスタム指標を使用できます。
| カスタム指標の種類 | 説明 |
|---|---|
| 外部カスタム指標 |
|
| ホストされたカスタム指標 |
|
| ホストされたカスタム指標テンプレート |
|
外部カスタム指標の追加
カスタム指標タブでは、最大50個の指標を追跡できます。 カスタム指標を追加するには:
-
カスタム指標 > サマリータブで、+ カスタム指標を追加をクリックします。
-
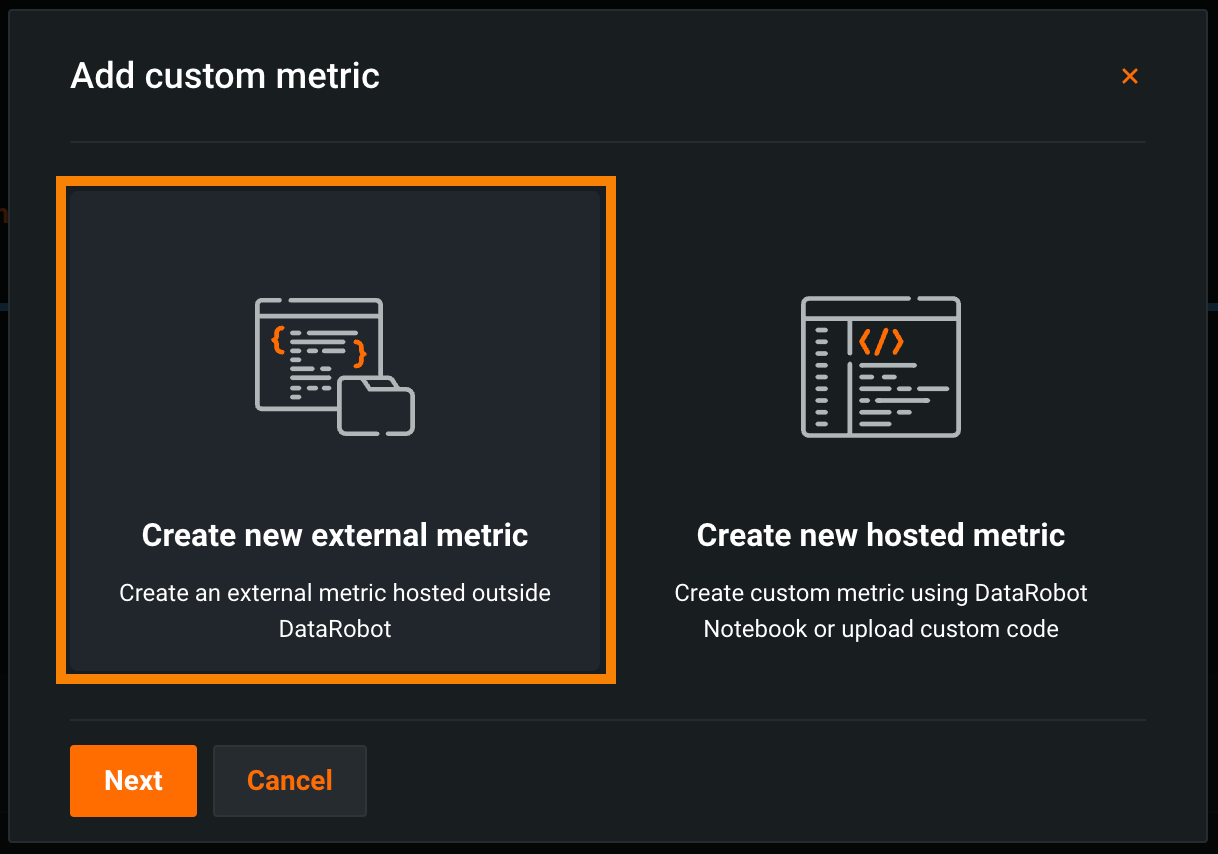
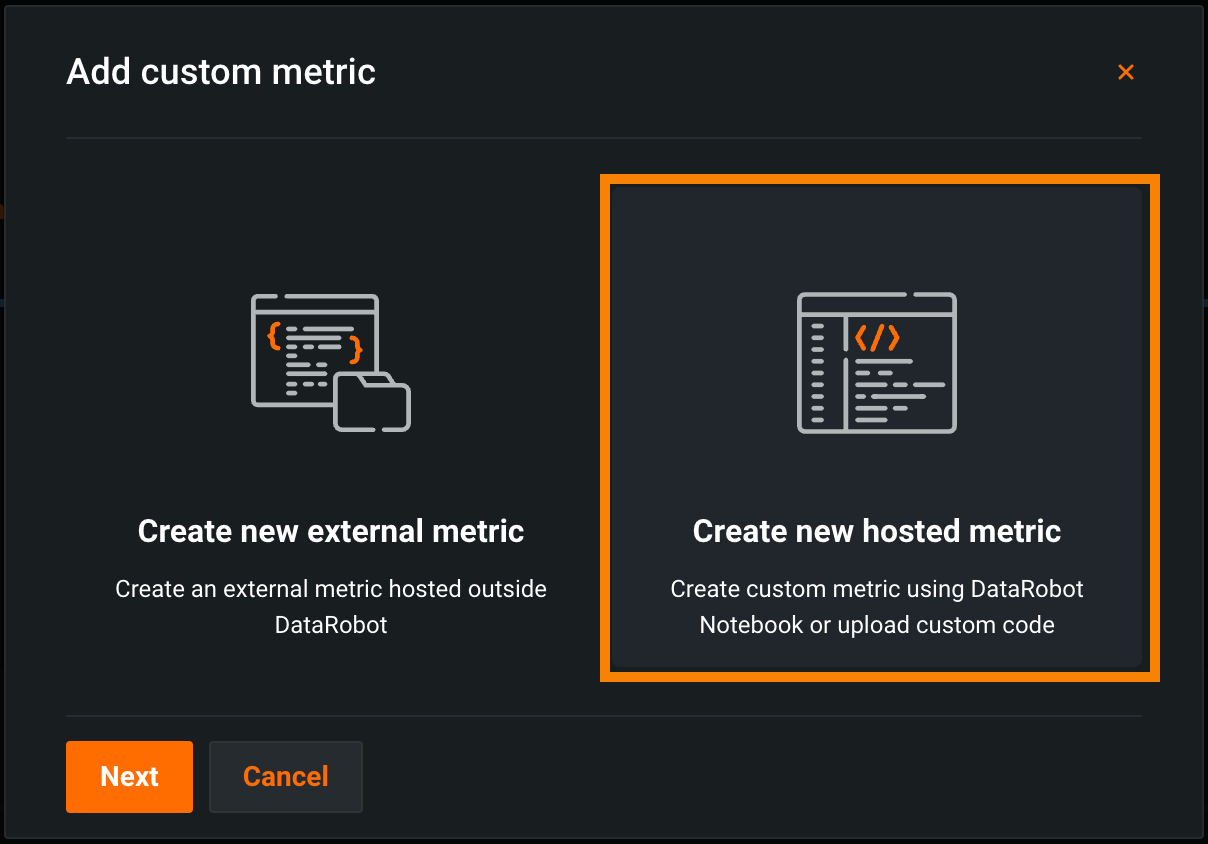
カスタム指標を追加ダイアログボックスで、新しい外部指標を作成をクリックして、次へをクリックします。
-
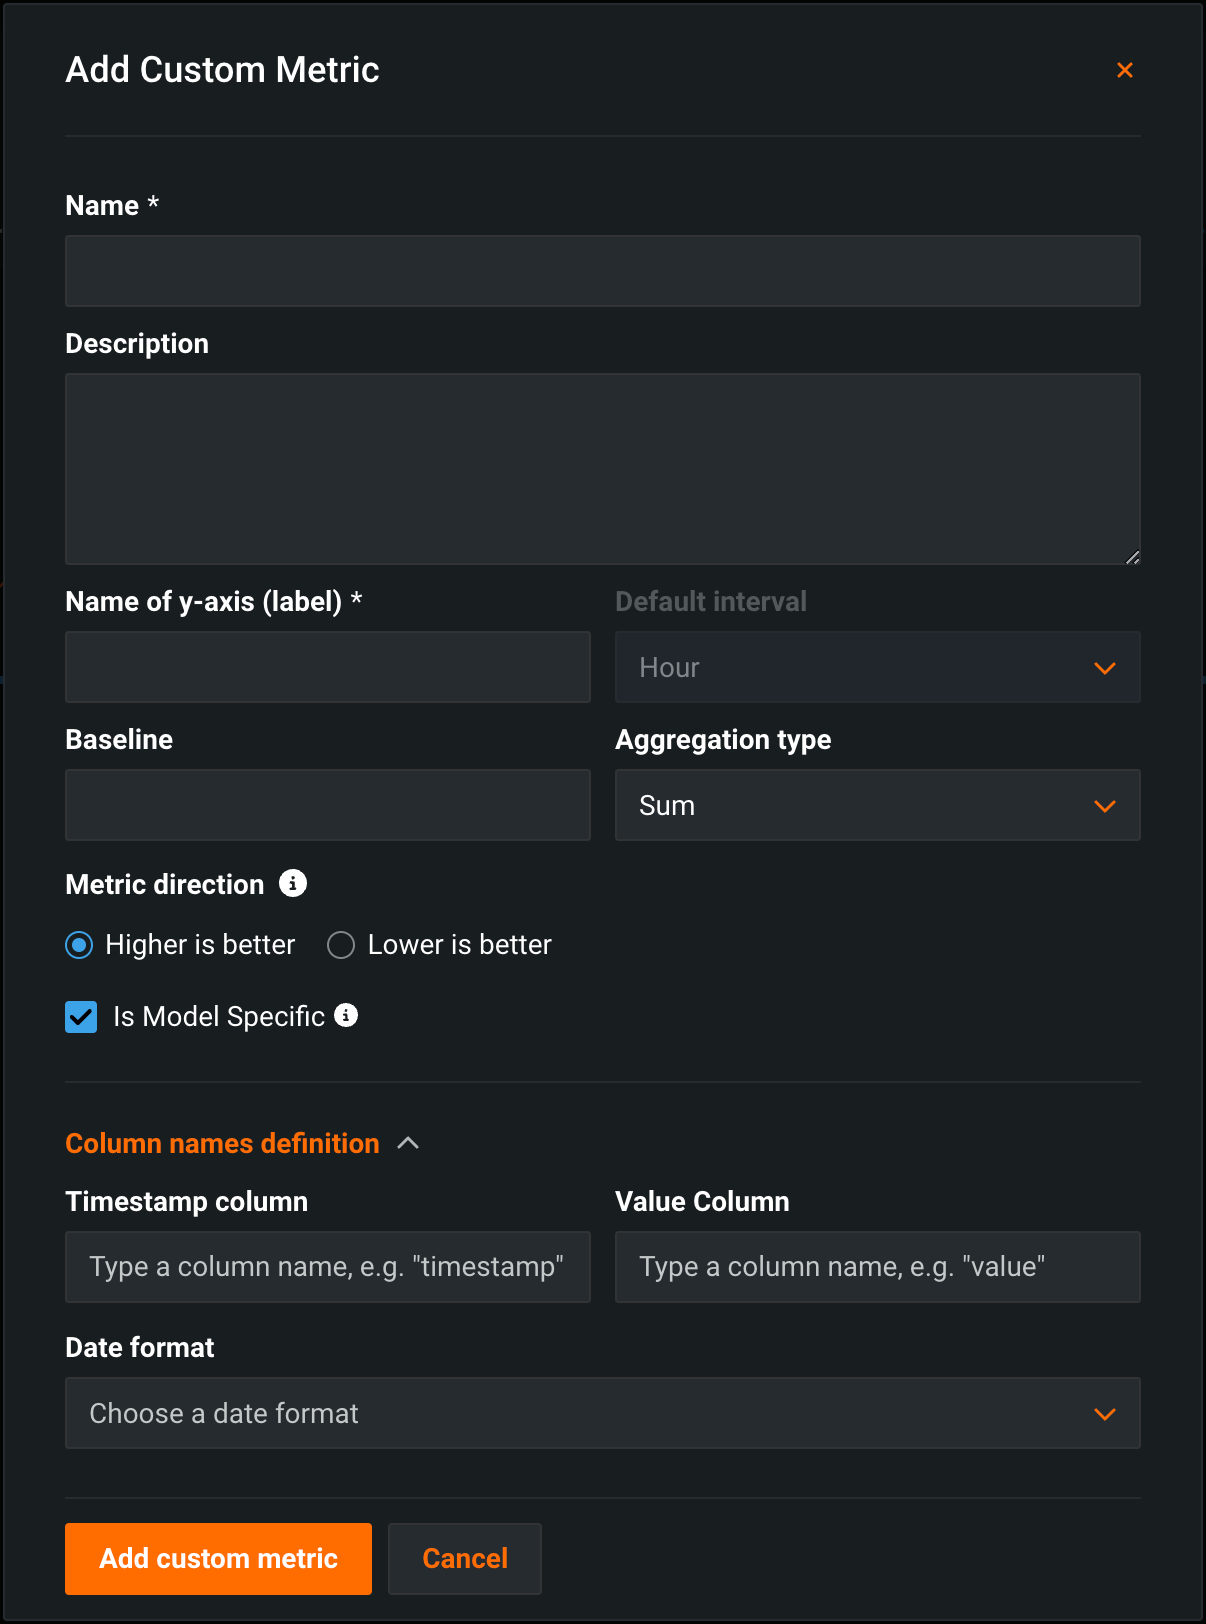
カスタム指標を追加ダイアログボックスで、指標の設定を行います。
フィールド 説明 名前 指標のわかりやすい名前。 この名前は、カスタム指標のサマリーダッシュボードに表示されます。 説明 (オプション)カスタム指標の説明。たとえば、目的、計算方法などを説明することができます。 Y軸の名前 従属変数のわかりやすい名前。 この名前は、カスタム指標のサマリーダッシュボードのカスタム指標のチャートに表示されます。 デフォルトの間隔 選択した集計タイプで使用されるデフォルトの間隔。 時間のみサポートされています。 ベースライン (オプション)x%良い値またはx%悪い値を計算するときに比較の基準として使用する値。 集計タイプ 指標は、合計、平均、またはゲージ(ある時点で測定された明確な値を持つ指標)として計算されます。 指標の方向性 指標の方向性および指標の変更を視覚化する方法を変更します。 大きいほど良いまたは低いほど良いを選択できます。 たとえば、低いほど良いを選択すると、カスタム指標の計算値が10%減少することが、10%改善とみなされ、緑色で表示されます。 モデル固有 この設定を有効にすると、データセットで提供されたモデルパッケージID(登録されているモデルバージョンID)を使用して、指標をモデルにリンクします。 この設定は、値が集計(またはアップロード)される場合に影響します。 以下に例を示します。 - モデル固有(有効):モデル精度の指標はモデル固有であるため、値は完全に別個に集計されます。 モデルを置き換えると、カスタム精度指標のチャートには、置き換え後の日数分のデータのみが表示されます。
- モデル固有ではない(無効): 収益指標はモデル固有ではないため、値はまとめて集計されます。 モデルを置換しても、カスタム収益指標のチャートは変更されません。
列名の定義 タイムスタンプ列 タイムスタンプを含むデータセット内の列。 値列 カスタム指標の計算に使用される値を含むデータセット内の列。 日付形式 (オプション)タイムスタンプ列で使用される日付形式。 備考
カスタム指標にデータをアップロードするときに、列名の定義設定をオーバーライドできます。
-
カスタム指標を追加をクリックします。
カスタム指標にデータをアップロード
カスタム指標を作成した後、データを提供して指標を計算できます。
-
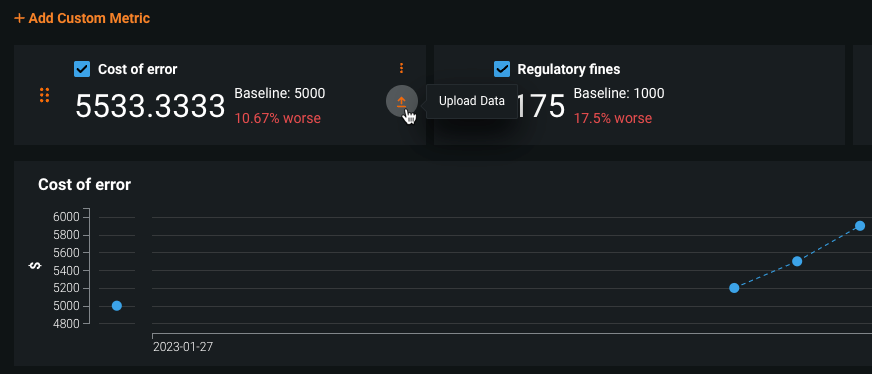
カスタム指標タブで、データをアップロードするカスタム指標を見つけ、データをアップロードするアイコンをクリックします。
-
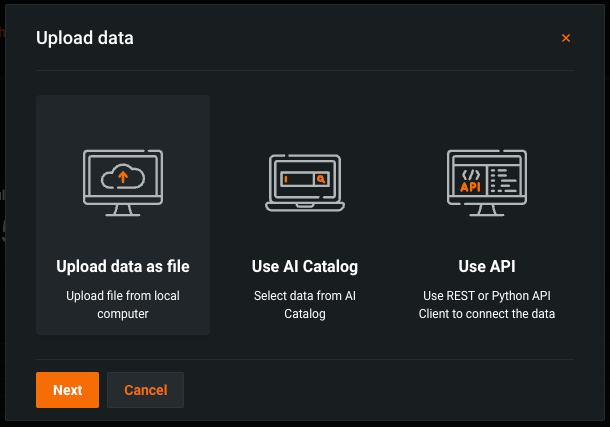
データをアップロードダイアログボックスで、アップロード方法を選択してから、次へをクリックします:
アップロード方法 説明 データをファイルとしてアップロード ファイルを選択ダイアログボックスで、アップロードするファイルをドラッグアンドドロップするか、ファイルを選択 > ローカルファイルをクリックしてローカルファイルシステムを参照し、データを送信をクリックします。 1つのファイルでアップロードできるアップロードサイズは最大10GBです。 AIカタログを使用 AIカタログからデータセットを選択ダイアログボックスで、リストからデータセットをクリックしてから、データセットを選択をクリックします。 AIカタログには、データ探索のデータセットが含まれています。デプロイを作成して設定したら、個々の機能の設定タブを使用して、デプロイ機能を追加または更新することができます。 APIを使用 APIクライアントを使用ダイアログボックスで、クリップボードにコピーをクリックしてから、APIスニペットを変更し、それを使用してデータセットをアップロードします。 1回のAPI呼び出しで最大10,000個の値をアップロードできます。 -
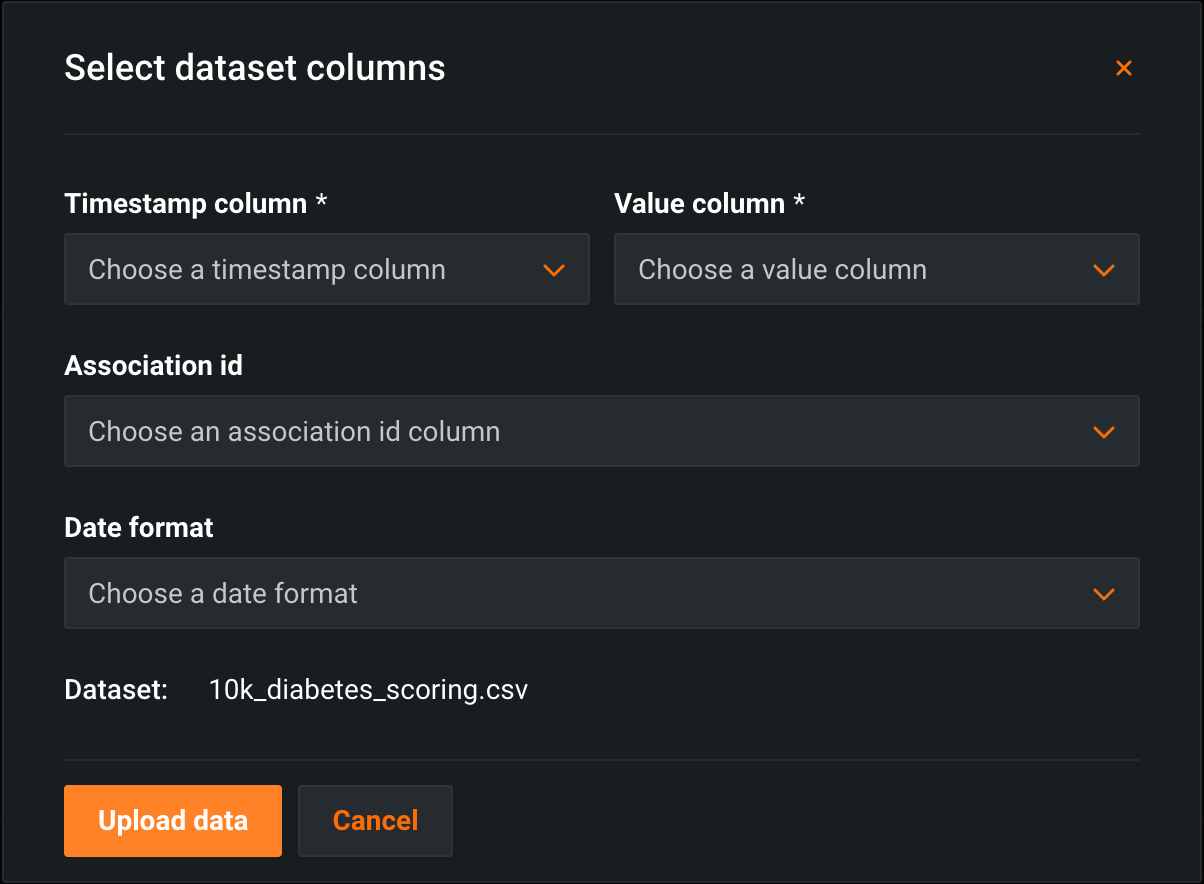
データセット列を選択ダイアログボックスで、以下を設定します。
フィールド 説明 タイムスタンプ列 タイムスタンプを含むデータセット内の列。 値列 カスタム指標の計算に使用される値を含むデータセット内の列。 関連付けID 予測値を実測値にリンクするためにカスタム指標で必要とする関連付けIDを含む行。 日付形式 タイムスタンプ列で使用される日付形式。 -
データをアップロードするをクリックします。
チャットリクエストによるカスタム指標の報告
DataRobotにデプロイされたテキスト生成およびエージェントワークフローのカスタムモデルで、chat()フックを実装する場合、extra_bodyフィールドによって、チャット補完リクエスト内で直接カスタム指標値を報告できます。 これにより、チャットリクエストを行うと同時にカスタム指標を報告することができ、データを別々にアップロードする必要はありません。
手動でのチャットリクエスト作成
OpenAIクライアントは、extra_bodyパラメーターの内容を、チャットPOSTリクエストのJSONペイロード内の上位レベルフィールドに変換します。 OpenAIクライアントを使用せずに手動でチャットペイロードを作成する場合は、ペイロードの最上位に“datarobot_metrics": {…}を含めます。
チャットリクエストでカスタム指標を報告するには:
-
デプロイに関連付けID列が定義され、モデレーションが設定されていることを確認します。 これらは、カスタム指標を処理するために必要です。
-
外部カスタム指標の追加の説明に従って、カスタム指標タブでカスタム指標を定義します。
-
OpenAIクライアントを使用してチャット補完リクエストを行う場合、
extra_bodyフィールドにdatarobot_metricsを含め、報告する指標の名前と値を入力します。
from openai import OpenAI

openai_client = OpenAI(
    base_url="https://<your-datarobot-instance>/api/v2/deployments/{deployment_id}/",
    api_key="<your_api_key>",
)

extra_body = {
    # These values pass through to the LLM
    "llm_id": "azure-gpt-6",
    # If set here, replaces the auto-generated association ID
    "datarobot_association_id": "my_association_id_0001",
    # DataRobot captures these for custom metrics
    "datarobot_metrics": {
        "field1": 24,
        "field2": 25
    }
}

completion = openai_client.chat.completions.create(
    model="datarobot-deployed-llm",
    messages=[
        {"role": "system", "content": "Explain your thoughts using at least 100 words."},
        {"role": "user", "content": "What would it take to colonize Mars?"},
    ],
    max_tokens=512,
    extra_body=extra_body
)

print(completion.choices[0].message.content)
カスタム指標の要件
datarobot_metricsの各名前に一致するカスタム指標が、デプロイですでに定義されている必要があります。- この方法で報告されるカスタム指標値は、数値である必要があります。
- デプロイされたカスタムモデルには、指標を処理するために、関連付けID列が定義され、モデレーションが設定されている必要があります。
関連付けIDの指定方法など、チャットリクエストでのextra_bodyの使用の詳細については、chat()フックのドキュメントを参照してください。
ホストされたカスタム指標の追加
DataRobotはデプロイに カスタム指標を提供し、カスタムビジネスまたはパフォーマンス指標を計算および監視します。 ホストされたカスタム指標を使用すると、組織専用の指標を最大5つデプロイに実装できるだけでなく、DataRobot Notebooksを使用してコードをアップロードしてホストし、他のデプロイに簡単にカスタム指標を追加できます。
カスタム指標数の上限
デプロイごとに最大50個のカスタム指標を設定でき、その50個のうち5個をホストされたカスタム指標にすることができます。
時系列のサポート
DataRobotモデル指標(DMM)ライブラリは、時系列モデル、特に時系列モデルの データエクスポートをサポートしていません。 データのエクスポートと取得には、 DataRobot APIクライアントを使用します。
カスタム指標のホストを開始するには:
-
カスタム指標タブで、+ カスタム指標を追加をクリックします。
-
カスタム指標を追加ダイアログボックスで、ホストされた指標を新規作成をクリックして、次へをクリックします。
-
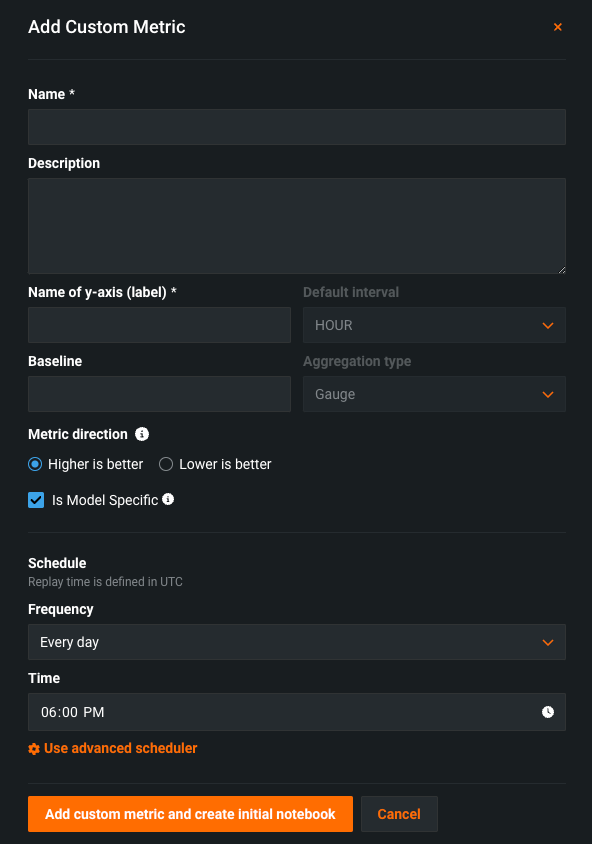
カスタム指標を追加ダイアログボックスで、指標の設定を行います。
フィールド 説明 名前 (必須)指標のわかりやすい名前。 この名前は、カスタム指標のサマリーダッシュボードに表示されます。 説明 カスタム指標の説明。たとえば、目的、計算方法などを説明することができます。 Y軸の名前 (必須)従属変数のわかりやすい名前。 この名前は、カスタム指標のサマリーダッシュボードのカスタム指標のチャートに表示されます。 デフォルトの間隔 選択した集計タイプで使用されるデフォルトの間隔を決定します。 時間のみサポートされています。 ベースライン x%良い値またはx%悪い値を計算するときに比較の基準として使用する値を決定します。 集計タイプ 指標を合計、平均、またはゲージ(単一時点で測定された明確な値を持つ指標)として計算するかどうかを決定します。 指標の方向性 指標の方向性を決定し、指標の変更を視覚化する方法を変更します。 大きいほど良いまたは低いほど良いを選択できます。 たとえば、低いほど良いを選択すると、カスタム指標の計算値が10%減少することが、10%改善とみなされ、緑色で表示されます。 モデル固有のものです この設定を有効にすると、データセットで提供されたモデルパッケージID(登録されているモデルバージョンID)を使用して、指標をモデルにリンクします。 この設定は、値が集計(またはアップロード)される場合に影響します。 以下に例を示します。 - モデル固有(有効):モデル精度の指標はモデル固有であるため、値は別個に集計されます。 モデルを置き換えると、カスタム精度指標のチャートには、置き換え後の日数分のデータのみが表示されます。
- モデル固有ではない(無効): 収益指標はモデル固有ではないため、値はまとめて集計されます。 モデルを置換しても、カスタム収益指標のチャートは変更されません。
スケジュール カスタム指標に値が入力されるタイミングを定義します。 頻度(1時間ごと、1日ごと、1か月ごとなど)と時間を選択します。 詳細なスケジューリングオプションを使用するには、高度なスケジューラーを使用するを選択します。 -
ノートブックからカスタム指標を追加をクリックします。
カスタムジョブによるカスタム指標のテスト
本機能の提供について
ホストされたカスタム指標のノートブックは、デフォルトではオフになっています。 この機能を有効にする方法については、DataRobotの担当者または管理者にお問い合わせください。
機能フラグ:Notebooksでカスタム環境を有効にする
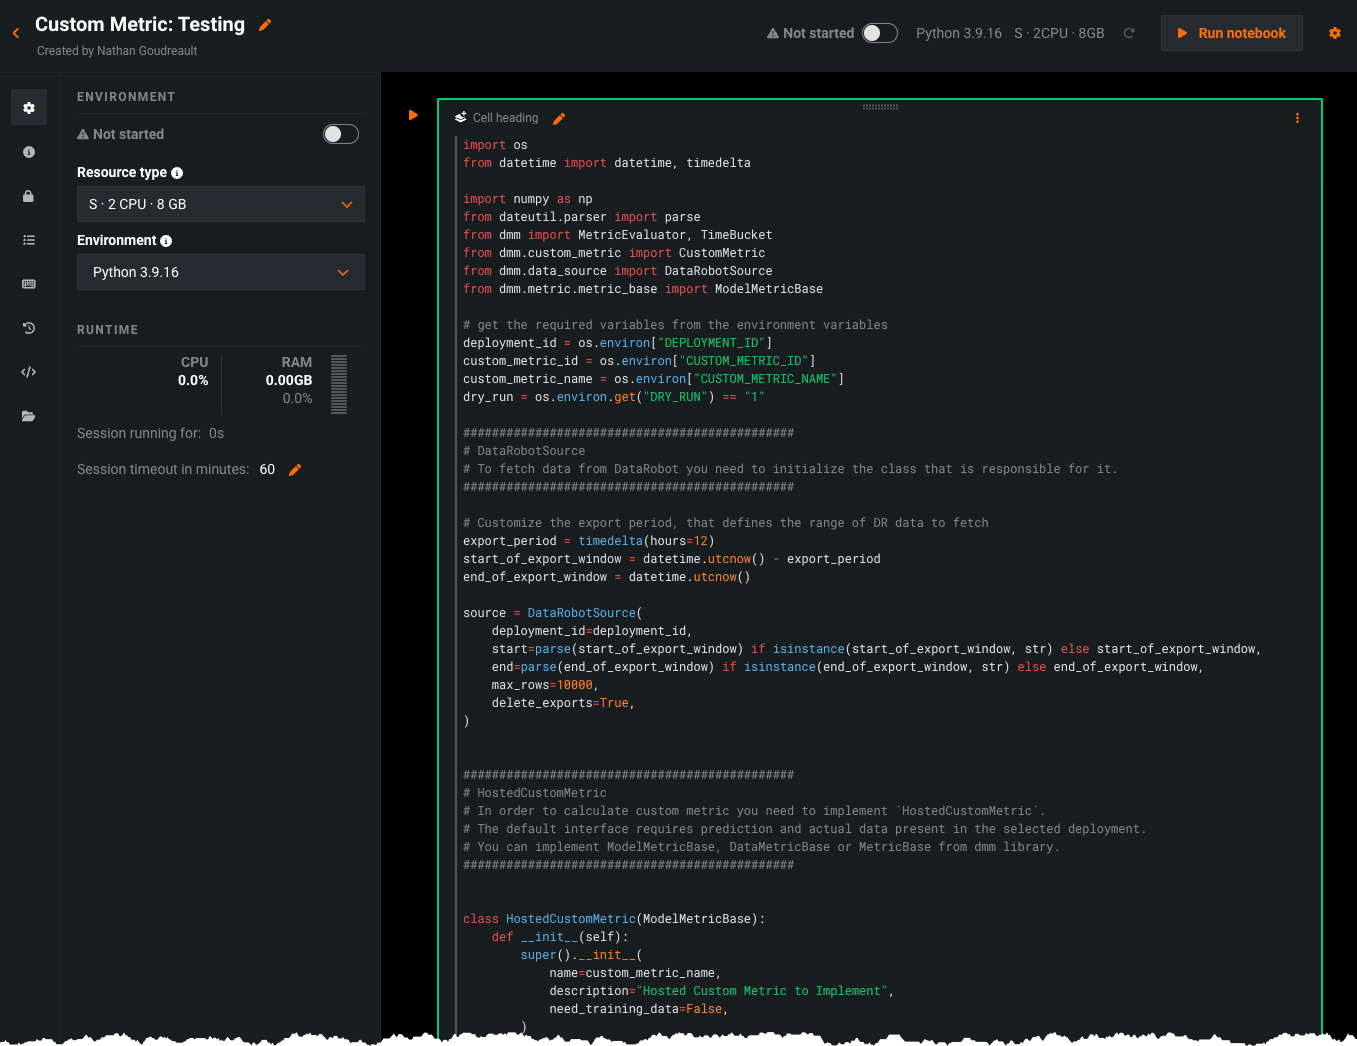
カスタム指標を設定すると、そのコードを含むノートブックがロードされます。 ノートブックには、1つのカスタム指標セルが含まれています。これは、指標のエクスポート方法と計算方法を定義するPythonコード、スコアリング用のコード、および指標を設定するコードを含む、一意のタイプのノートブックセルです。
必要に応じて、カスタム指標セルのコードを変更します。 次に、セルの下部にあるカスタム指標コードをテストをクリックして、コードをテストします。 テストではカスタムジョブが作成されます。
- テストが正常に実行された場合、カスタム指標コードをデプロイをクリックして、カスタム指標をデプロイに追加します。
- コードが正しく実行されない場合、テスト完了後に、カスタム指標コードのテストに失敗しましたという警告が表示されます。
カスタム指標コードのトラブルシューティング
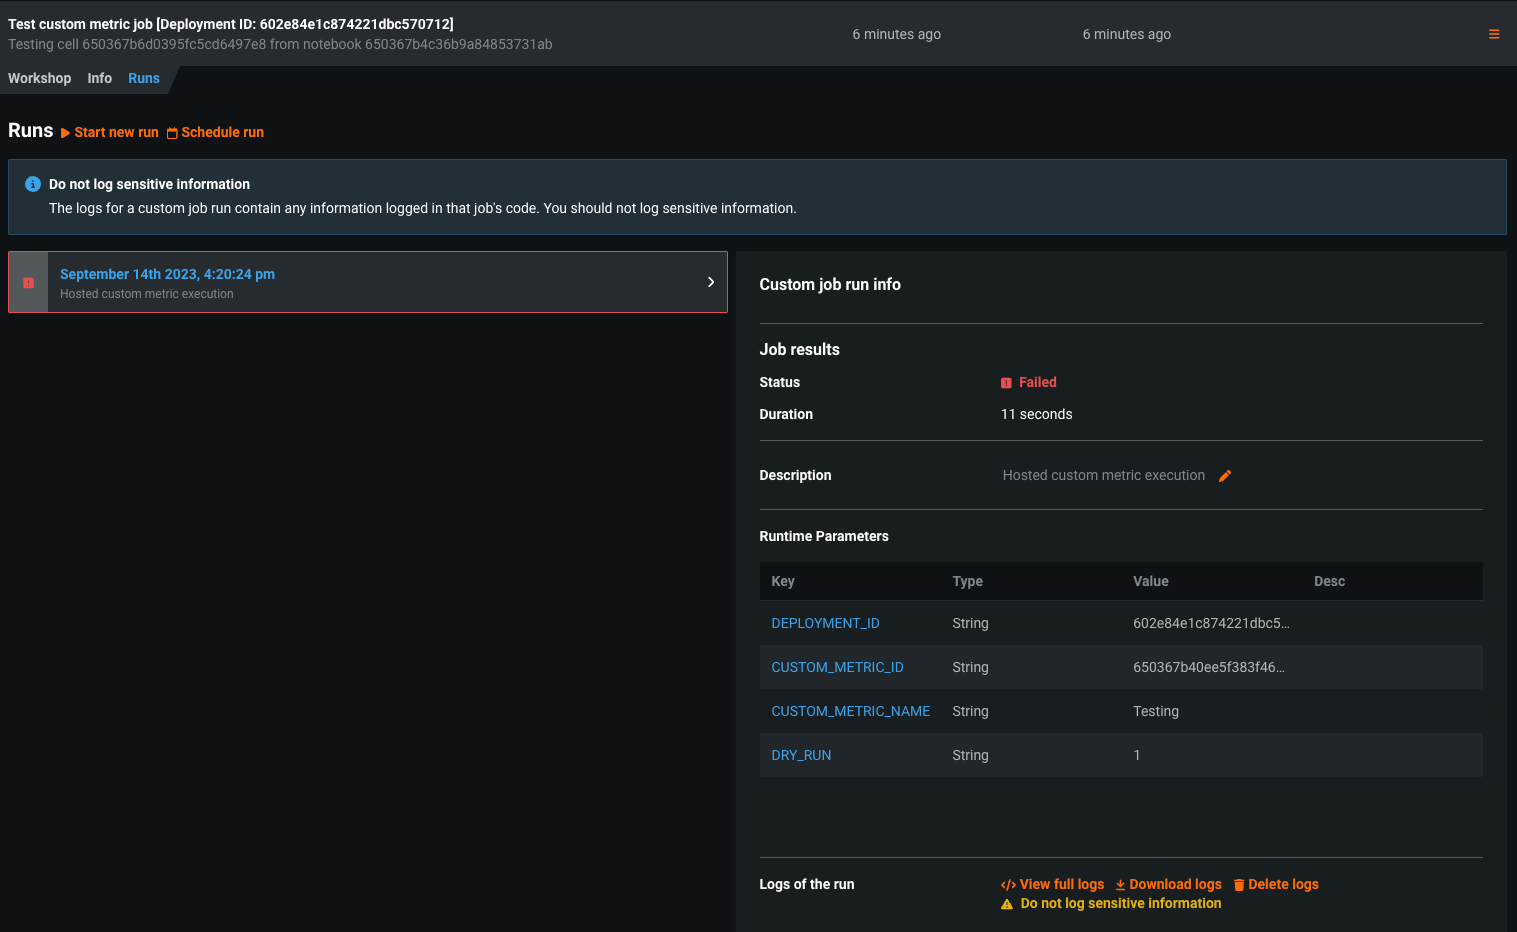
カスタム指標のコードをトラブルシューティングするには、モデルレジストリに移動して、カスタムジョブタブを選択し、テストのために実行されたカスタムジョブにアクセスします。 ジョブの実行タブには、失敗したテストのログが含まれています。このログは、完全なログを表示を選択して参照できます。
失敗したテストのトラブルシューティングを行うには、失敗した各テストのログを参照することをお勧めします。 さらに、カスタムジョブのインターフェイスでは、ワークショップタブから実行をスケジュールするを選択して、カスタム指標のスケジュールを変更できます。
カスタム指標の管理
カスタム指標ダッシュボードでは、カスタム指標を追加した後、それらの編集、並べ替え、または削除ができます。
指標の編集または削除
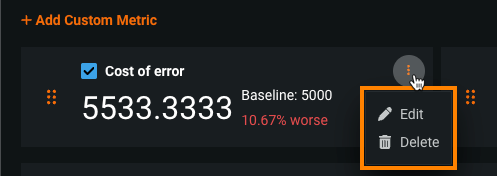
指標を編集または削除するには、カスタム指標タブで、管理したいカスタム指標を探し、アクションメニュー をクリックします。
-
指標を編集するには、編集をクリックし、変更可能な設定を更新して、カスタム指標を更新をクリックします。
-
指標を削除するには、削除をクリックします。
指標の並べ替えまたは非表示
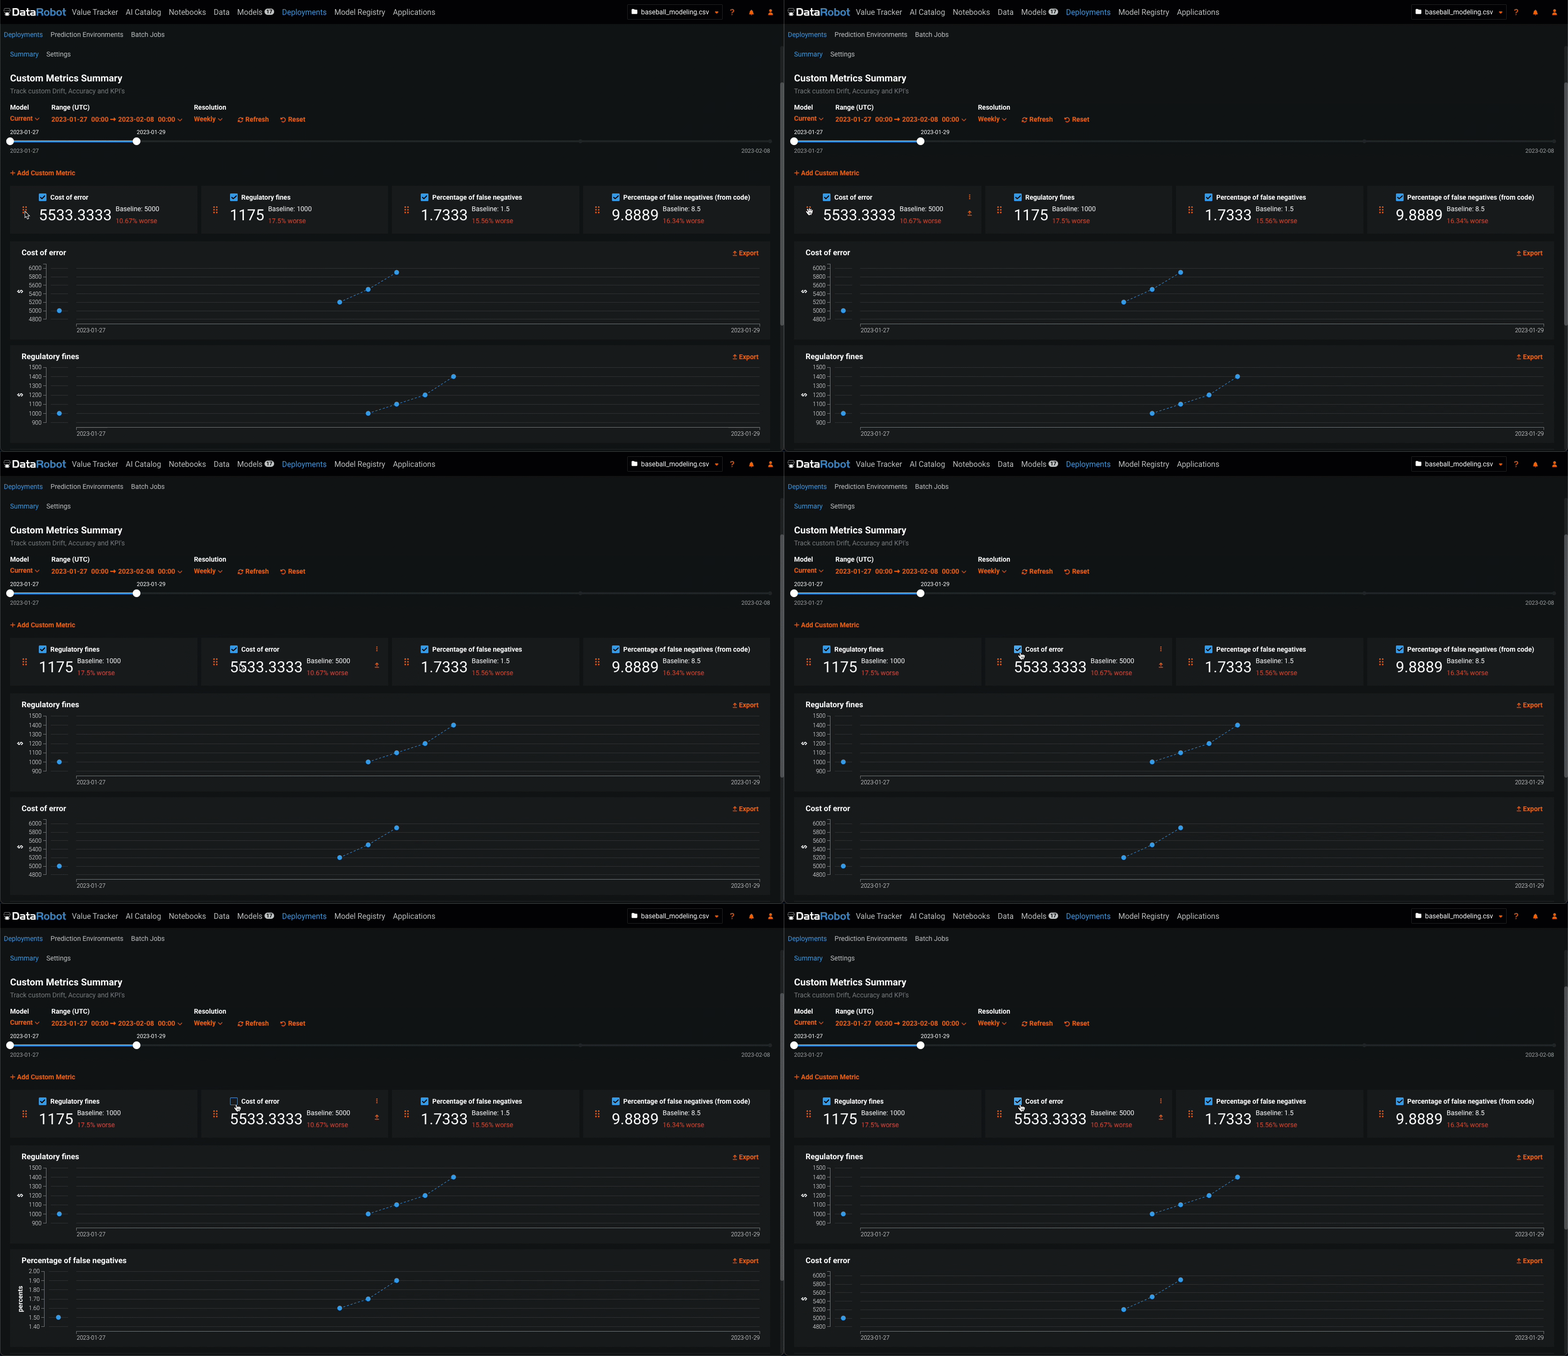
カスタム指標のサマリーダッシュボードで指標を並べ替えたり非表示にしたりするには、移動または非表示にするカスタム指標を見つけます。
-
指標のチャートを非表示にするには、指標名の横にあるチェックボックスをオフにします。
カスタム指標ダッシュボードの表示設定
以下の設定を行い、ダッシュボードに表示するカスタム指標の計算を指定します。
評価とモデレーションのカスタム指標には関連付けIDが必要
評価とモデレーションを設定するときに追加された指標について、カスタム指標タブでデータを表示するには、デプロイされたLLMを介して予測を開始する前に、関連付けIDを設定して予測ストレージを有効にします。 関連付けIDを設定せず、LLMの予測とともに関連付けIDを指定した場合、モデレーションの指標は カスタム指標タブでは計算されません。 この設定は、デプロイ 中やデプロイ 後に有効化できます。
| 設定 | 説明 | |
|---|---|---|
| 1 | モデル | カスタム指標を表示するデプロイのモデル(現在または以前)を選択します。 |
| 2 | 範囲 (UTC) | カスタム指標を表示する期間の開始日と終了日を選択します。 |
| 3 | 単位 | 日付スライダーの時間単位を選択します。 選択した時間範囲に基づき、単位を毎時、毎日、毎週、毎月から選択します。 時間範囲が7日を超える場合、単位を毎時にすることはできません。 |
| 4 | 表示を更新 | カスタム指標ダッシュボードを更新します。 |
| 5 | リセット | カスタム指標ダッシュボードの表示設定をデフォルトに戻します。 |
