ウィジェット
アプリケーションは、視覚的でインタラクティブな目的駆動型のエンドユーザーアプリケーションを作成するウィジェットで構成されています。
ウィジェットには主に2つのカテゴリーがあります。
- デフォルトのウィジェットは、テンプレートに関係なくすべてのアプリケーションに含まれ、通常は削除できません。
- オプションのウィジェットを追加することで、特定のユースケースに合わせてアプリケーションをカスタマイズできます。 視覚化の追加、インサイトの表示、コンテンツのフィルターといったオプションのウィジェットは、アプリケーションを使用する前にすべて設定する必要があります。 ウィジェットが設定されていない場合または正しく設定されていない場合、DataRobotにエラーメッセージが表示されます。
以下のタブでは、各ウィジェットタイプについて詳しく説明します。
アプリケーションには、予測を行い、予測結果を表示するための以下の デフォルトウィジェットが、自動的に含まれています。 時系列アプリケーションでは、デフォルトウィジェットのセットが異なることに注意してください。
| ウィジェット | 説明 |
|---|---|
| データを追加 | 予測ファイルをアップロードできます。 |
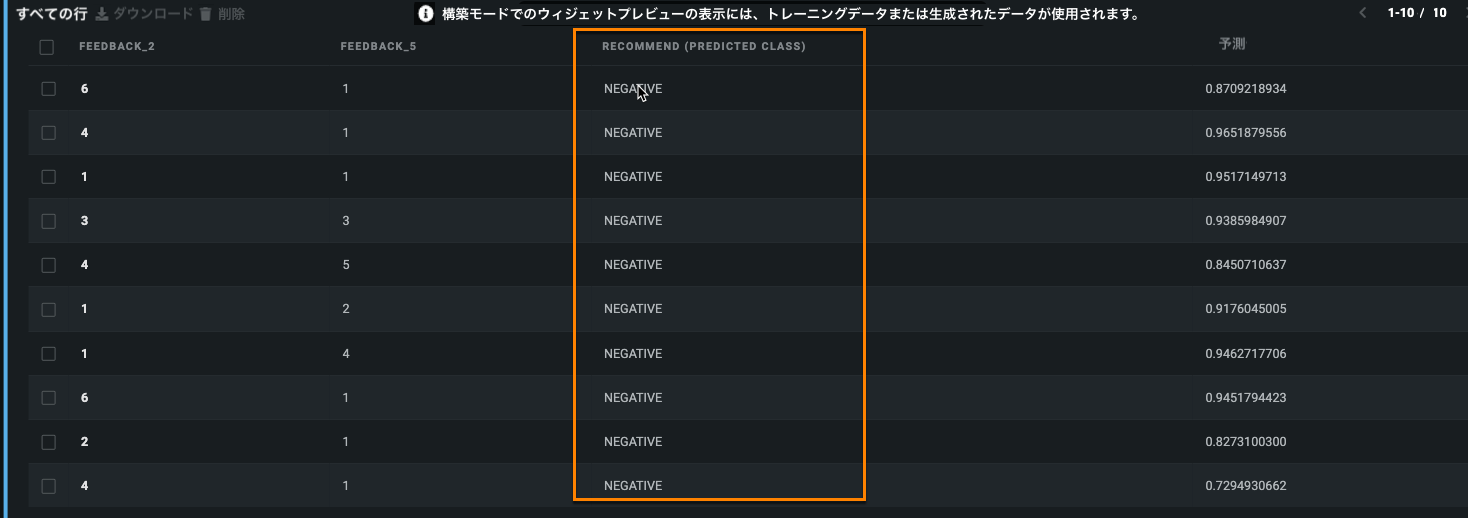
| すべての行 | 行ごとに予測履歴を表示します。 |
| 新しい行の追加 | 単一レコードの予測を行うことができます。 |
| 全般情報 | 必ずしも結果に影響を与えない、予測ごとに表示する特徴量値を表示します。 |
| 予測情報 | 予測に影響を与える可能性のある特徴量値と、予測の説明を表示します。 |
| 予測の説明 | 予測結果を含むチャートと予測の説明を含む表を表示します。 |
フィルターウィジェットは、アプリケーション内で追加のフィルタリングオプションを提供します。 次の表に、使用可能なフィルターウィジェットを示します。
| ウィジェット | 説明 |
|---|---|
| カテゴリー | 1つ以上のカテゴリー特徴量でフィルターします。 |
| 日付 | 日付特徴量でフィルターします。 |
| 数字 | 数値特徴量でフィルタリングされます。 ウィジェットのプロパティで最小値と最大値を定義する必要があります。 |
チャートウィジェットは、アプリケーションに視覚化を追加し、データと予測結果の重要なインサイトを明らかにするように設定できます。 次の表に、使用可能なチャートウィジェットを示します。
| ウィジェット | 説明 |
|---|---|
| 折れ線 | 選択した特徴量の折れ線グラフを表示します—傾向の視覚化、データの分布の理解、より大きなデータセットの値の比較、および値セット間の関係性の把握に役立ちます。 |
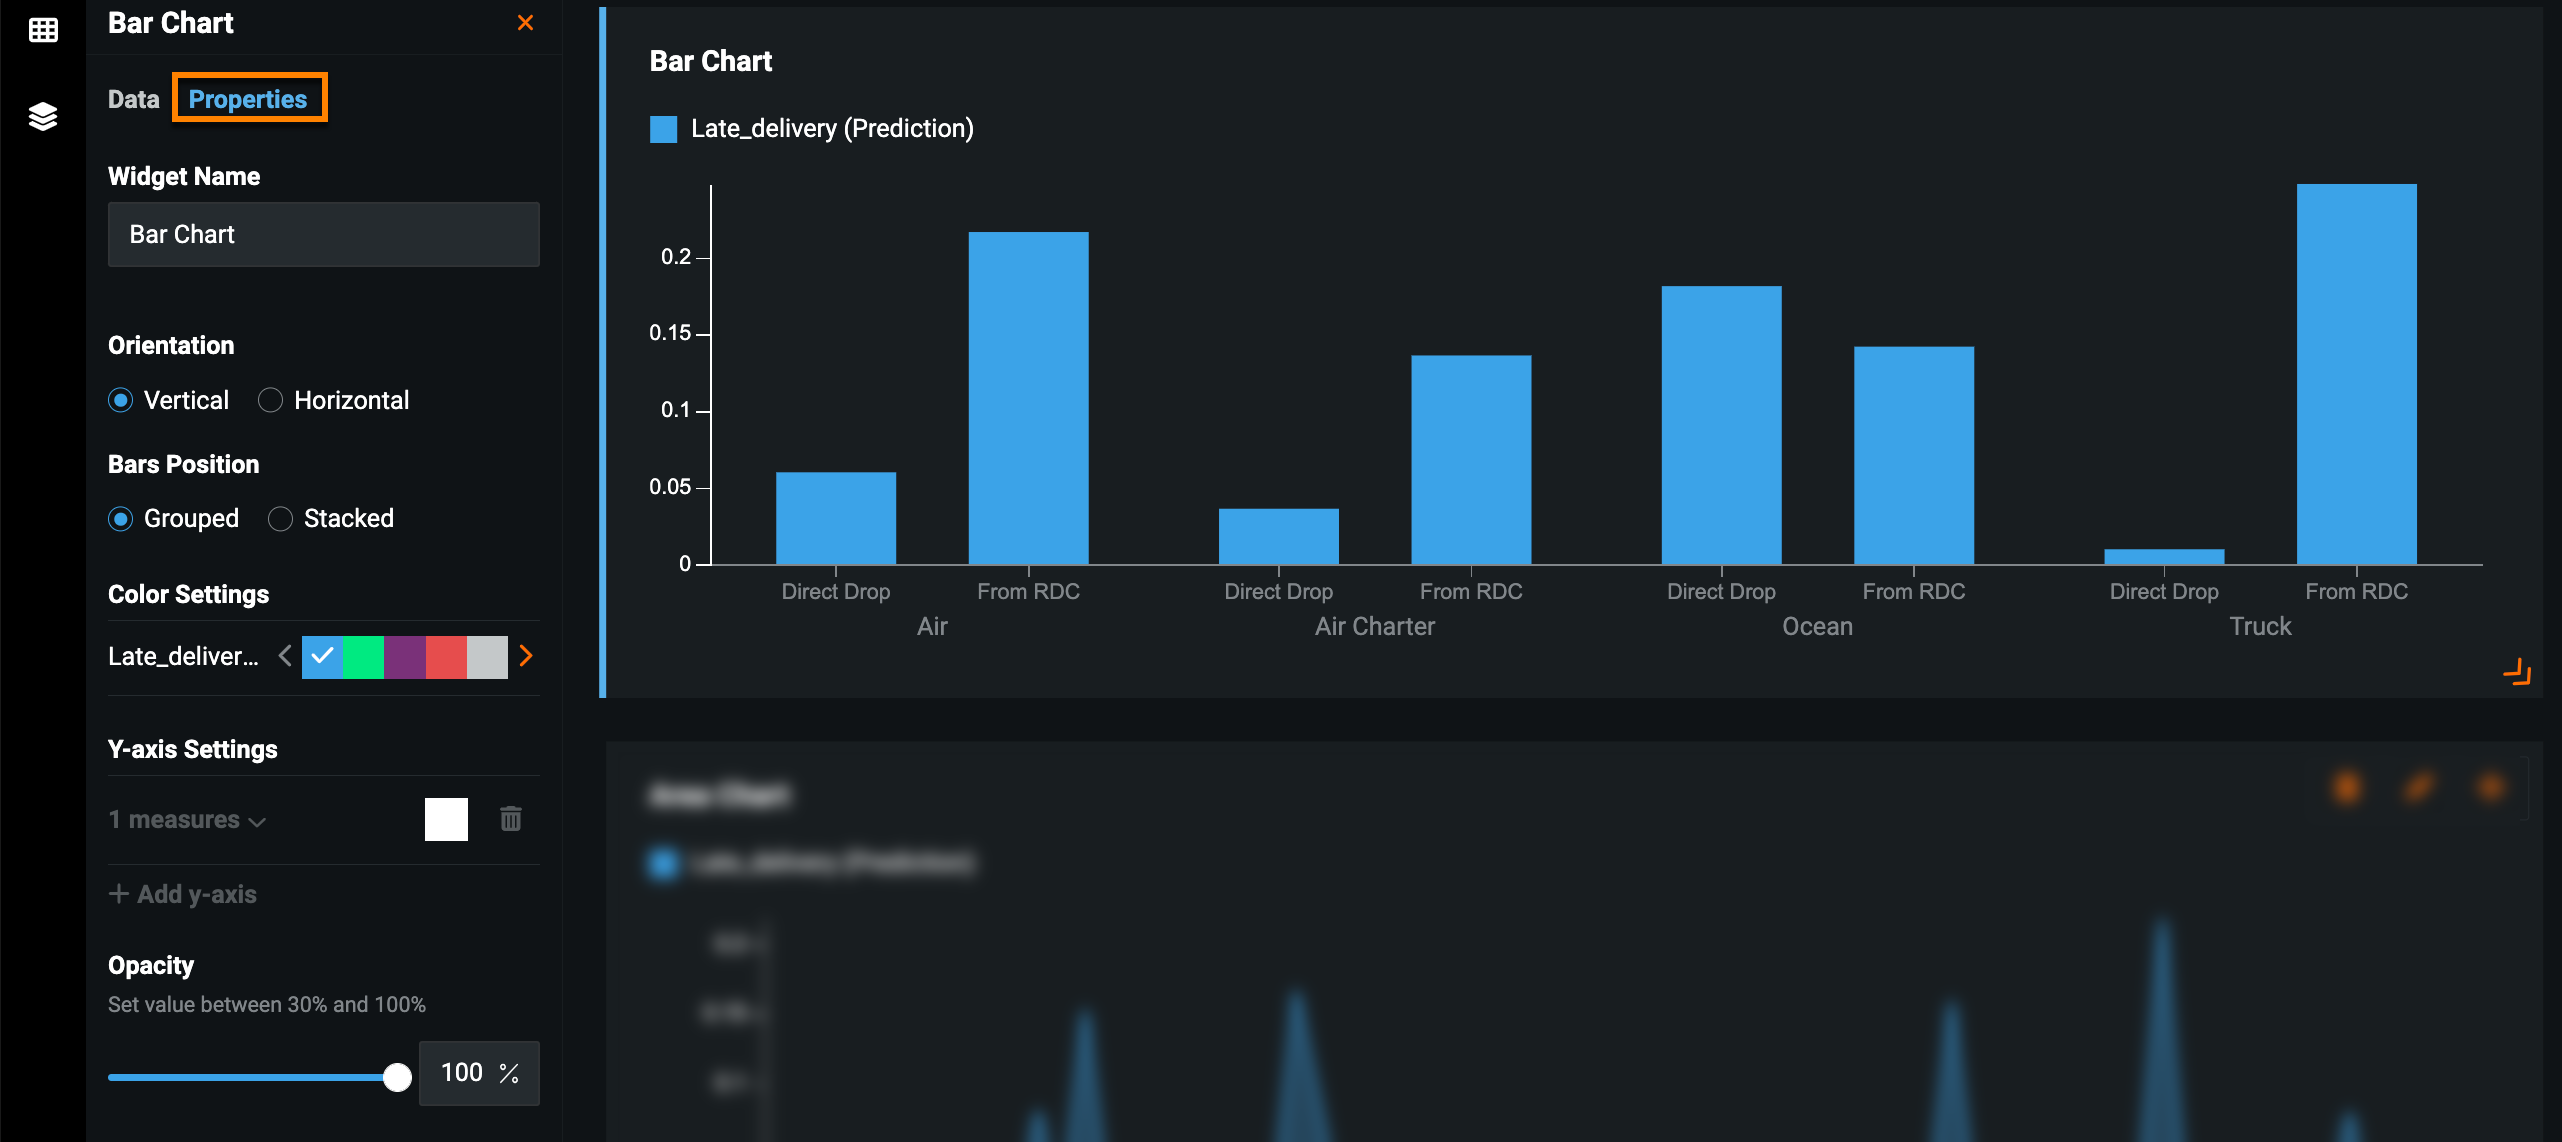
| 棒 | 選択した特徴量の棒グラフを表示します—データの分布を理解し、小さなデータセットの値を比較するのに役立ちます。 |
| 折れ線と棒 | 選択した特徴量の折れ線グラフと棒グラフを表示します。 この2つの切り替えは開いているアプリケーションで行えます。 |
| 面 | 選択した特徴量の面グラフを表示します—データの構成を視覚化するのに役立ちます。 |
| 円 | 1つのディメンションと1つのメジャーに基づいた円グラフを表示します—データの構成、特に各部分が全体とどのように比較されるかを視覚化するのに役立ちます。 |
| 単一の値 | 選択した特徴量の平均値を表示します。 |
What-Ifと最適化ウィジェットは、シナリオ比較ツール、シナリオ最適化ツール、または予測結果とやり取りするための2つのツールを提供することでその両方にすることができます。
このウィジェットの初期設定は、 アプリの作成中に選択されたテンプレートに基づいています。
ウィジェットの追加
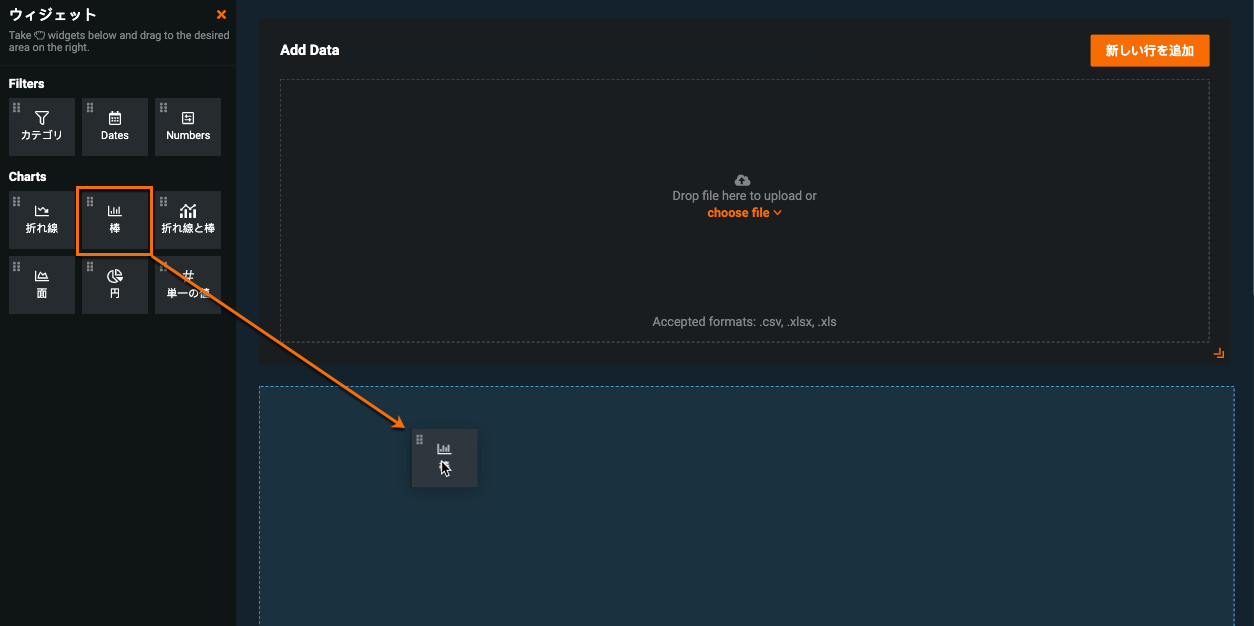
アプリケーションにウィジェットを追加するには、左上にあるウィジェットメニュー![]() をクリックし、ウィジェットを左側のペインからキャンバスにドラッグアンドドロップします。
をクリックし、ウィジェットを左側のペインからキャンバスにドラッグアンドドロップします。
ウィジェットの設定
ウィジェットを設定するには、クリックして選択するか、ウィジェットにカーソルを合わせて鉛筆アイコンをクリックします。 選択すると、左側にパネルが開き、以下に説明するタブが表示されます。
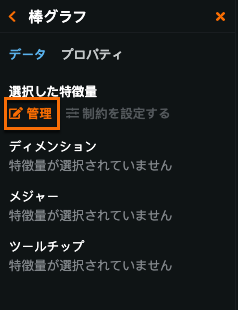
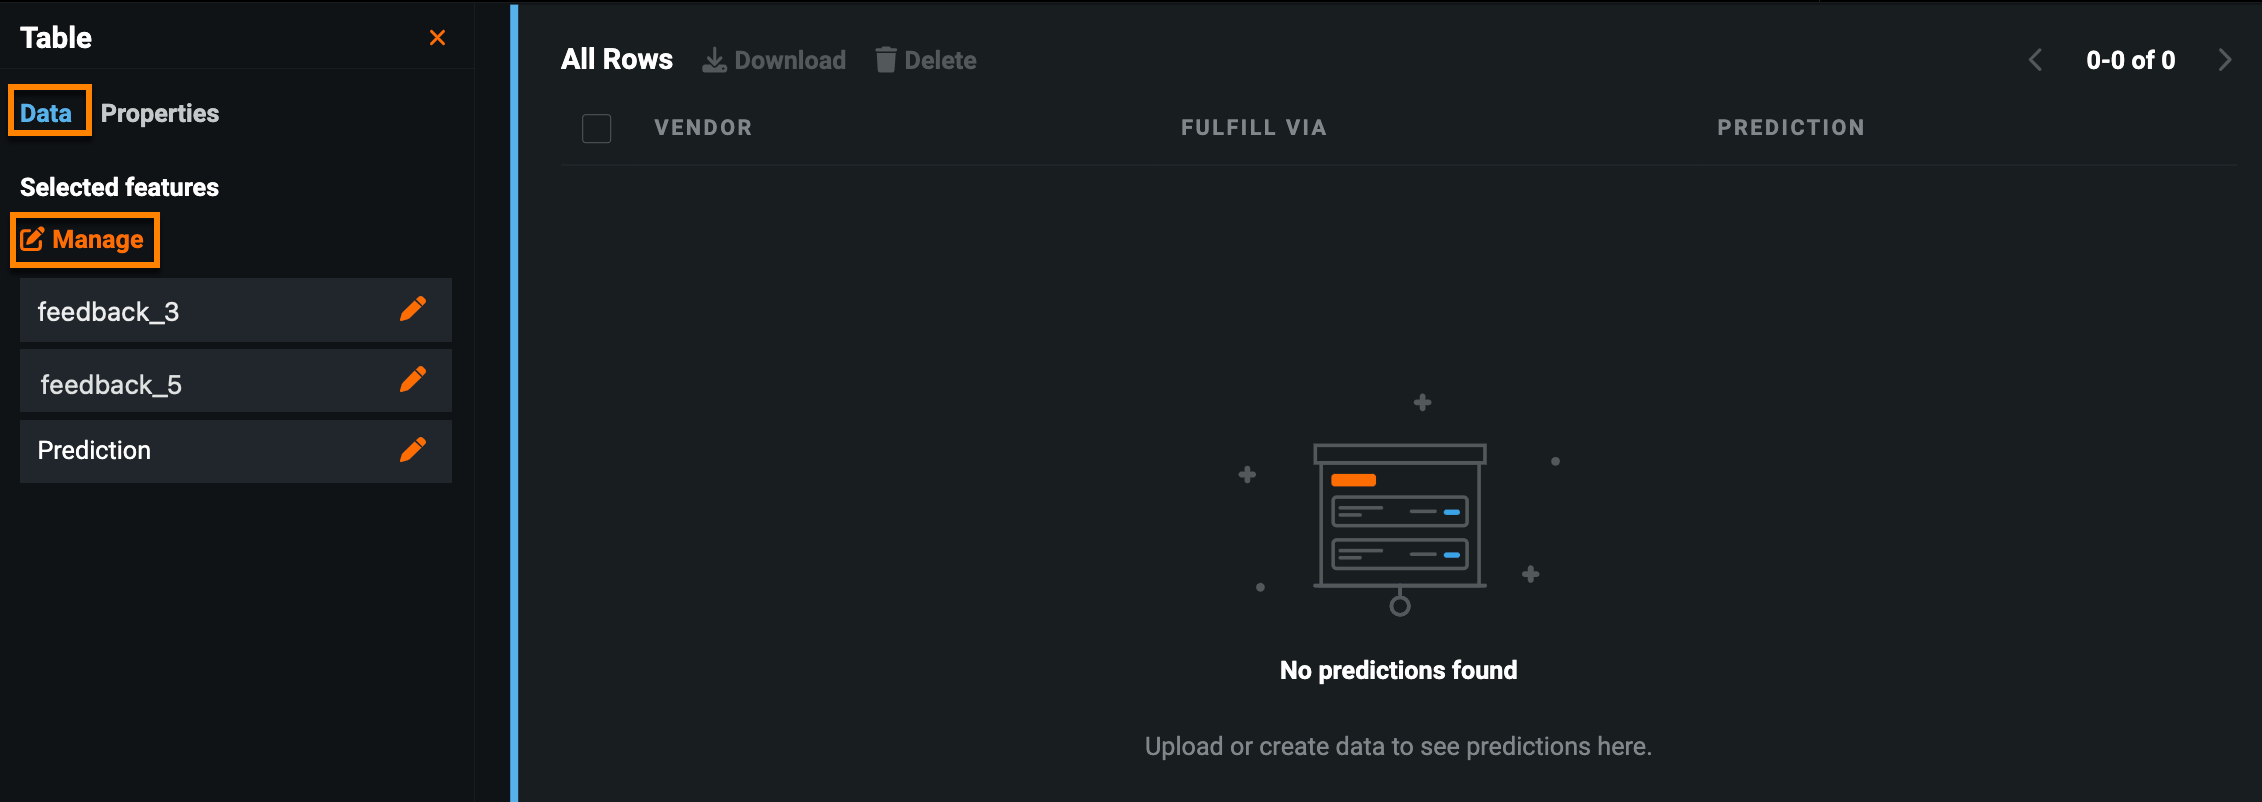
データタブでは、特徴量の追加と削除、特徴量の表示名の変更、制約の設定といったウィジェットの機能を管理できます。
| 名前 | 要素 | 説明 |
|---|---|---|
| 1 | 管理 | ウィジェットで特徴量を追加または削除し、ツールチップを追加します。 |
| 2 | 制約を設定する | 数値的な制約やカテゴリー特徴量の特定の値によって決められた範囲内の値のみを含めるようにアプリに指示する特徴量制約を追加します。 |
| 3 | ディメンション / メジャー | ディメンションとメジャーで現在選択されている特徴量を表示します。 ウィジェットでの特徴量の表示名を変更するには、鉛筆アイコンをクリックします。 |
| 4 | ツールチップ | 現在の特徴量名と、管理対象の特徴量ウィンドウに手動で追加したツールチップを表示します。 |
備考
設定オプションは、ウィジェットとプロジェクトタイプに基づきます。たとえば、多クラスプロジェクトには、What-Ifと最適化ウィジェットのための追加パラメーターが含まれます。
カスタマイズオプションの完全なリストについては、 デフォルトのウィジェットまたは オプションのウィジェットも参照してください。
ウィジェット特徴量の管理
ウィジェット特徴量の設定は重要であり、多くの場合、アプリケーションを設定するときに必要な手順です。 このコントロールは、たとえば、チャートウィジェットの視覚化や、単一レコードの予測を行うときに使用可能な特徴量を制御します。
多くのウィジェットでは、ディメンションと特徴量の両方を選択する必要があります。
- ディメンション: データの詳細を分類して明らかにするために使用する定量的な値を含む特徴量。
- 測定値: 測定可能な数値、定量値を備えた特徴量。
ウィジェット特徴量を管理するには:
- ウィジェットを選択し、左側のパネルのデータタブをクリックします。
-
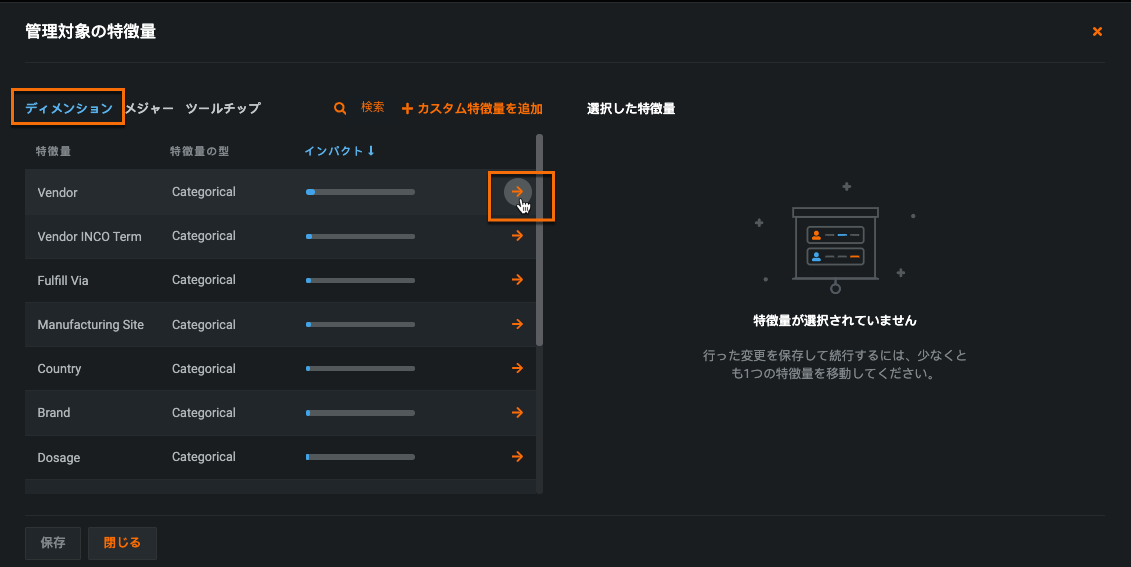
管理をクリックします。 特徴量の管理ウィンドウが表示されます。
-
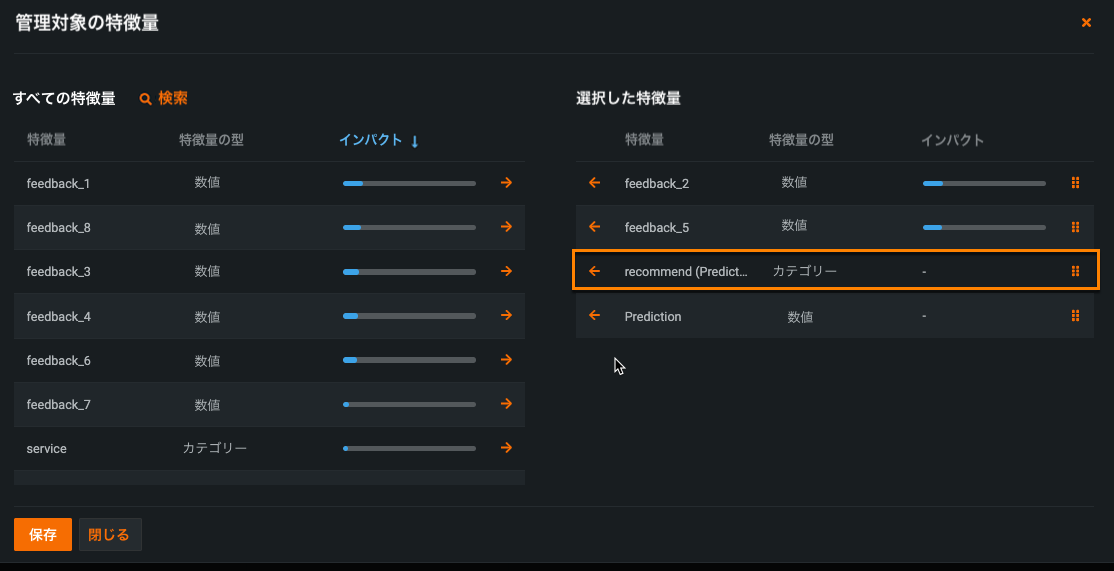
次元タブで、X軸で視覚化したい1つまたは複数の特徴量の横にあるオレンジ色の矢印をクリックします。 カテゴリー、日付、およびブール特徴量を選択できます。
-
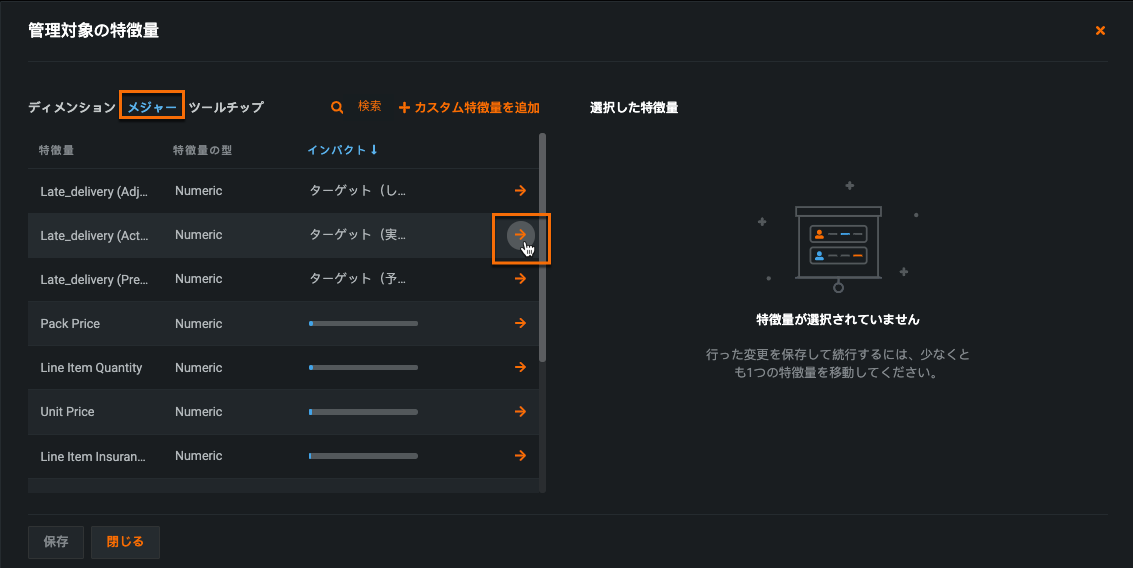
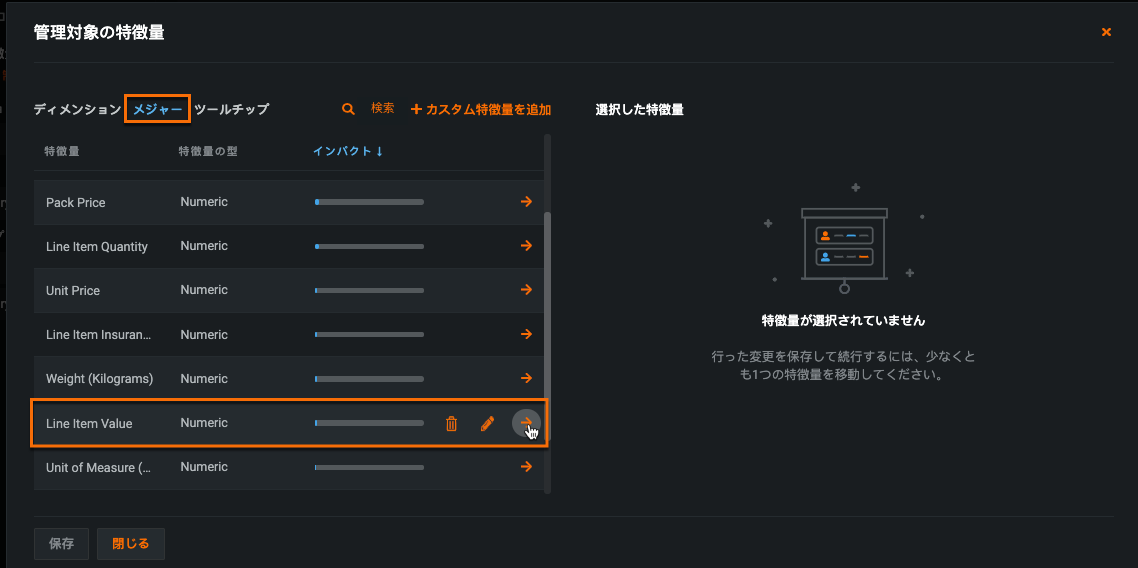
測定をクリックし、Y軸で測定したい特徴量の横にある矢印をクリックします。 測定タブは、数値とカスタム特徴量のみを表示します。
-
保存をクリックして設定を適用します。
備考
ウィジェットを設定するには、少なくとも1つのディメンションと1つのメジャーを選択する必要があります(単一値ウィジェットを除く)。
ウィジェットに「有効なデータがない」という黄色のエラーメッセージが表示された場合、アプリケーションはトレーニングデータにアクセスできません。 AIカタログのデータセットからプロジェクトを作成する必要があります。
カスタム特徴量
主要なDataRobotプラットフォームで特徴量の変換と同様に、アプリケーションでチャートウィジェットのカスタム特徴量を作成できます。
-
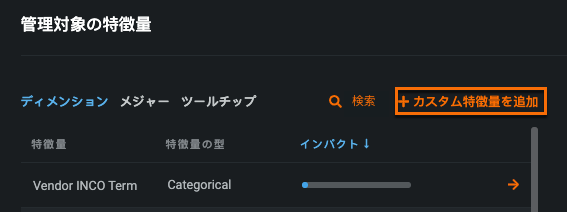
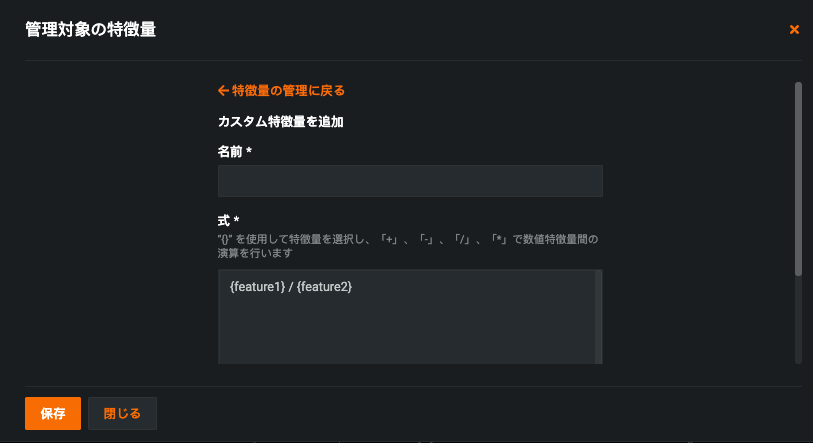
特徴量の管理ウィンドウで、カスタム特徴量を追加をクリックします。
-
カスタム特徴量に名前を付け、サポートされている構文を使用して関数と特徴量を入力します。 次の例は、キログラムごとの出荷コストを測定します。
-
作成をクリックします。 カスタム特徴量は、特徴量の管理ウィンドウの測定タブに表示されます。
備考
数値特徴量だけを使用してカスタム特徴量式を作成できます。
多クラスプロジェクトでの予測クラスの追加
多クラスプロジェクトでは、予測クラスフィールドをすべての行ウィジェットに追加できます。
