サービスの正常性と精度の履歴
本機能の提供について
デフォルトでは、サービスの正常性と精度に関するデプロイ履歴はオフになっています。 この機能を有効にする方法については、DataRobotの担当者または管理者にお問い合わせください。
機能フラグ:デプロイ履歴を有効にする
デプロイを分析する際、 サービスの正常性と 精度は、現在デプロイされているモデルと以前にデプロイされたモデルのパフォーマンスに関する重要な情報を提供することができます。 ところが、チャートが個別に表示され、スケールはデータに合わせて調整されるため、これらのモデルを比較することは難しい場合があります。 サービスの正常性と精度の比較の利便性を向上させるために、 サービスの正常性 > 履歴タブと 精度 > 履歴タブ(現在はプレビュー機能)では、現在のモデルと以前にデプロイされたモデルを、1つの場所かつ同じスケールで比較できます。
サービス正常性の履歴
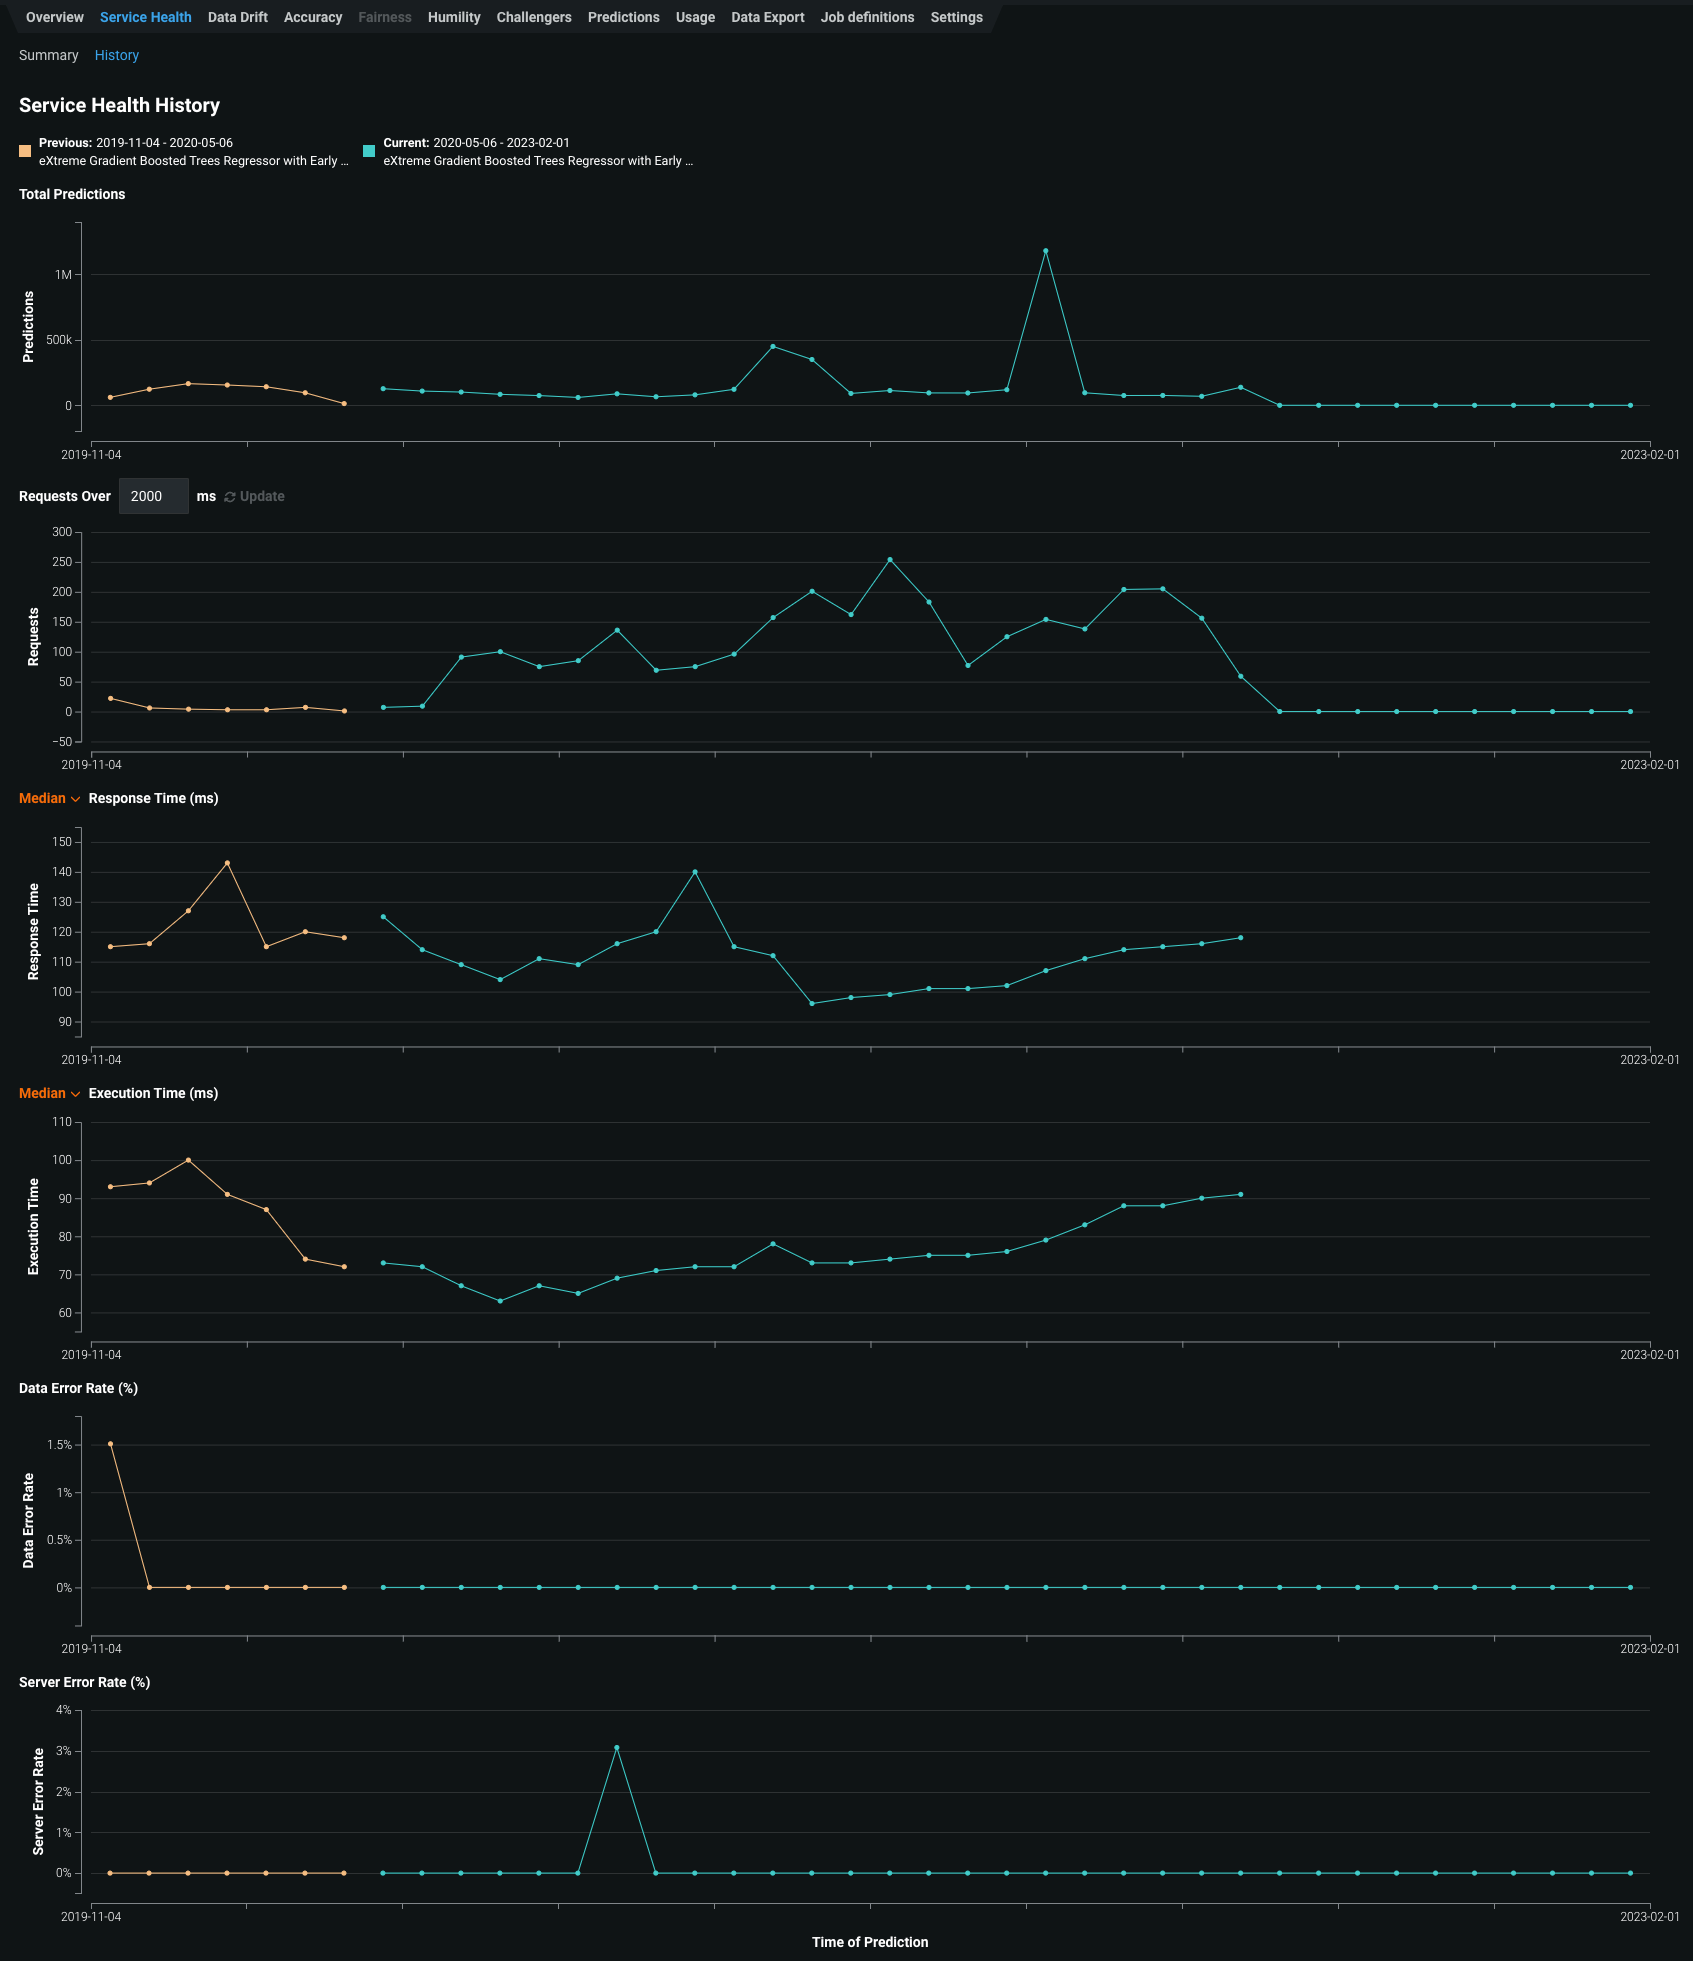
サービスの正常性には、デプロイされたモデルが予測リクエストに迅速かつ確実に応答する能力を評価するために使用できる指標が表示されます。 さらに、履歴ページでは、現在デプロイされているモデルを含む、最近デプロイされた最大5つのモデルのサービス正常性履歴の可視化情報にアクセスできます。 この履歴は、モデルのサービス正常性で追跡される各指標で利用でき、適切なプロビジョニングに不可欠なボトルネックの特定と容量の評価に役立ちます。 たとえば、デプロイのレスポンス時間が遅くなったように見える場合、そのモデルのデプロイの サービスの正常性 ページが問題の診断に役に立ちます。 サービスの正常性指標で、予測リクエストの増加に伴ってレイテンシーの中央値の増加が示される場合は、履歴タブを確認して、現在デプロイされているモデルを以前のモデルと比較することができます。 前のモデルから切り替えた後にレイテンシーが大きくなった場合は、よりパフォーマンスの高いモデルをデプロイするかどうかを検討できます。
サービスの正常性 > 履歴タブにアクセスするには:
-
デプロイをクリックして、インベントリからデプロイを選択します。
-
選択したデプロイの概要で、サービスの正常性をクリックします。
-
サービスの正常性 > サマリーページで、履歴をクリックします。
履歴タブは、以下の指標を追跡します。
指標 レポート 予測の合計数 デプロイで作成された予測の数。 xミリ秒以上のリクエスト 指定されたミリ秒よりもレスポンス時間が長かったリクエストの数。 デフォルトは2000msです。ボックスをクリックして10~100,000msの時間を入力するか、コントロールを使用して値を調整します。 レスポンス時間 (ms) DataRobotが予測リクエストの受信、リクエストの計算、およびユーザーへの応答に要した時間(ミリ秒)。 レポートにはネットワークレイテンシーの時間は含まれません。 予測リクエスト時間の中央値、あるいは90、95、または99パーセンタイルを選択します。 リクエストがなかったデプロイや外部デプロイの場合は、ダッシュ(-)が表示されます。 実行時間(ミリ秒) DataRobotが予測リクエストの計算に要した時間(ミリ秒)。 予測リクエスト時間の中央値、あるいは90、95、または99パーセンタイルを選択します。 データエラーの割合(%) 4xxエラーが発生したリクエストの割合(予測リクエスト送信の問題)。 これは、デプロイページのトップバナーのサービスの正常性サマリーとしてレポートされる値の要素です。 システムエラーの割合(%) 5xxエラーが発生した適切な形式のリクエストのパーセンテージ(DataRobot予測サーバーの問題)。 これは、デプロイページのトップバナーのサービスの正常性サマリーとしてレポートされる値の要素です。 -
サービスの正常性履歴チャートのデータポイントの詳細を表示するには、チャート上の関連ビンにカーソルを合わせます。
精度の履歴
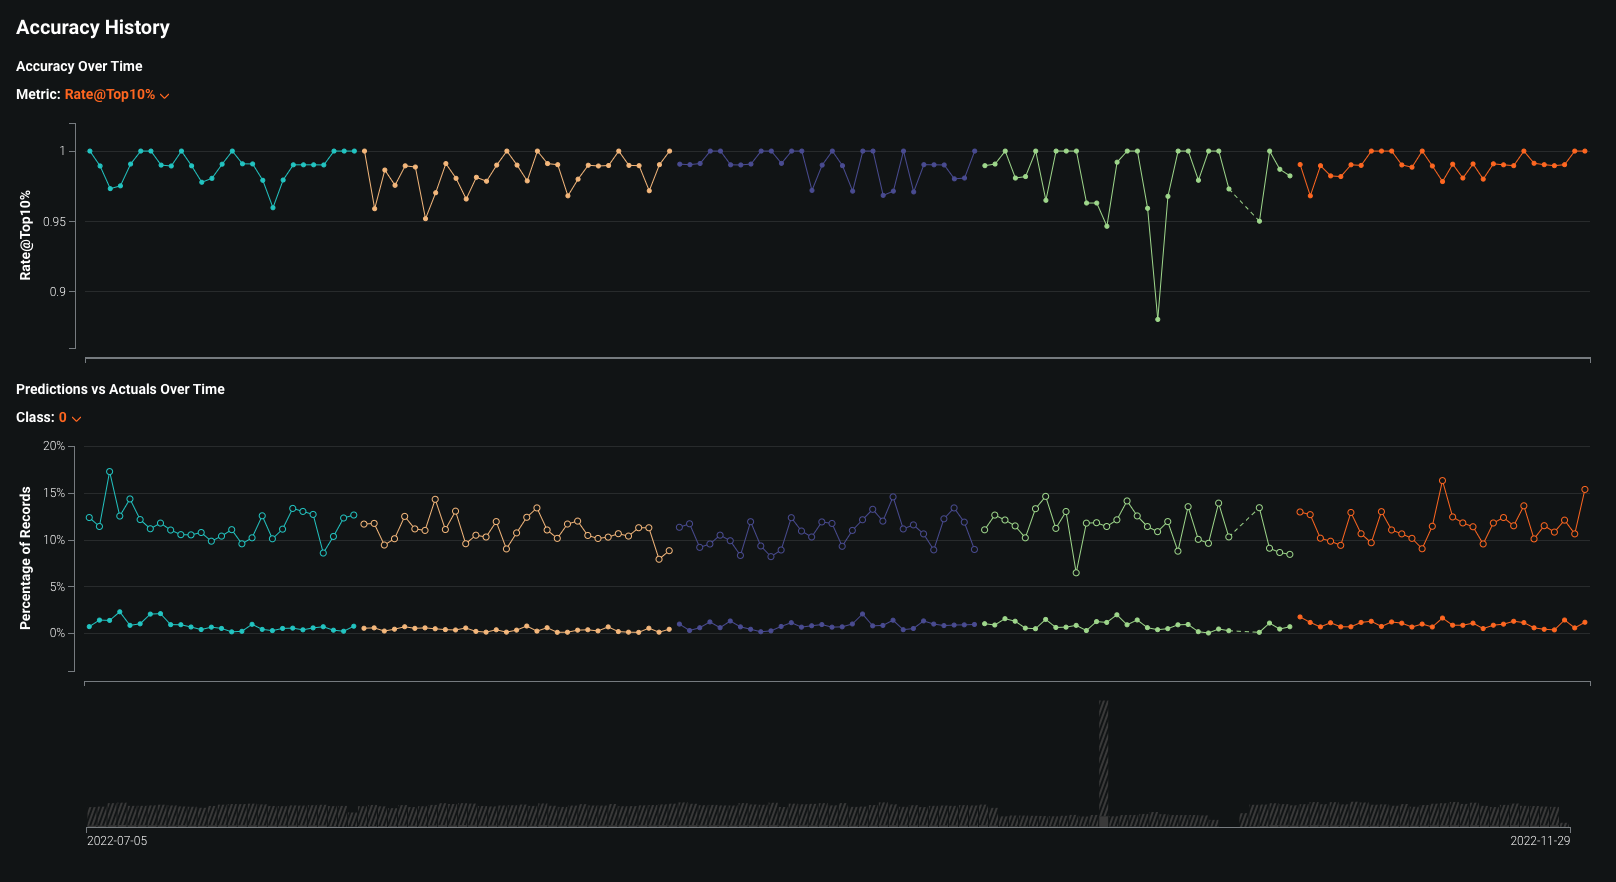
精度タブでは、標準的な統計手法と可視化によって、時間の経過に伴うモデルデプロイのパフォーマンスを分析します。 このツールを使用して、モデルの予測品質を分析し、品質が低下しているかどうか、およびモデルの置換を検討すべきかどうかを判断します。 さらに、履歴ページでは、現在デプロイされているモデルを含む、最近デプロイされた最大5つのモデルの精度履歴の可視化情報にアクセスして、モデルの精度を直接比較できます。 これらの精度のインサイトは、問題のタイプとそれに関連する最適化指標に基づいてレンダリングされます。
備考
デフォルトでは、精度監視はデプロイに対して有効ではありません。 タブを有効にするには、まずDataRobotの外部で収集されたデプロイの予測値と実測値を含むデータをアップロードしてください。 詳細については、 実測値追加による デプロイの精度設定に関するドキュメントを参照してください。
精度 > 履歴タブにアクセスするには:
-
デプロイをクリックして、インベントリからデプロイを選択します。
-
選択したデプロイの概要で、精度をクリックします。
-
精度 > サマリーページで、履歴をクリックします。
履歴タブは、以下を追跡します。
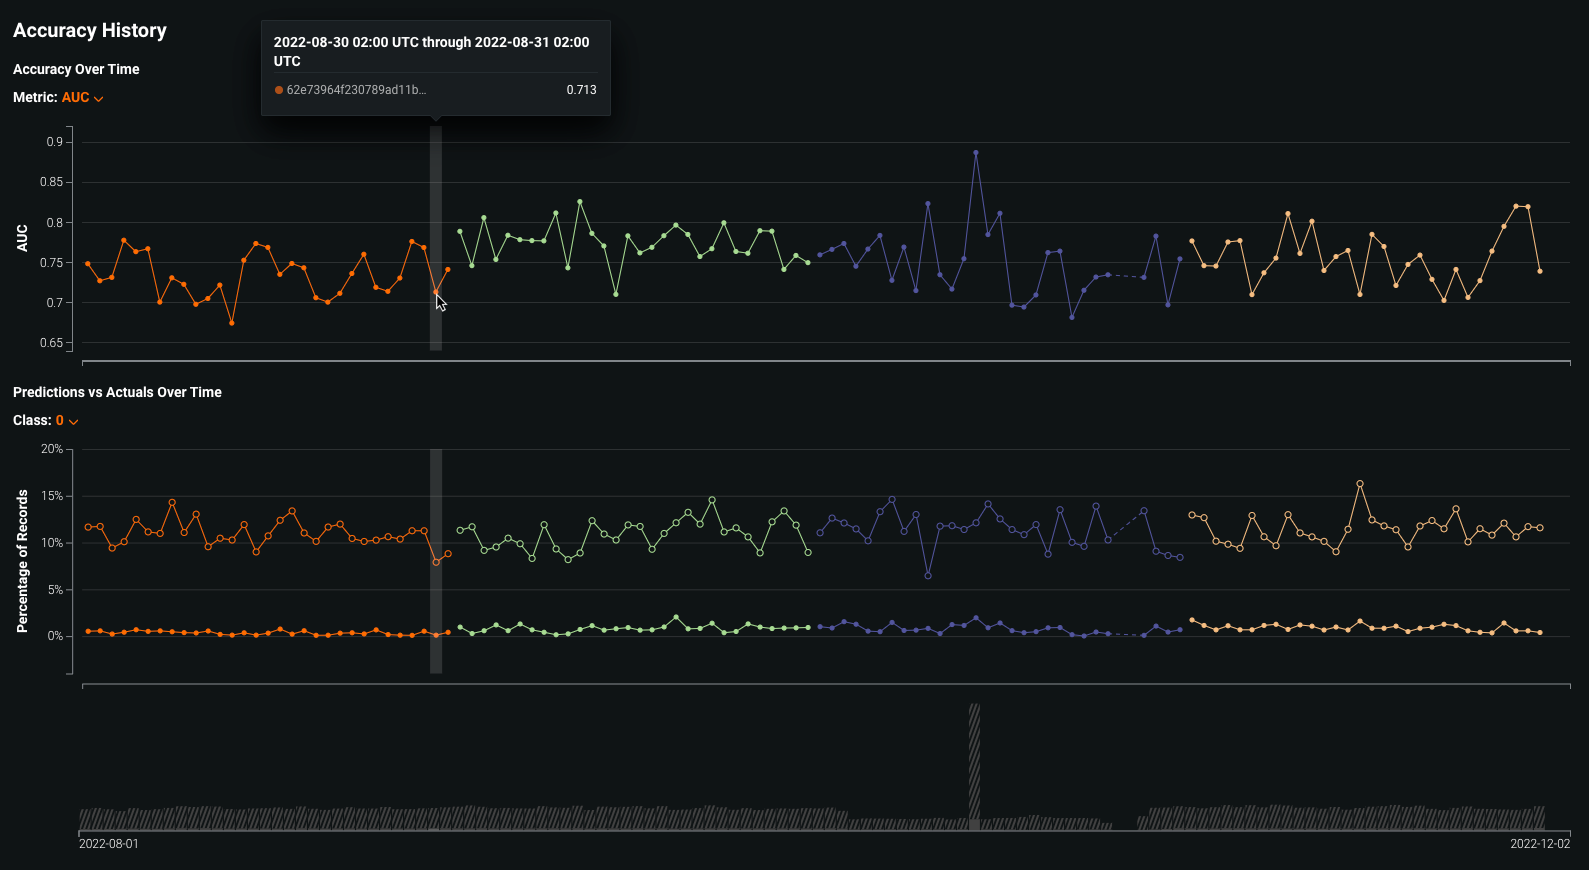
指標 レポート 時系列の精度 現在デプロイされているモデルを含む、最近デプロイされたモデルのうち最大5つについて、選択した精度指標の経時変化を視覚化する折れ線グラフ。 使用可能な精度指標は、プロジェクトタイプによって異なります。 時系列の予測値対実測値 現在デプロイされているモデルを含む、最近デプロイされたモデルのうち最大5つについて、時間経過に伴う平均予測値と平均実測値の差を視覚化する折れ線グラフ。 分類プロジェクトの場合、クラスごとに結果を表示できます。 時系列の精度チャートには、タイムラインに沿って各予測範囲に対して選択された精度指標がプロットされます。 利用可能な精度指標は、デプロイに使用するモデリングプロジェクトのタイプによって異なります。
プロジェクトタイプ 使用可能な指標 連続値 RMSE、MAE、Gamma Deviance、Tweedie Deviance、R Squared、FVE Gamma、FVE Poisson、FVE Tweedie、Poisson Deviance、MAD、MAPE、RMSLE 二値分類 LogLoss、AUC、Kolmogorov-Smirnov、Gini-Norm、Rate@Top10%、Rate@Top5%、TNR、TPR、FPR、PPV、NPV、F1、MCC、Accuracy、Balanced Accuracy、FVE Binomial 指標ドロップダウンリストから精度指標を選択できます。
時間経過に伴う予測値と実測値の比較チャートでは、タイムラインに沿って各予測範囲の平均実測値の隣に平均予測値がプロットされます。さらに、グラフの下のボリュームチャートには、プロットされた各時間範囲内で行われた予測に対応する予測値と実測値の数が表示されます。 影付きの領域はアップロードされた実測値の数を表し、縞模様の領域は対応する実測値が欠損している予測の数を表します。
タイムラインとバケットは分類プロジェクトと連続値プロジェクトで同じように機能しますが、分類プロジェクトでは、クラスドロップダウンを使用して、そのクラスの結果を表示できます。
-
精度履歴チャートのデータポイントの詳細を表示するには、チャート上の関連ビンにカーソルを合わせます。


