ホストされたカスタム指標
本機能の提供について
ホストされたカスタム指標は、デフォルトではオフになっています。 この機能を有効にする方法については、DataRobotの担当者または管理者にお問い合わせください。
機能フラグ:ホストされたカスタム指標を有効にする、カスタムジョブを有効にする、Notebooksでカスタム環境を有効にする
DataRobotはデプロイに カスタム指標を提供し、最大25個のカスタムビジネスまたはパフォーマンス指標を計算および監視します。 ホストされたカスタム指標を使用すると、組織専用の指標を最大5つデプロイに実装できるだけでなく、DataRobot Notebooksを使用してコードをアップロードしてホストし、他のデプロイに簡単にカスタム指標を追加できます。
What types of custom metrics are supported?
Three types of custom metrics are available for use. External metrics are generally available in Classic and NextGen, hosted custom metrics are available for preview in Classic and NextGen, and hosted custom metric templates are available for preview in NextGen:
| カスタム指標の種類 | 成熟 | 説明 |
|---|---|---|
| 外部カスタム指標 | 一般提供 |
|
| ホストされたカスタム指標 | プレビュー |
|
| ホストされたカスタム指標テンプレート | プレビュー |
|
ホストされたカスタム指標の設定
カスタム指標のホストを開始するには:
-
上部のナビゲーションバーで、デプロイをクリックします。
-
デプロイタブで、カスタム指標を作成するデプロイをクリックします。
-
デプロイで、カスタム指標タブをクリックします。
-
カスタム指標タブで、+ カスタム指標を追加をクリックします。 You can have up to 25 custom metrics per deployment.
-
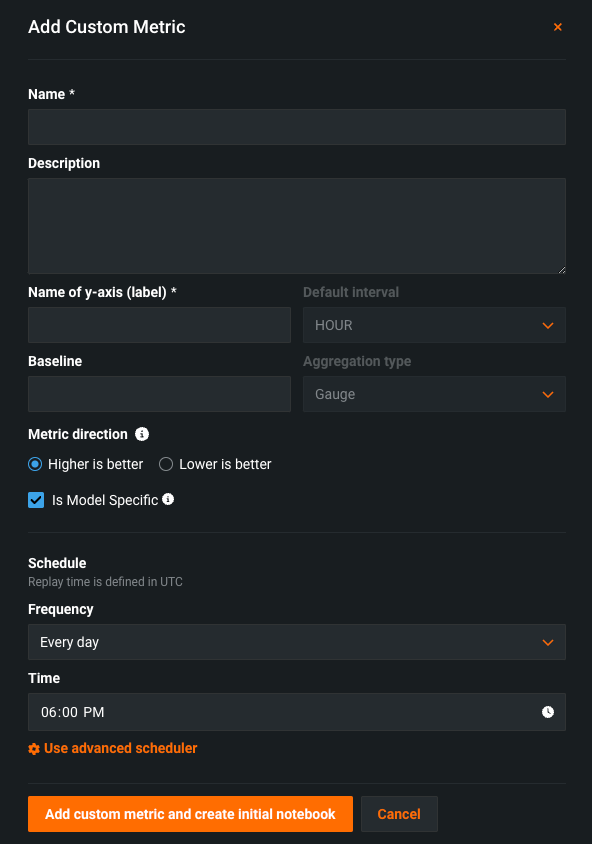
カスタム指標を追加ダイアログボックスで、新しいホストされた指標を作成をクリックし、次へをクリックしてから、指標設定を設定します。

フィールド 説明 名前 (必須)指標の説明的な名前。 この名前は、カスタム指標サマリーダッシュボードに表示されます。 説明 カスタム指標の説明。たとえば、目的、計算方法などを説明することができます。 Y軸の名前(ラベル) (必須)従属変数の説明的な名前。 この名前は、カスタム指標サマリーダッシュボードのカスタム指標のチャートに表示されます。 デフォルトの間隔 選択した集計タイプで使用されるデフォルトの間隔を決定します。 HOURのみサポートされています。 ベースライン x%良い値またはx%悪い値を計算するときに比較の基準として使用する値を決定します。 集計タイプ Determines if the metric is calculated as a Sum, Average, or Gauge—a metric with a distinct value measured at single point in time. 指標の方向 指標の方向性を決定し、指標の変更を視覚化する方法を変更します。 大きいほど良いまたは低いほど良いを選択できます。 たとえば、低いほど良いを選択すると、カスタム指標の計算値が10%減少することが、10%改善とみなされ、緑色で表示されます。 モデル固有 この設定を有効にすると、データセットで提供されたモデルパッケージID(登録されているモデルバージョンID)を使用して、指標をモデルにリンクします。 この設定は、値が集計(またはアップロード)される場合に影響します。 例: - モデル固有(有効):モデルの精度指標はモデル固有であるため、値は完全に個別に集計されます。 モデルを置換すると、カスタム精度指標のチャートには、置換後の日についてのデータだけが表示されます。
- モデル固有ではありません(無効):収益指標はモデル固有ではないため、値は一緒に集計されます。 モデルを置換しても、カスタム収益指標のチャートは変更されません。
スケジュール カスタム指標に値が入力されるタイミングを定義します。 頻度(1時間ごと、1日ごと、1か月ごとなど)と時間を選択します。 詳細なスケジューリングオプションを使用するには、高度なスケジューラーを使用するを選択します。 -
ノートブックからカスタム指標を追加をクリックします。
カスタムジョブによるカスタム指標のテスト
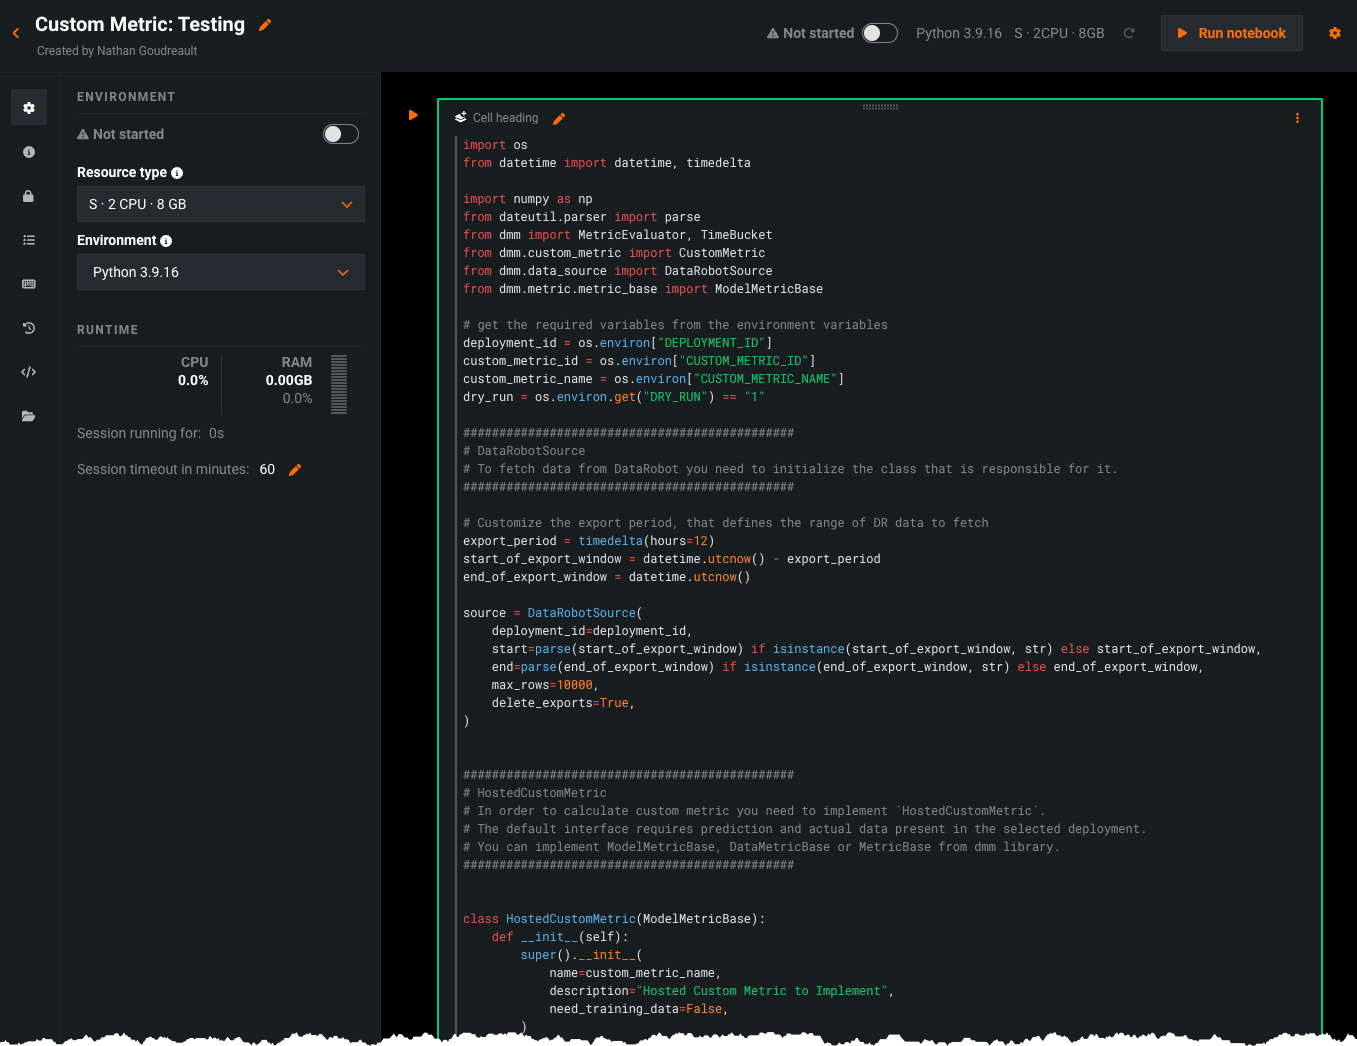
カスタム指標を設定すると、そのコードを含むノートブックがロードされます。 ノートブックには、1つのカスタム指標セル、指標のエクスポートと計算方法を定義するPythonコード、スコアリング用のコード、指標を入力するコードを含む。一意のタイプのノートブックセルが含まれています。

必要に応じて、カスタム指標セルのコードを変更します。 次に、セルの下部にあるカスタム指標コードをテストをクリックして、コードをテストします。 テストではカスタムジョブが作成されます。 テストが正常に実行された場合、カスタム指標コードをデプロイをクリックして、カスタム指標をデプロイに追加します。
コードが正しく実行されない場合、テスト完了後に、カスタム指標コードのテストに失敗しましたという警告が表示されます。

カスタム指標コードのトラブルシューティング
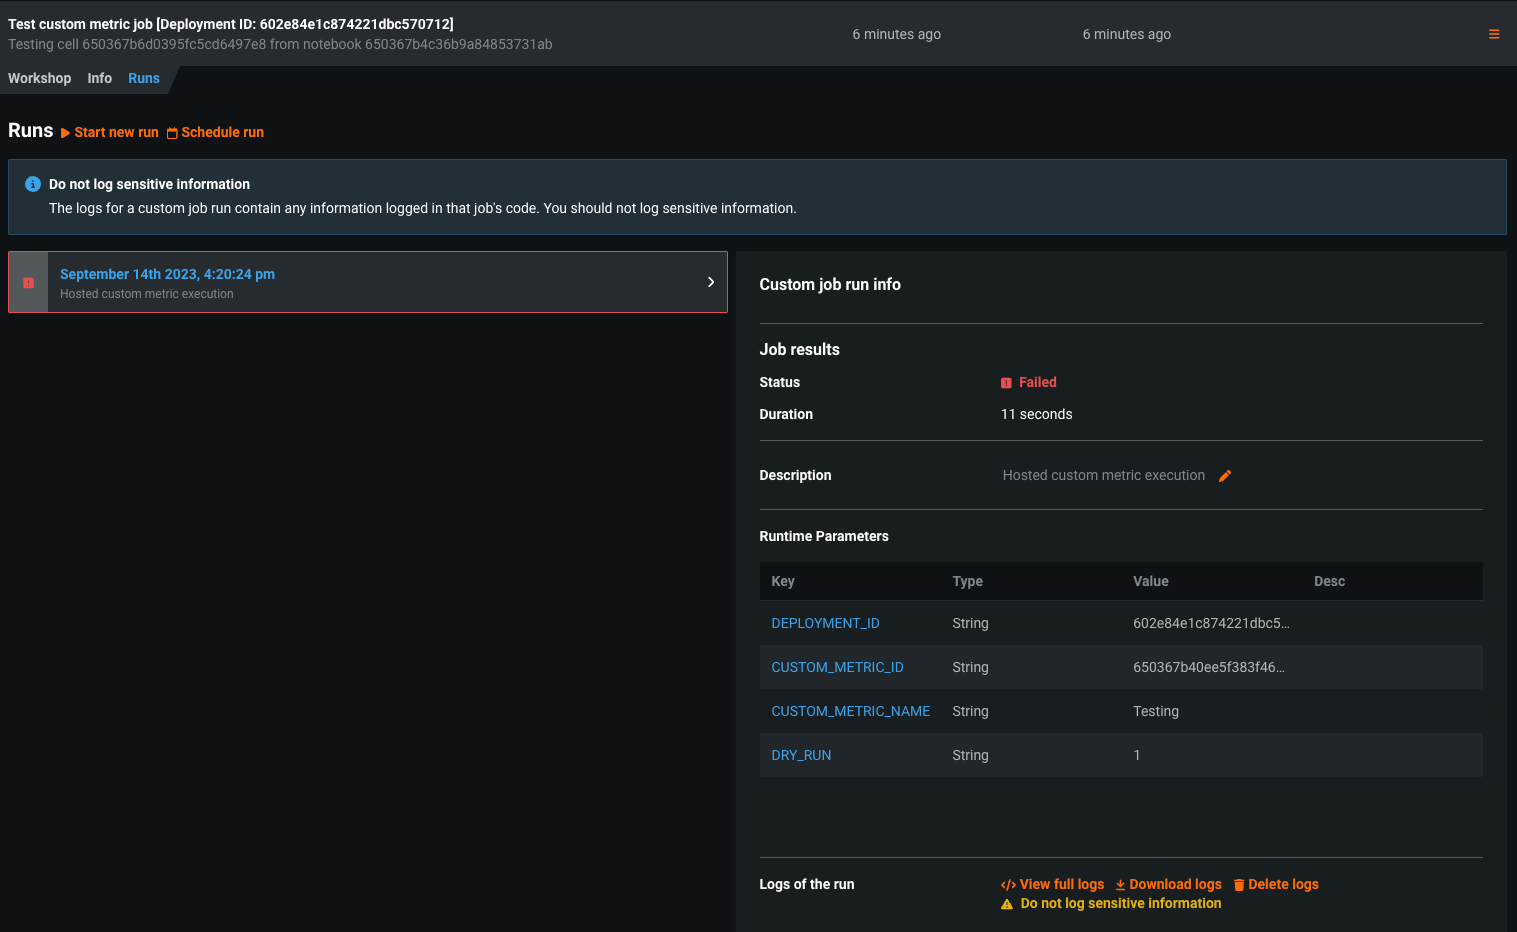
カスタム指標のコードをトラブルシューティングするには、モデルレジストリに移動して、カスタムジョブタブを選択し、テストのために実行されたカスタムジョブにアクセスします。
ジョブの実行タブには、失敗したテストのログが含まれています。このログは、完全なログを表示を選択して参照できます。

失敗したテストのログを参照して、失敗したテストのトラブルシューティングを行うことをお勧めします。
さらに、カスタムジョブのインターフェイスでは、ワークショップタブから実行をスケジュールするを選択して、カスタム指標のスケジュールを変更できます。