Hosted custom metrics
Availability information
Hosted custom metrics are off by default. Contact your DataRobot representative or administrator for information on enabling this feature.
Feature flags: Enable Hosted Custom Metrics, Enable Custom Jobs, Enable Notebooks Custom Environments
DataRobot offers custom metrics for deployments to compute and monitor custom business or performance metrics. With hosted custom metrics, you can not only implement up to five of your organization's specialized metrics into a deployment, but also upload and host code using DataRobot Notebooks to easily add custom metrics to other deployments.
Custom metrics limits
You can have up to 50 custom metrics per deployment.
What types of custom metrics are supported?
Three types of custom metrics are available for use. External metrics are generally available in Classic and NextGen, hosted custom metrics are available for preview in Classic and NextGen, and hosted custom metric templates are available for preview in NextGen:
| Custom metric type | Maturity | Description |
|---|---|---|
| External custom metrics | GA |
|
| Hosted custom metrics | Preview |
|
| Hosted custom metric templates | Preview |
|
Set up hosted custom metrics
To begin hosting custom metrics:
-
In the top navigation bar, click Deployments.
-
On the Deployments tab, click on the deployment for which you want to create custom metrics.
-
In the deployment, click the Custom Metrics tab.
-
On the Custom Metrics tab, click + Add Custom Metric. You can have up to 50 custom metrics per deployment.
-
In the Add Custom Metric dialog box, click Create new hosted metric, click Next, and then configure the metric settings:
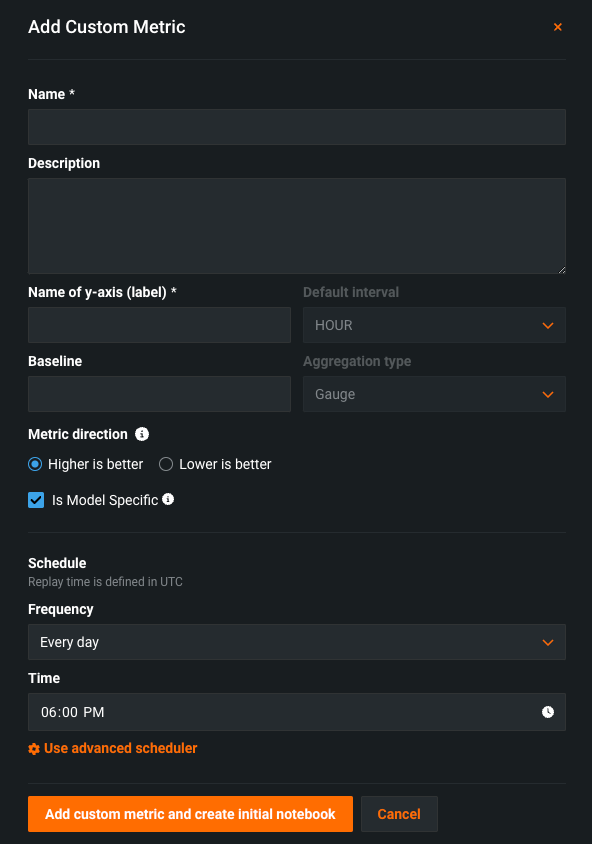
Field Description Name (Required) A descriptive name for the metric. This name appears on the Custom Metric Summary dashboard. Description A description of the custom metric; for example, you could describe the purpose, calculation method, and more. Name of y-axis (Required) A descriptive name for the dependent variable. This name appears on the custom metric's chart on the Custom Metric Summary dashboard. Default interval Determines the default interval used by the selected Aggregation type. Only HOUR is supported. Baseline Determines the value used as a basis for comparison when calculating the x% better or x% worse values. Aggregation type Determines if the metric is calculated as a Sum, Average, or Gauge—a metric with a distinct value measured at single point in time. Metric direction Determines the directionality of the metric, which controls how changes to the metric are visualized. You can select Higher is better or Lower is better. For example, if you choose Lower is better a 10% decrease in the calculated value of your custom metric will be considered 10% better, displayed in green. Is Model Specific When enabled, this setting links the metric to the model with the Model Package ID (Registered Model Version ID) provided in the dataset. This setting influences when values are aggregated (or uploaded). For example: - Model specific (enabled): Model accuracy metrics are model specific, so the values are aggregated completely separately. When you replace a model, the chart for your custom accuracy metric only shows data for the days after the replacement.
- Not model specific (disabled): Revenue metrics aren't model specific, so the values are aggregated together. When you replace a model, the chart for your custom revenue metric doesn't change.
Schedule Defines when the custom metrics are populated. Select a frequency (hourly, daily, monthly, etc.) and a time. Select Use advanced scheduler for more precise scheduling options. -
Click Add custom metric from notebook.
Test custom metrics with custom jobs
After configuring a custom metric, DataRobot loads the notebook that contains the code for it. The notebook contains one custom metric cell, a unique type of notebook cell that contains Python code defining how the metric is exported and calculated, code for scoring, and code to populate the metric.
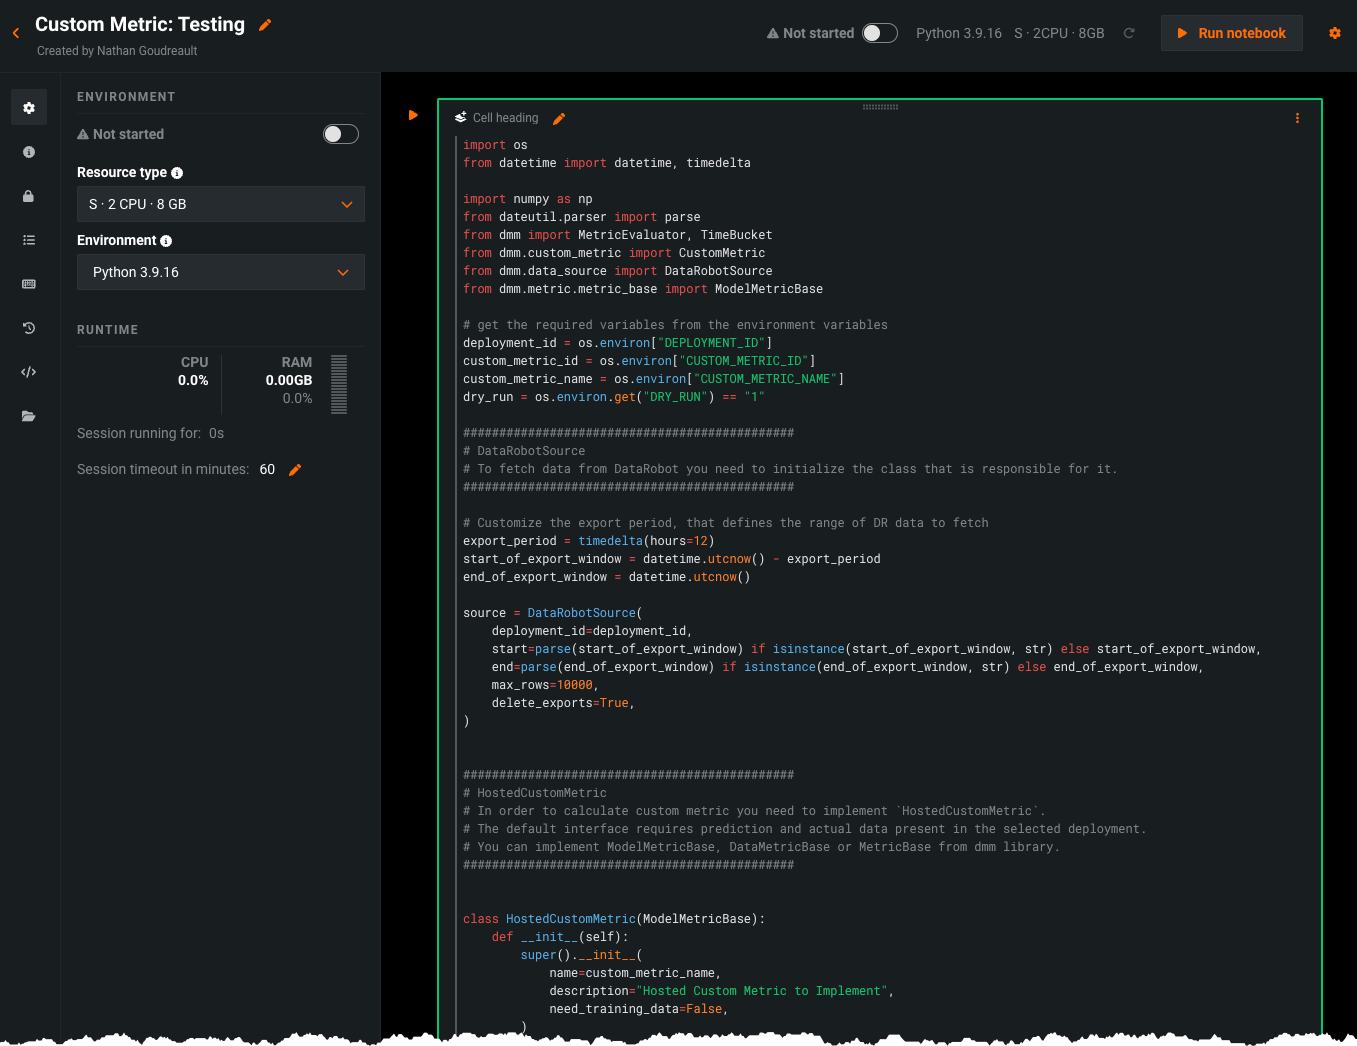
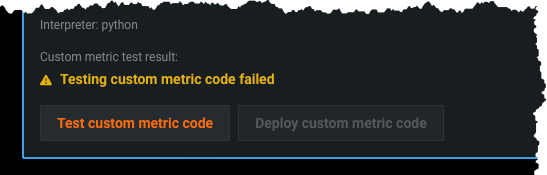
Modify the code in the custom metric cell as needed. Then, test the code by clicking Test custom metric code at the bottom of the cell. The test creates a custom job. If the test runs successfully, click Deploy custom metric code to add the custom metric to your deployment.
If the code does not run properly, you will receive the Testing custom metric code failed warning after testing completes:
Troubleshoot custom metric code
To troubleshoot a custom metric's code, navigate to the Model Registry, select the Custom Jobs tab, and access the custom job that ran for testing.
The job's Runs tab contains a log of the failed test, which you can browse by selecting View full logs.
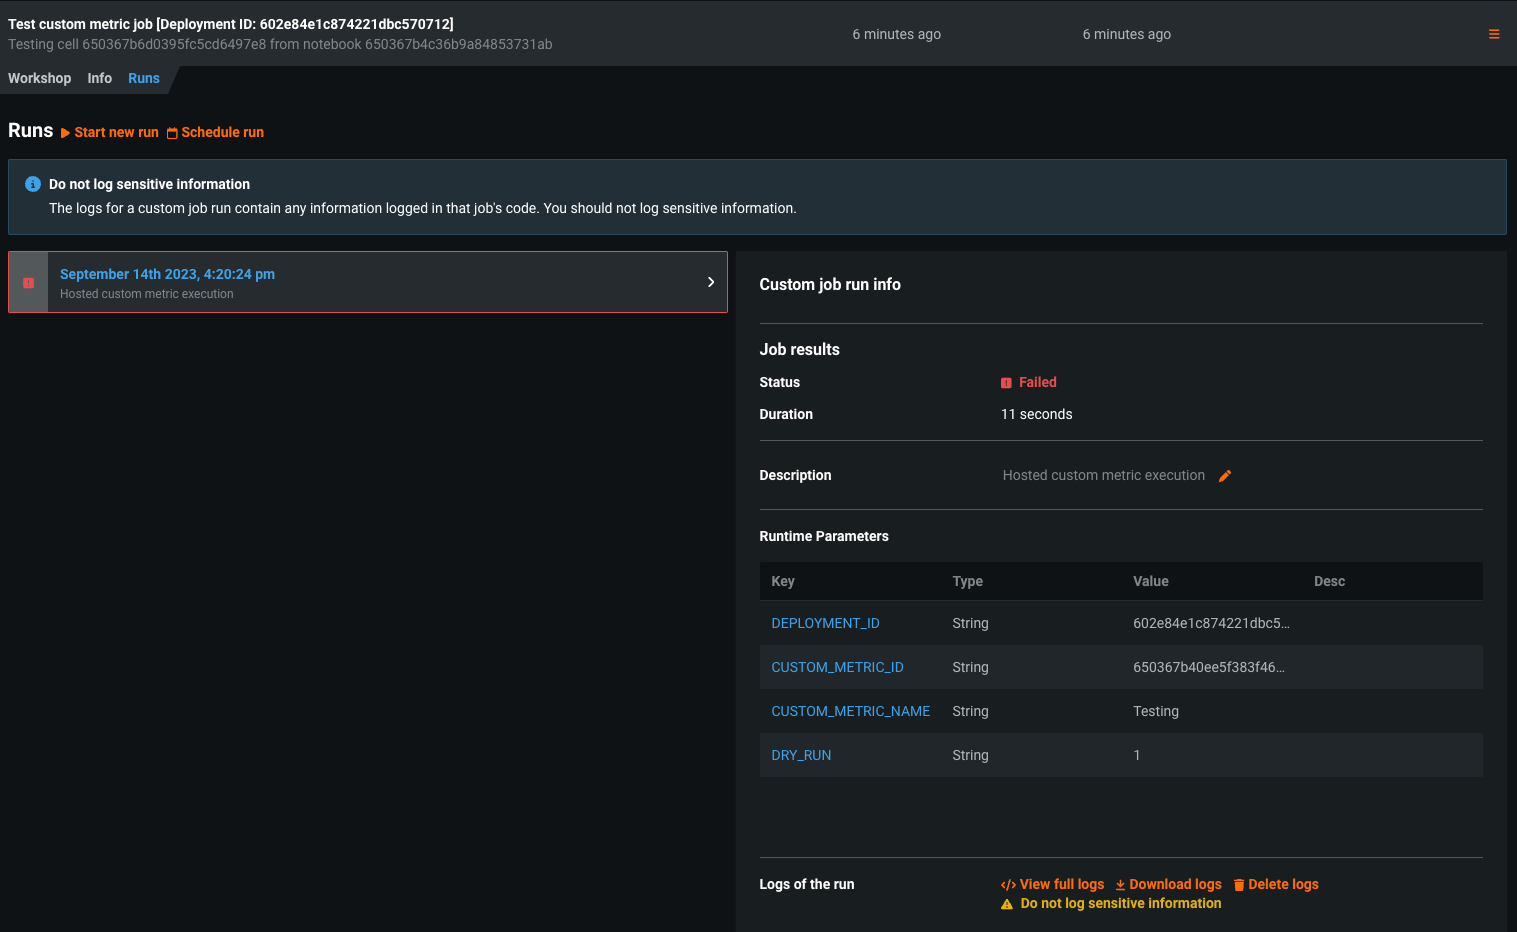
DataRobot recommends browsing the logs of the failed test to troubleshoot failed tests.
Additionally, the custom jobs interface allows you to modify the schedule for the custom metric from the Workshop tab by selecting Schedule run.