Edit and use applications
Workbench applications have two modes: Edit mode, where you can configure, customize, and even use the application, and Present mode, an end-user view of the application.
Note
The instructions on this page demonstrate how to edit and use an application in Edit mode.
The tabs below describe each mode in more detail, including the purpose and limitations of each one:
To enter Edit mode, when in Present mode, click Edit in the upper-right corner. In this mode, you can:
- Customize the appearance of the application.
- Share applications.
- Configure widgets and customize the appearance of widget visualizations.
- Make predictions and interact with prediction results.
- View summary information and model insights.
- Return to your Use Case via the breadcrumbs at the top of the page.
See the image and table below for a brief description of the interface:
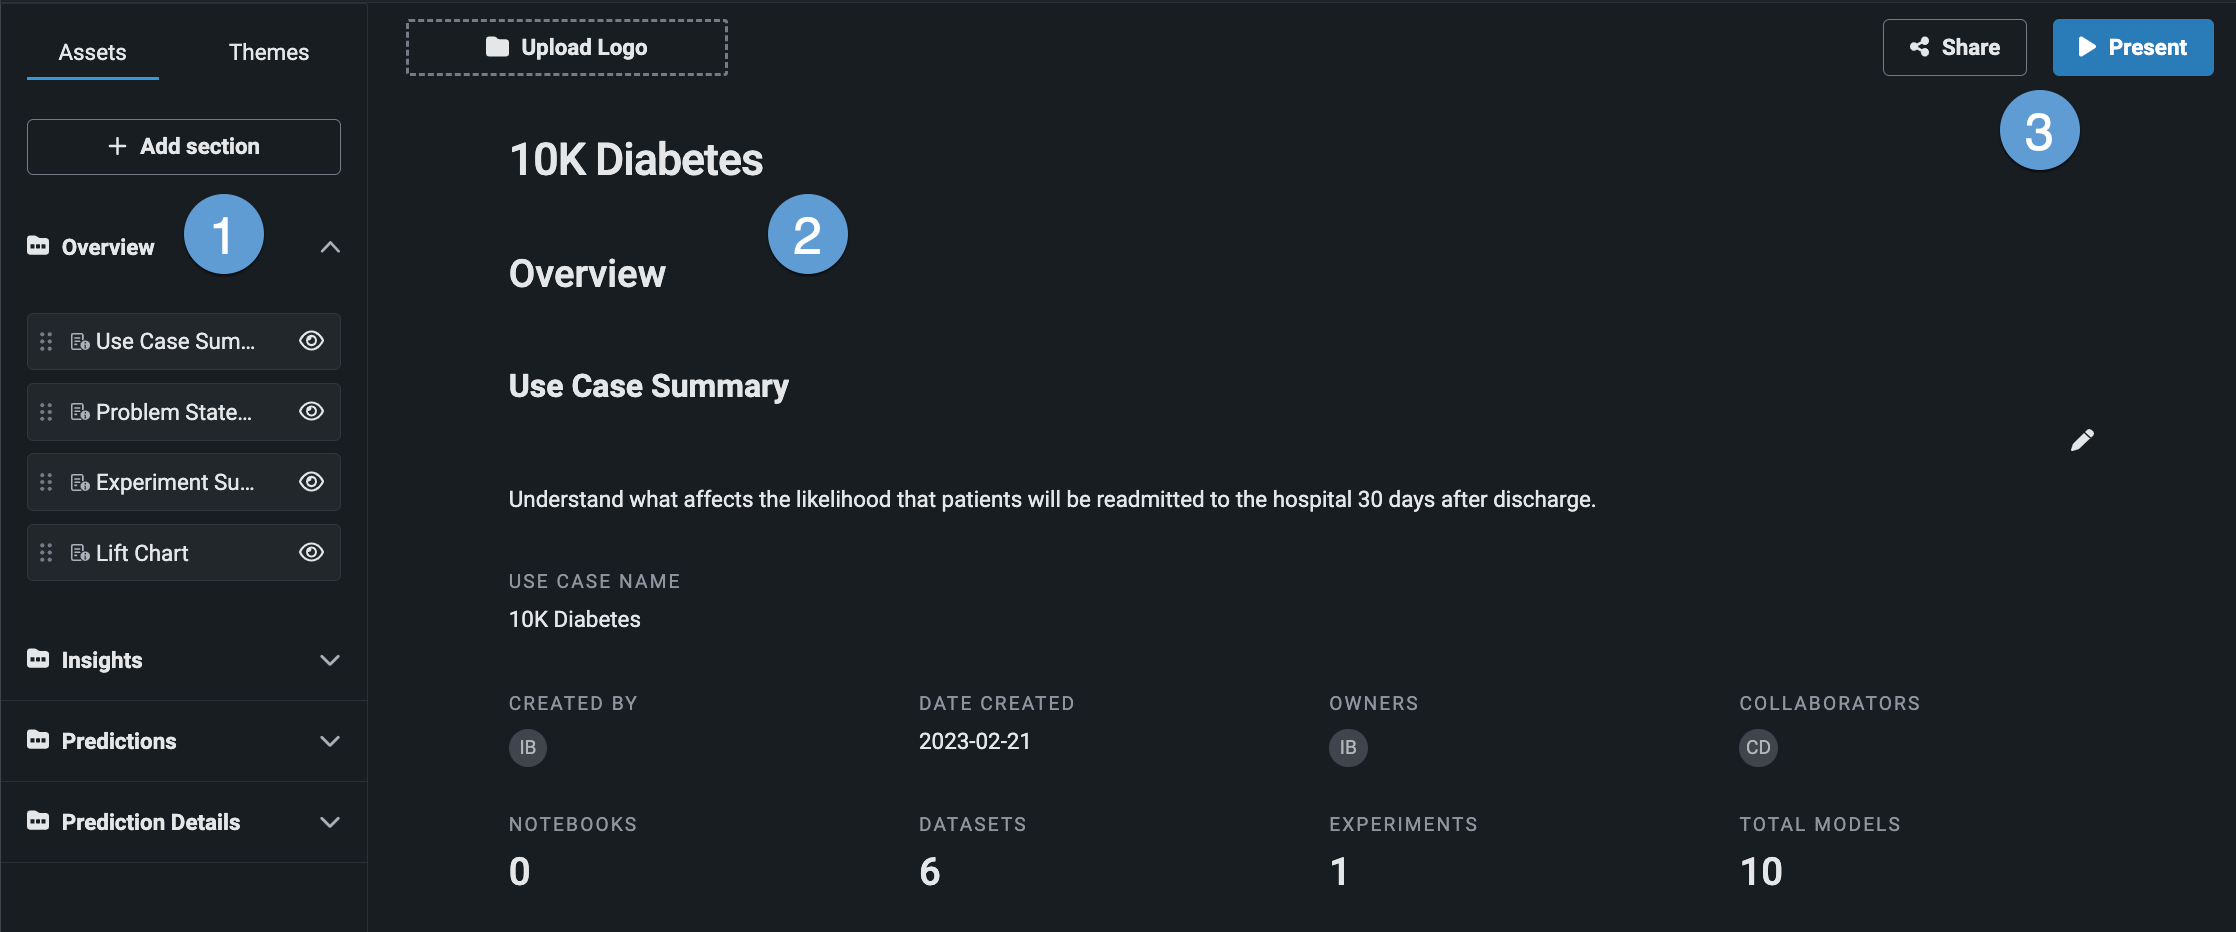
| Description | |
|---|---|
| Organizes the application using folders and sections. | |
| Displays the selected folder and its sections (indicated by the open folder on the left). | |
| Share provides a shareable link that grants recipients access to the application. Present opens the end-user version of the application. If you are already presenting, DataRobot displays an Edit button. |
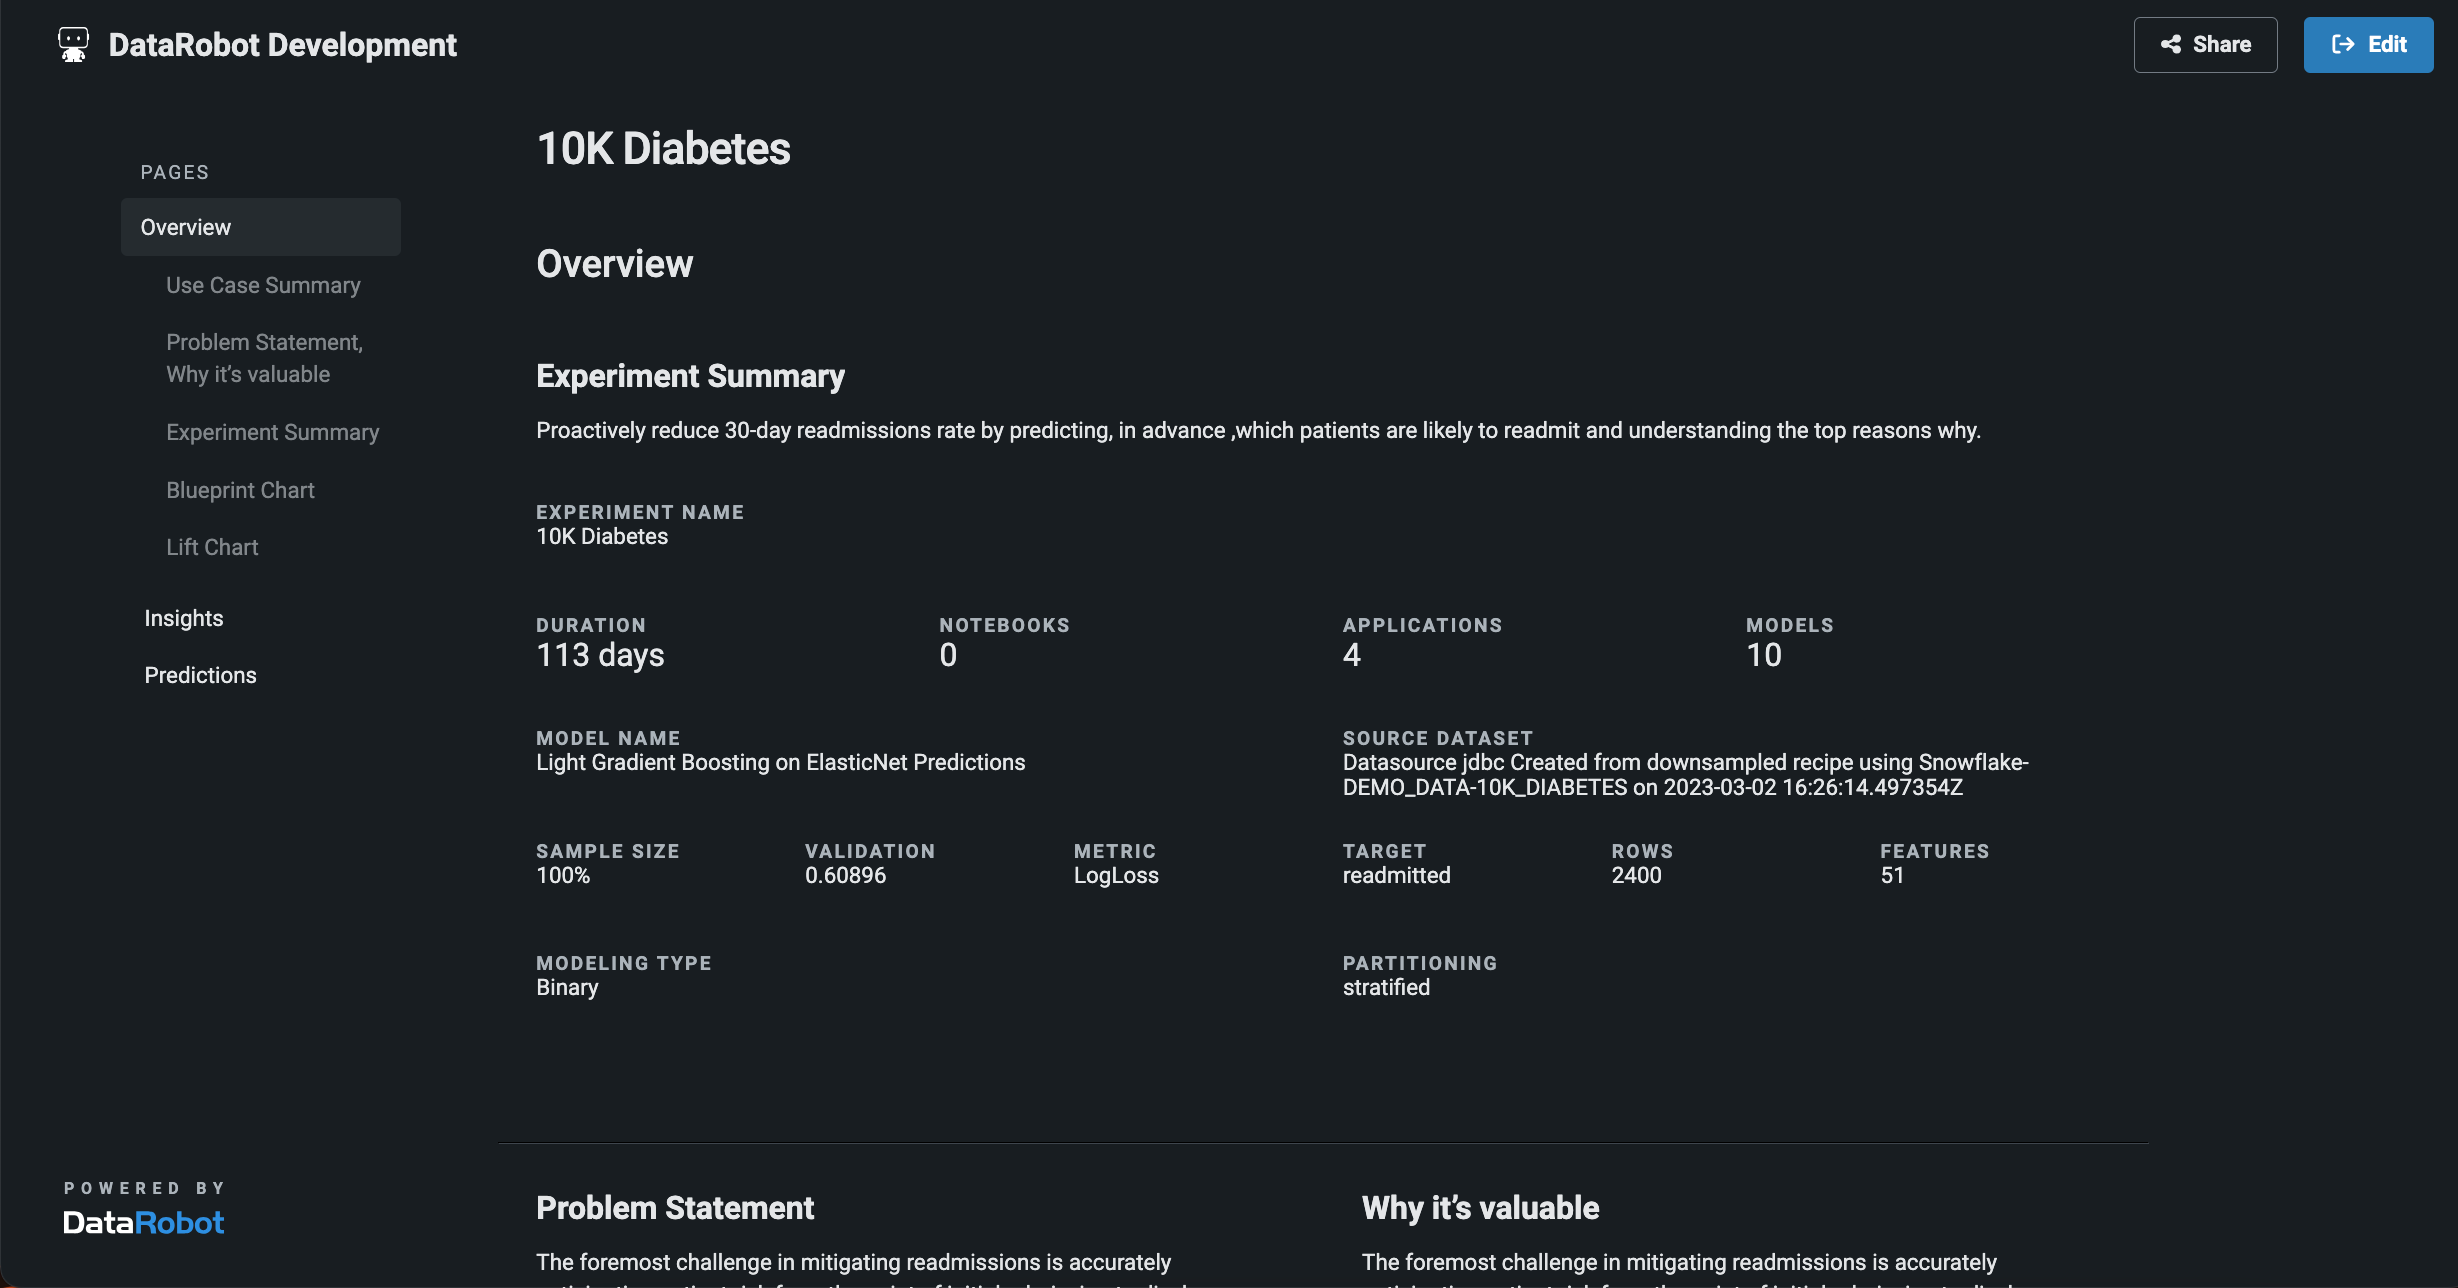
To enter Present mode, when in Edit mode, click Present in the upper-right corner to enter Present mode. Present mode displays the end-user version of the application that anonymous users (accessing the app via the shareable link) and those with Consumer access can access. In this mode, you can:
- Share applications.
- Make predictions and interact with prediction results.
- View summary information and model insights.
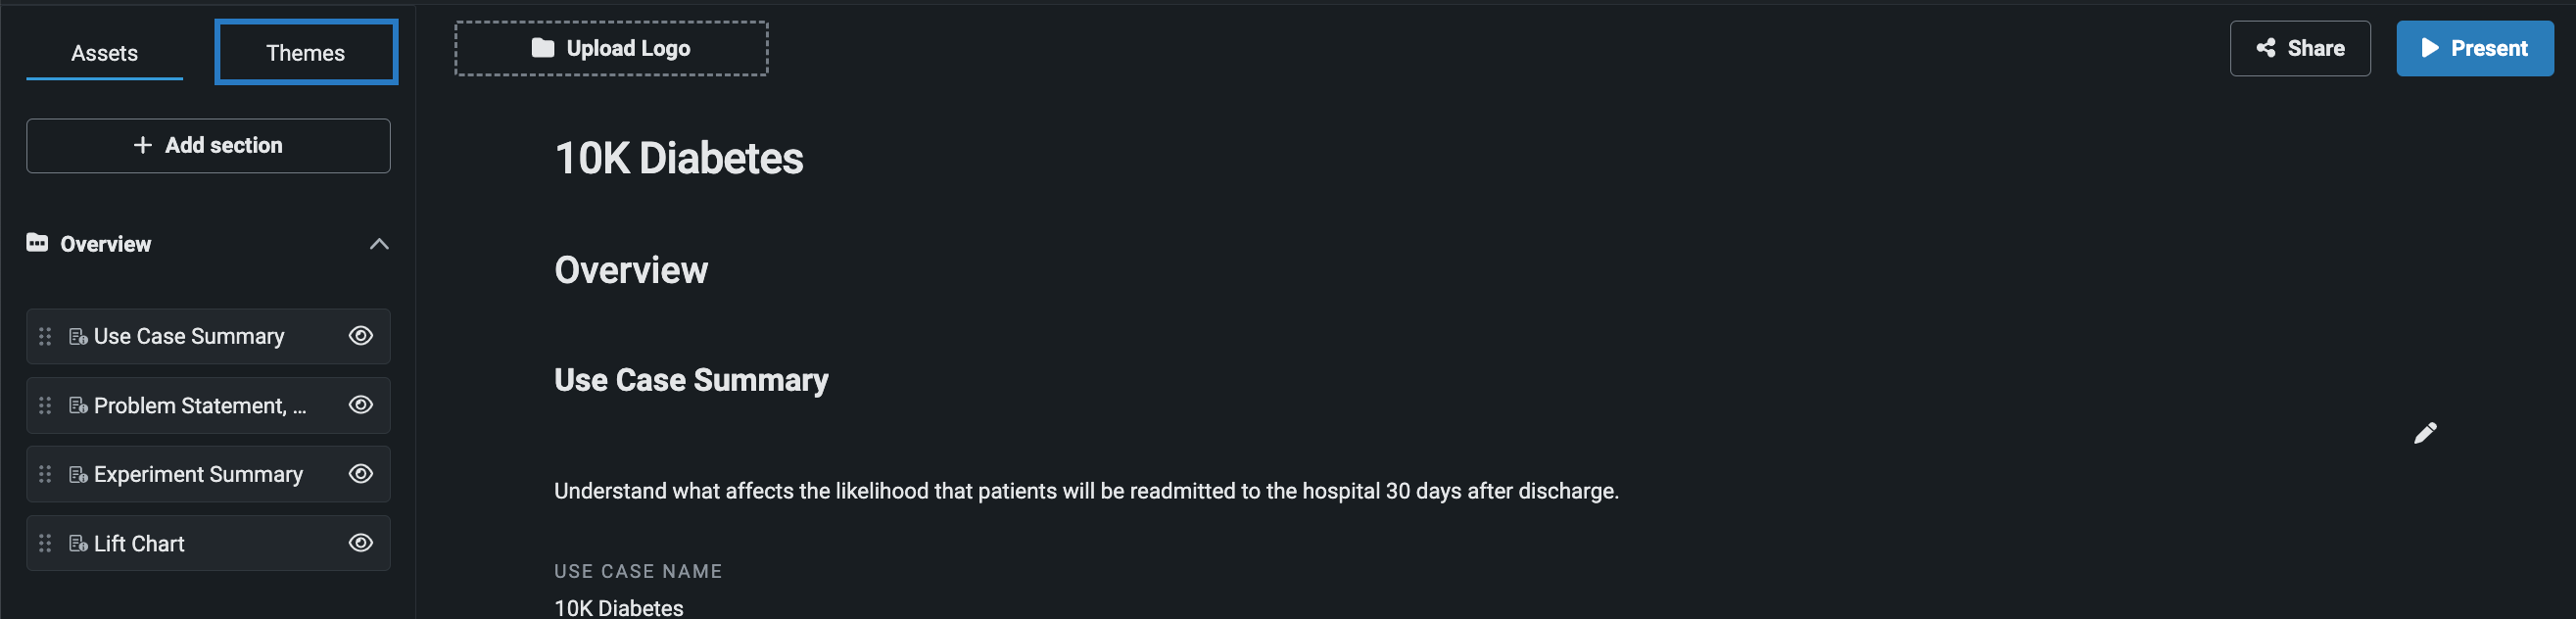
Change themes
In the Themes tab, you can choose a light or dark theme for your application.
Upload a custom logo
To add a custom logo to your application, click Upload Logo and select the image you'd like to use.
![]()
Add sections
Although you can't remove default sections from your application, you can add a new section to any of the folders. These custom sections include an editable text field and heading that when edited, also updates the section name in the left panel.
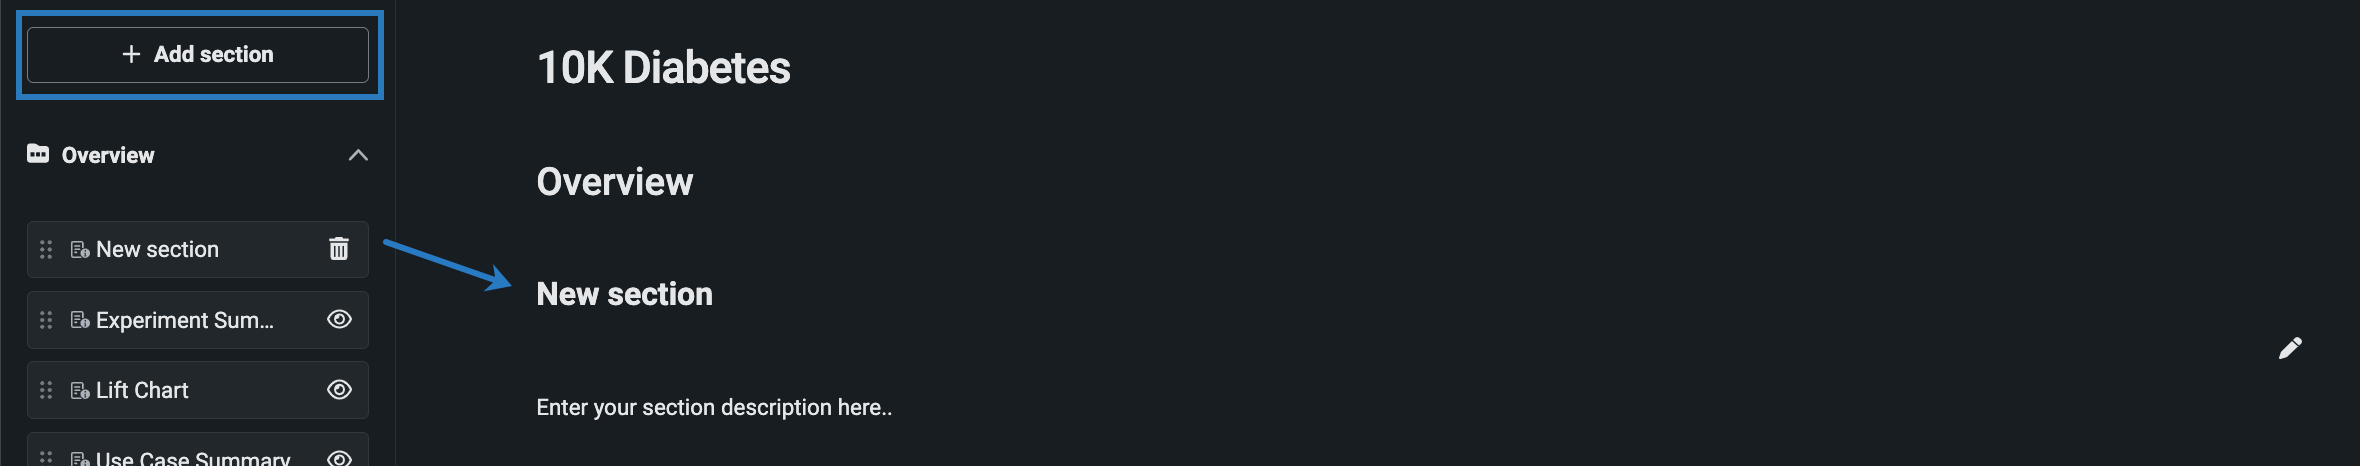
To remove a custom section, click the trash icon.
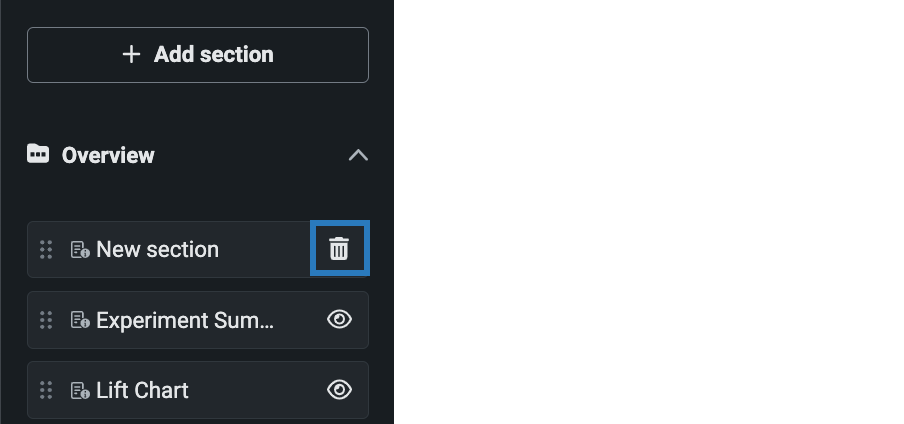
Reorder sections
You can change the order of where sections appear within a folder by dragging them to a new position in the left panel.
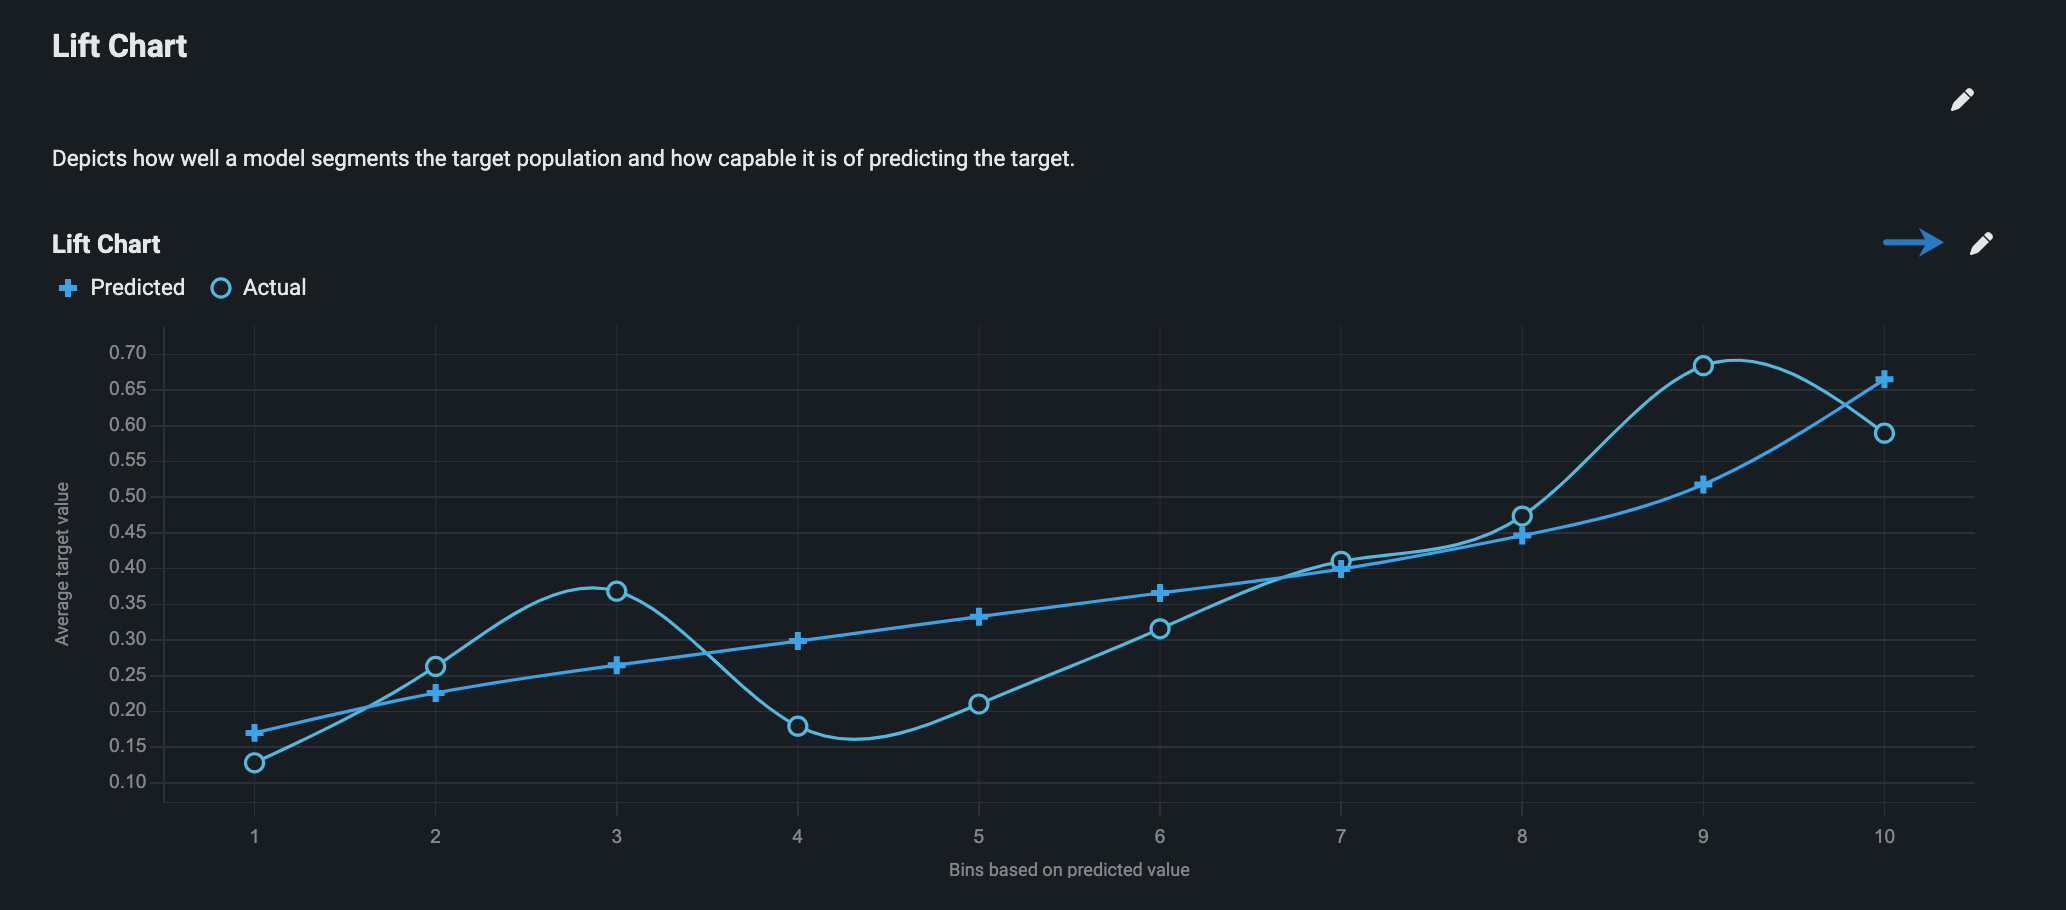
Customize visualizations
If a section contains a visualization, you can customize its appearance and behavior. To customize a visualization, hover over the chart and click the pencil icon.
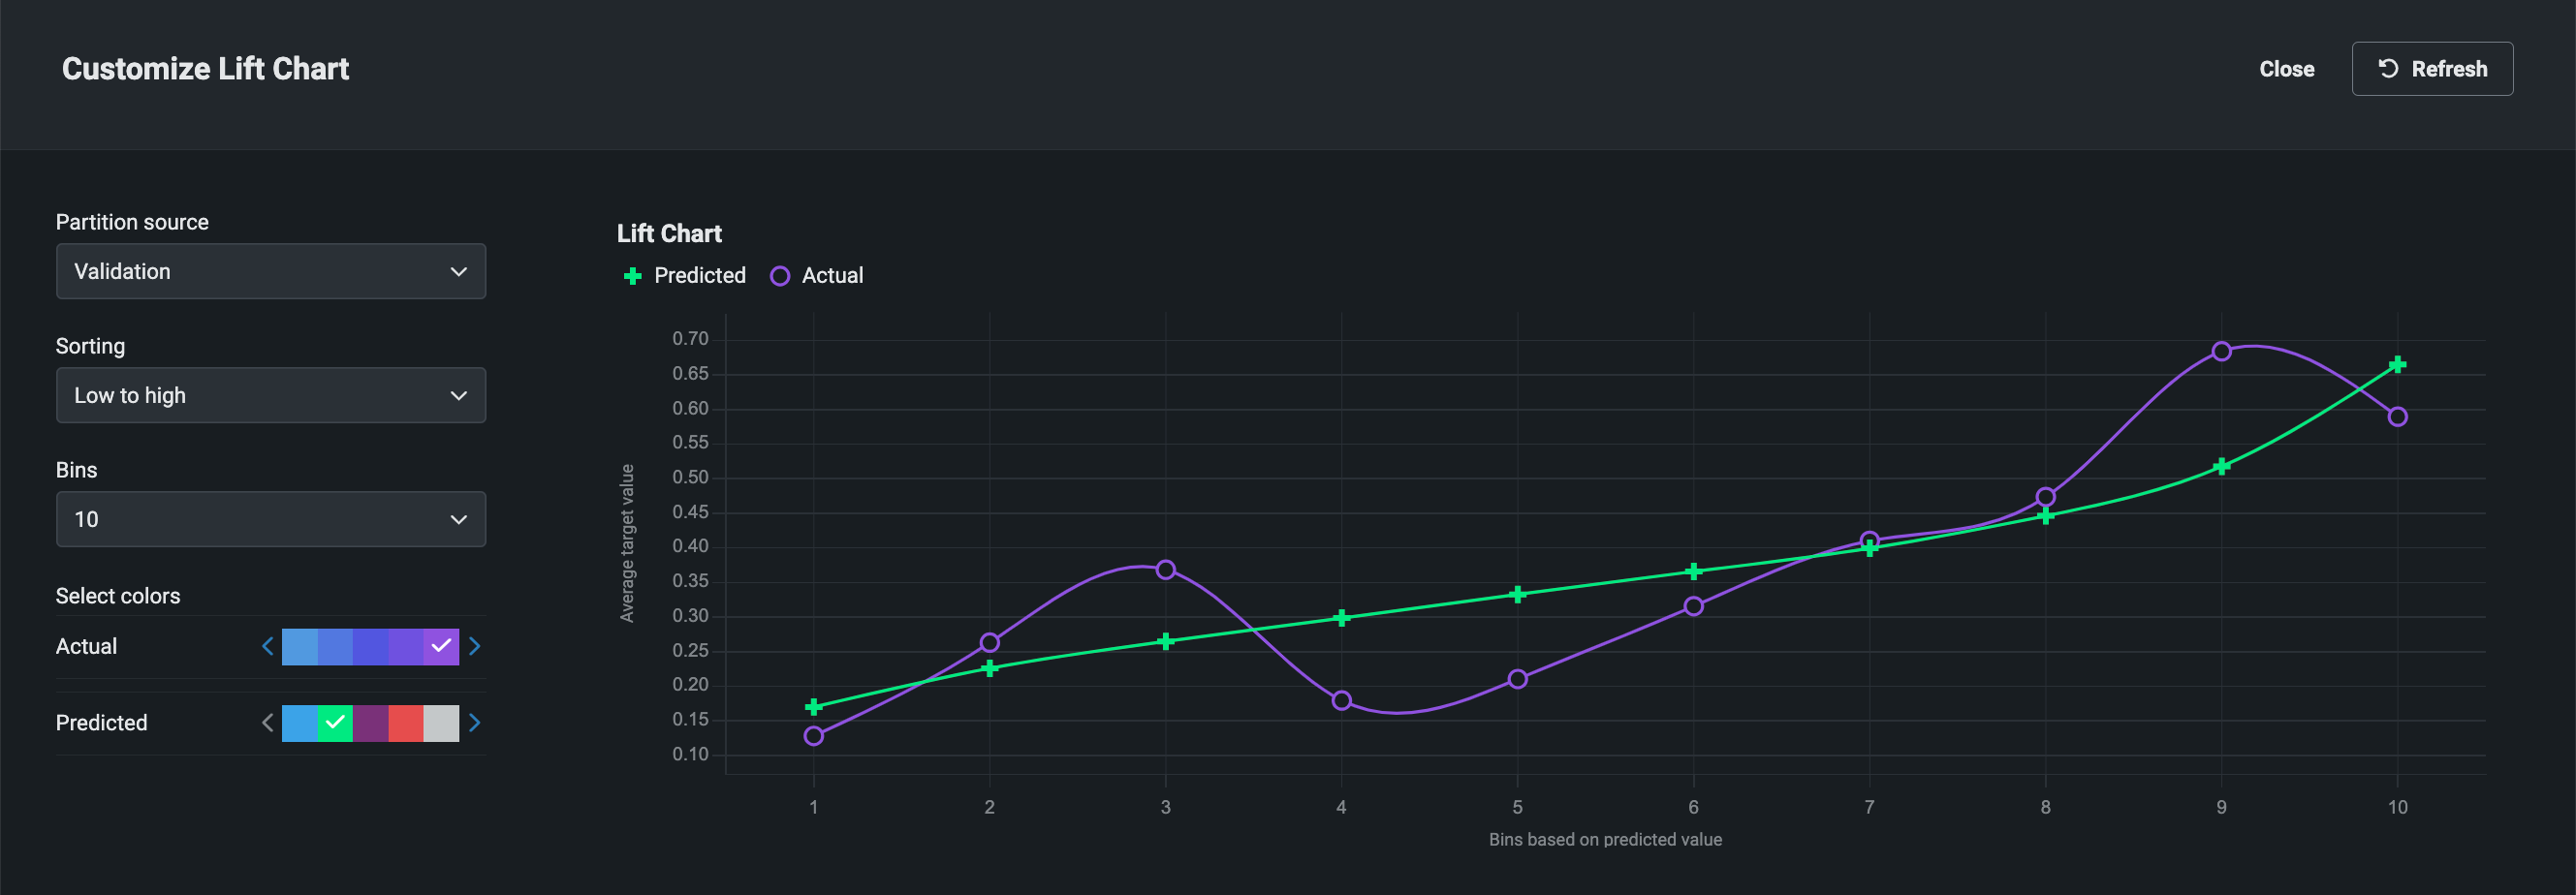
In the below example, you can change the chart colors, number of bins, sorting order, and partition source. However, the available customization options vary by visualization.
Application folders
By default, DataRobot automatically organizes your application by intuitively grouping its content in folders, and within each folder, information, insights, and actions are divided into sections. Default folders and sections cannot be removed, however, you can add new sections to a folder. Each application contains the following folders:
| Folder | Description |
|---|---|
| Overview | Displays general summary information. |
| Insights | Displays various model insights. |
| Predictions | Allows you to make and view predictions. |
| Prediction Details | Displays individual prediction results. |
Overview
The Overview folder contains general summary information for your application.
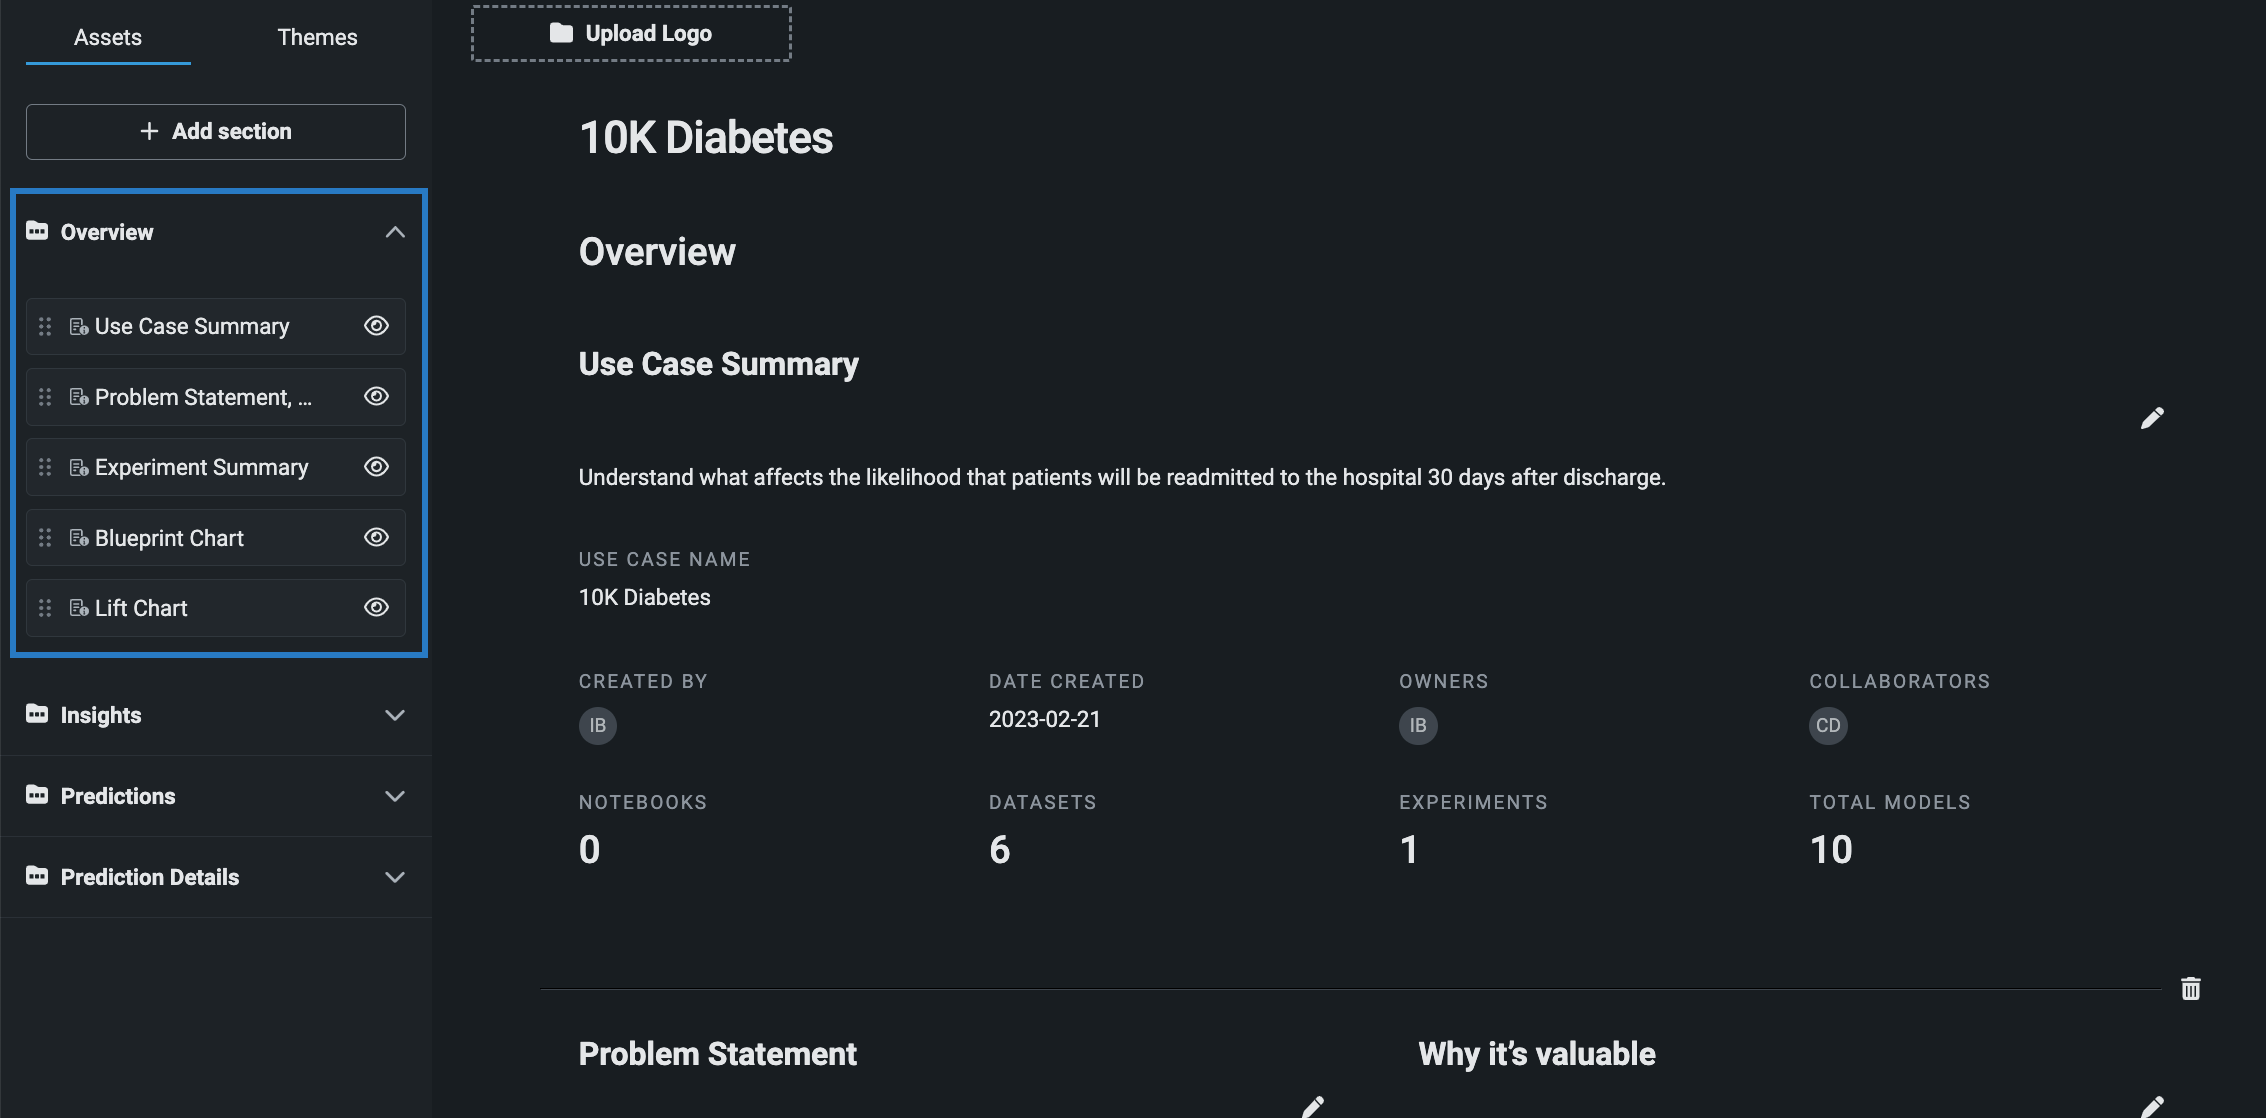
| Section | Type | Description |
|---|---|---|
| Use Case summary | Text | Displays summary information for the application's Use Case. |
| Problem statement/Why it's valuable | Text | Allows you to enter a problem statement and description of application value. |
| Experiment summary | Text | Displays summary information for the application's experiment. |
| Blueprint Chart | Visualization | Displays the blueprint of the model used to create the application. See the full documentation. |
| Lift chart | Visualization | Depicts how well a model segments the target population and how capable it is of predicting the target. See the full documentation. |
Insights
The Insights folder displays several insights (if available) for the original model that was used to create the application.
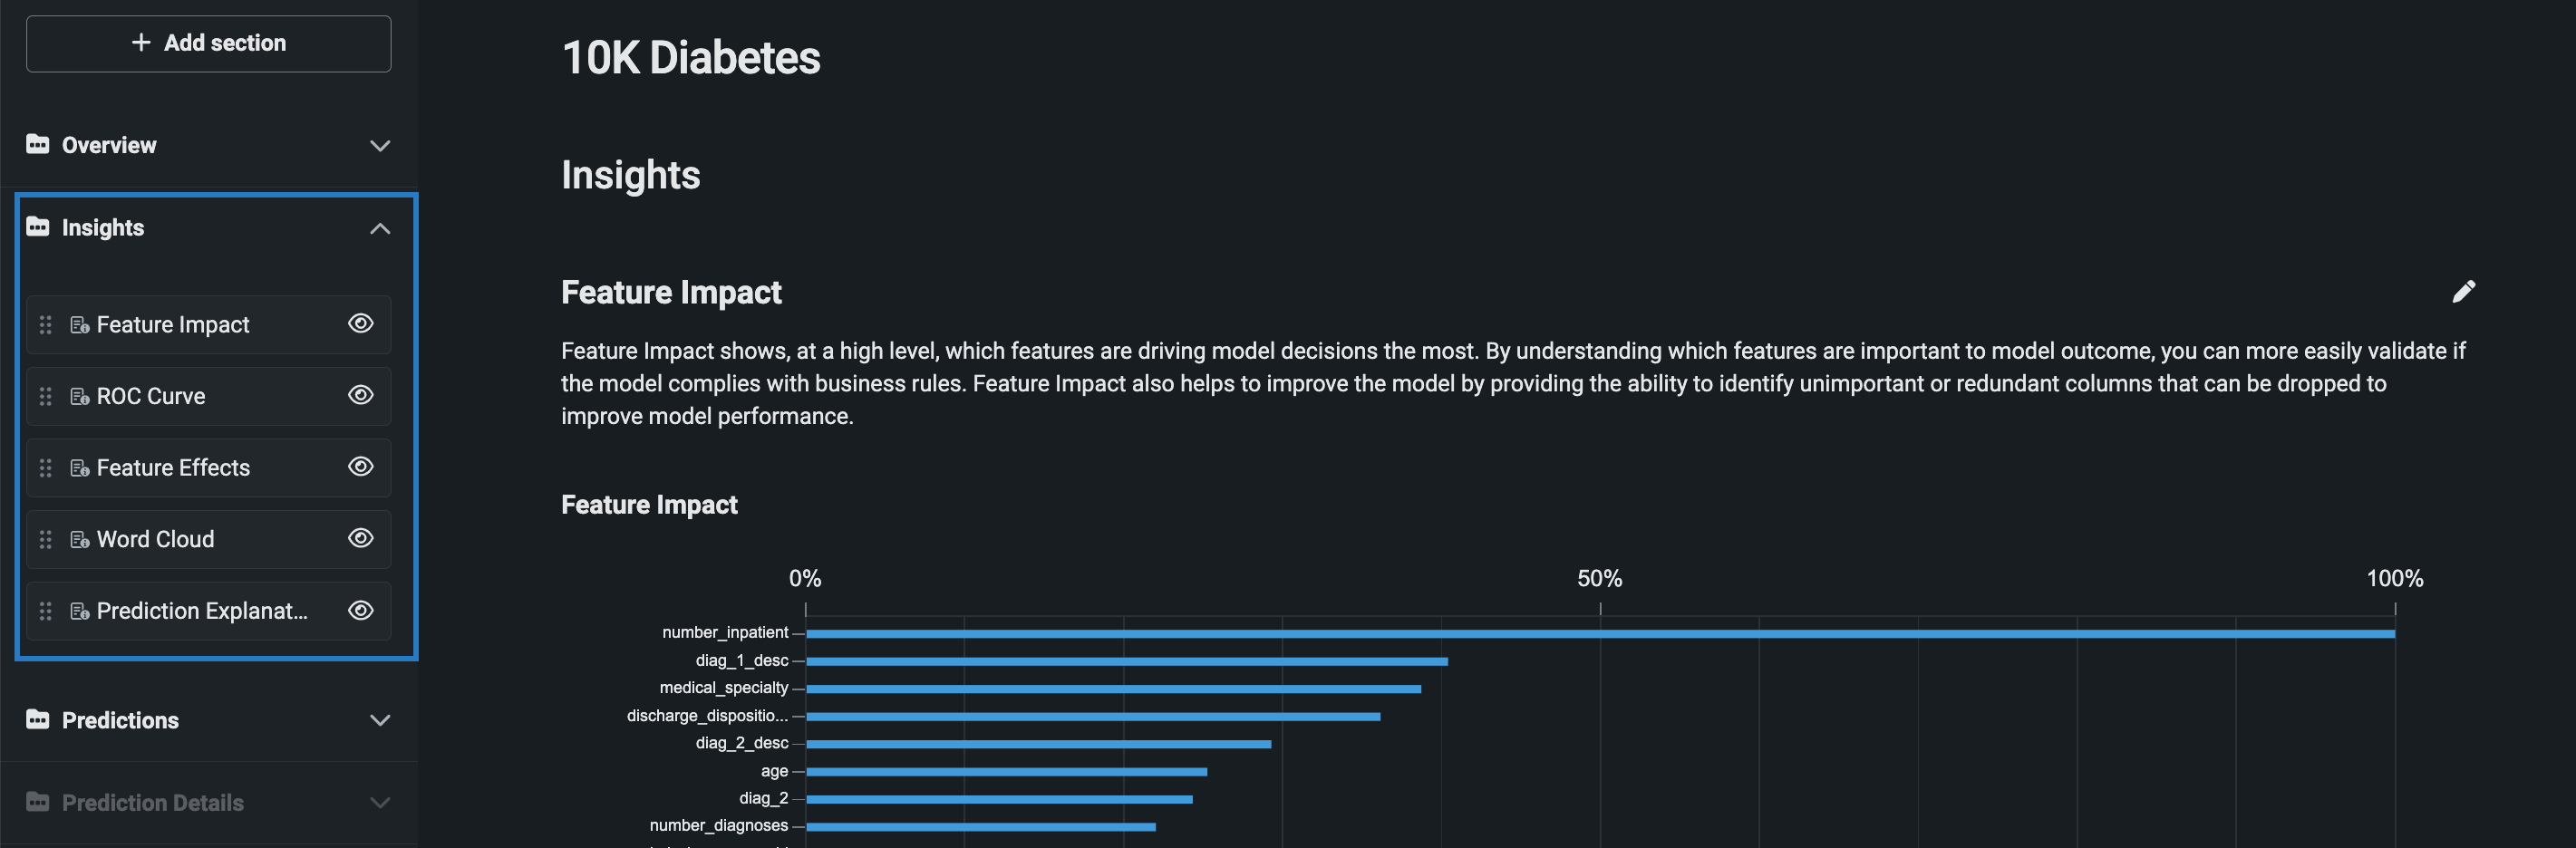
| Section | Type | Description |
|---|---|---|
| Feature Impact | Visualization | Provides a high-level visualization that identifies which features are most strongly driving model decisions. See the full documentation. |
| ROC Curve | Visualization | Provides visualizations and metrics to help you determine whether the classification performance of a particular model meets your specifications. Only available for binary classification models. See the full documentation. |
| Feature Effects | Visualization | Visualizes the effect of changes in the value of each feature on the model’s predictions. See the full documentation. |
| Word Cloud | Visualization | Displays the most relevant words and short phrases in word cloud format. See the full documentation. |
| Prediction Explanations | Visualization | Illustrates what drives predictions on a row-by-row basis—they provide a quantitative indicator of the effect variables have on the predictions, answering why a given model made a certain prediction. See the full documentation. |
Predictions
The Predictions folder allows you to make single record and batch predictions, as well as, view a history of predictions made in the application.
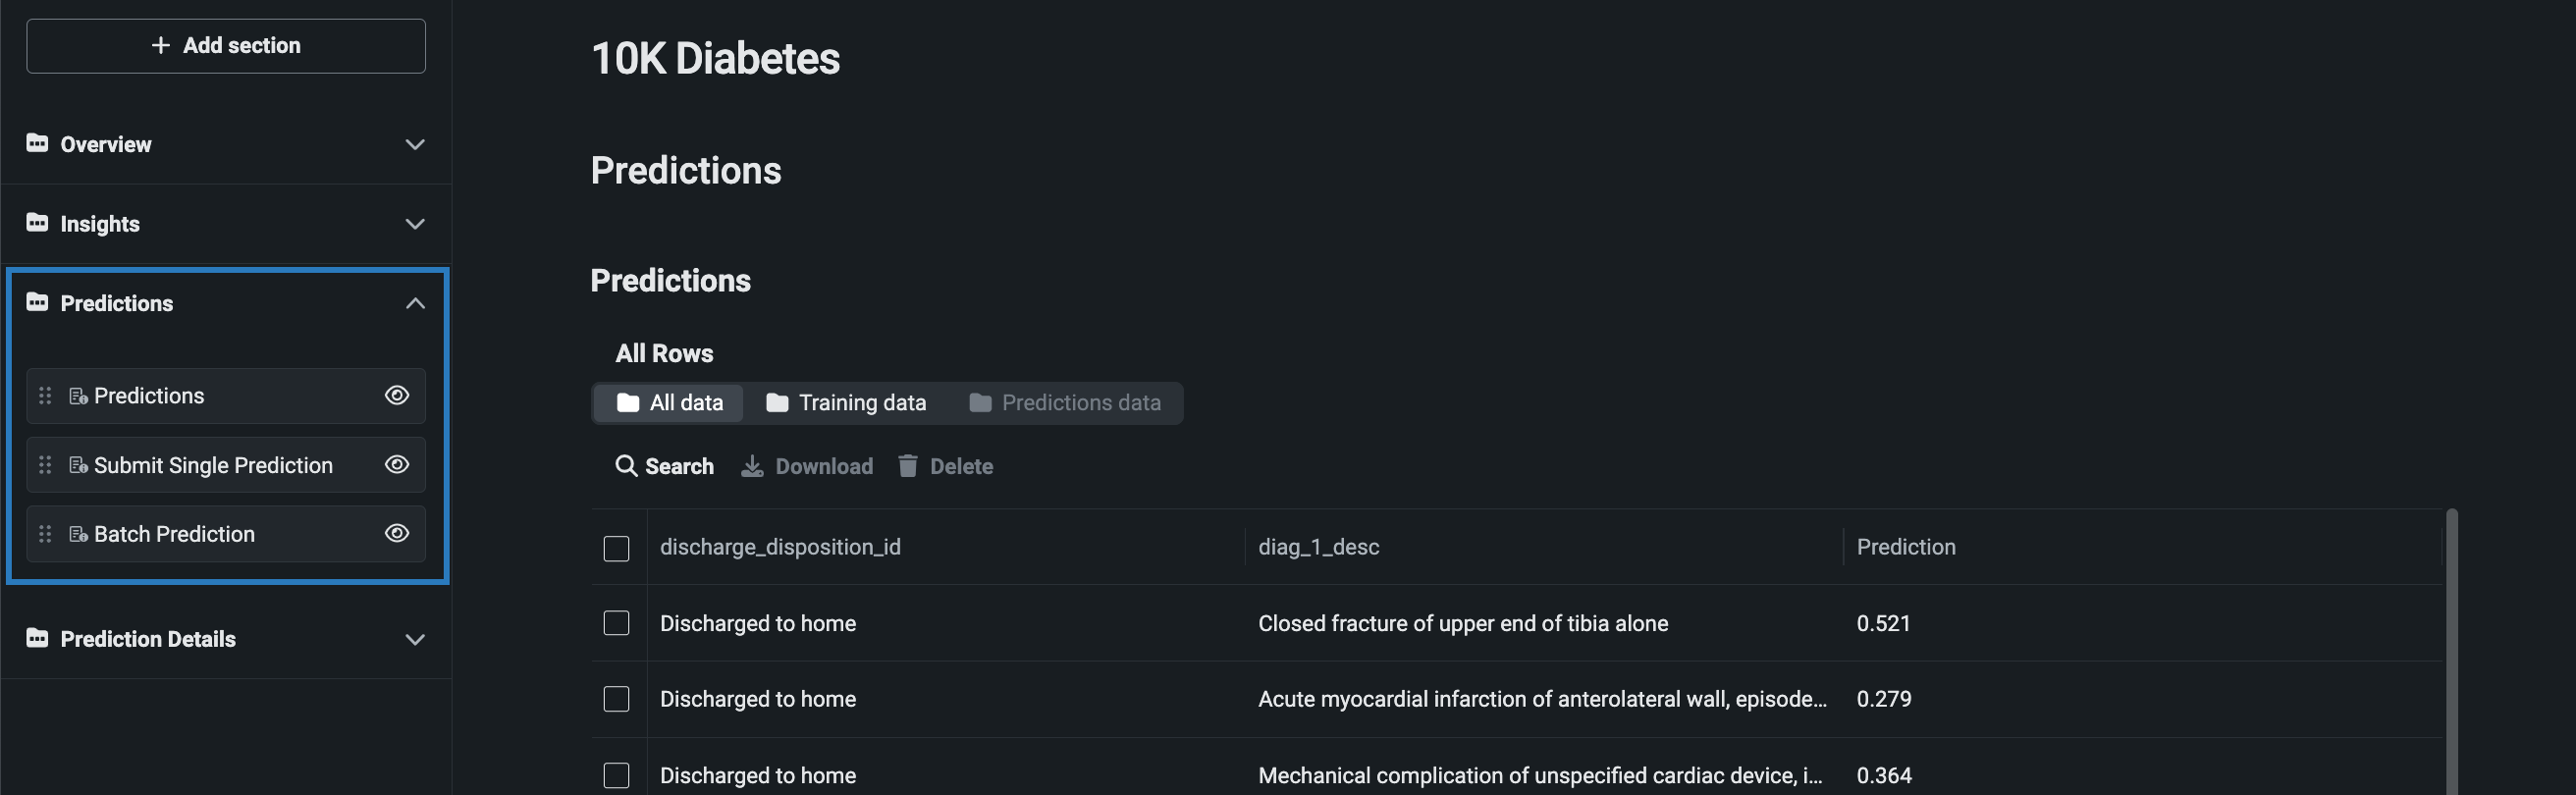
| Section | Type | Description |
|---|---|---|
| All Rows | Visualization | Displays each prediction row generated by the application. |
| Single prediction | Action | Allows you to submit single record predictions. |
| Batch prediction | Action | Allows you to upload batch prediction files. |
Make predictions
To learn how to make both single and batch predictions in an application, see the existing documentation on making applications.
Prediction Details
The Prediction Details folder displays prediction results for individual predictions. Note that this folder is disabled until the app is used to make a prediction.
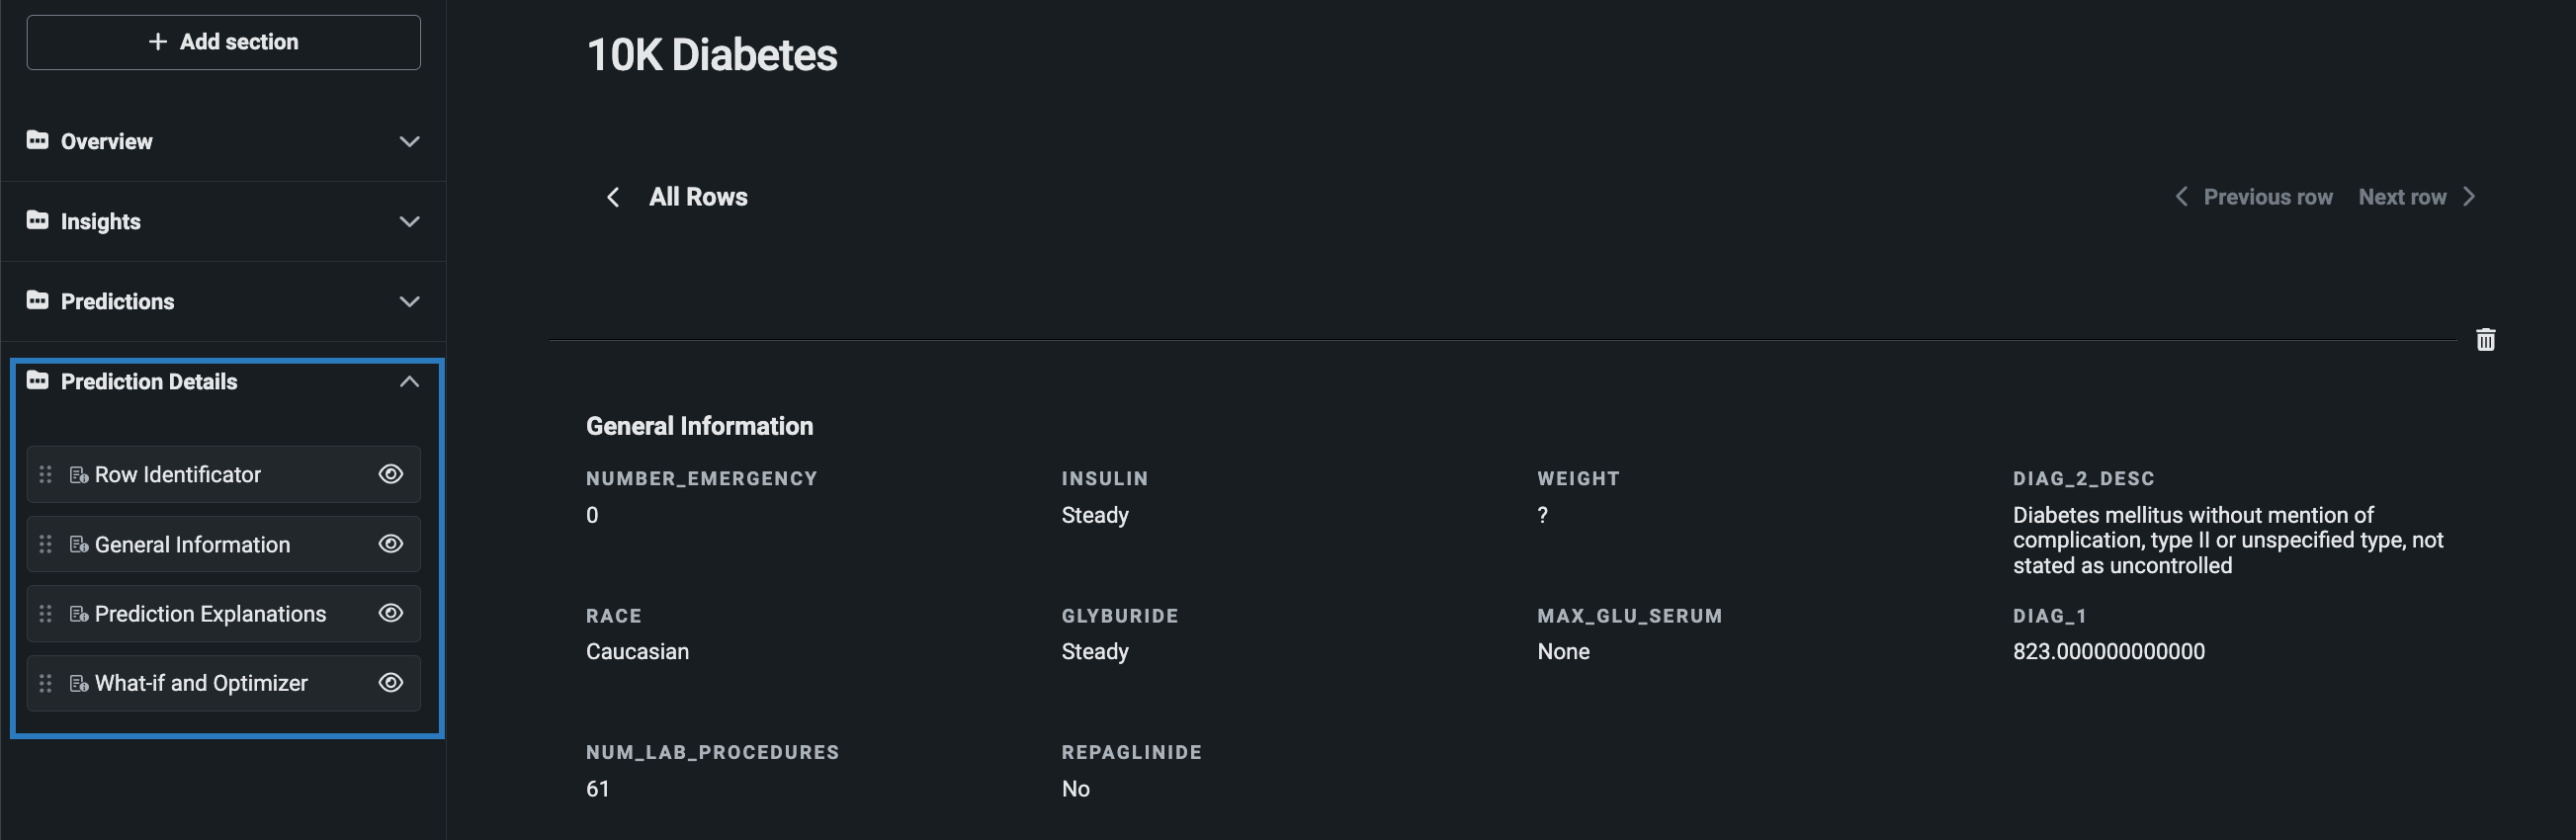
| Section | Type | Description |
|---|---|---|
| General Information | Text | Displays prediction information for the selected row. |
| Prediction Explanations | Visualization | Displays Prediction Explanations for the selected row. |
| What-if and Optimizer | Visualization / Action | Allows you to interact with prediction results using scenario comparison and optimizer tools. |
For more information, see the documentation on app prediction results and the What-if and Optimizer widget.
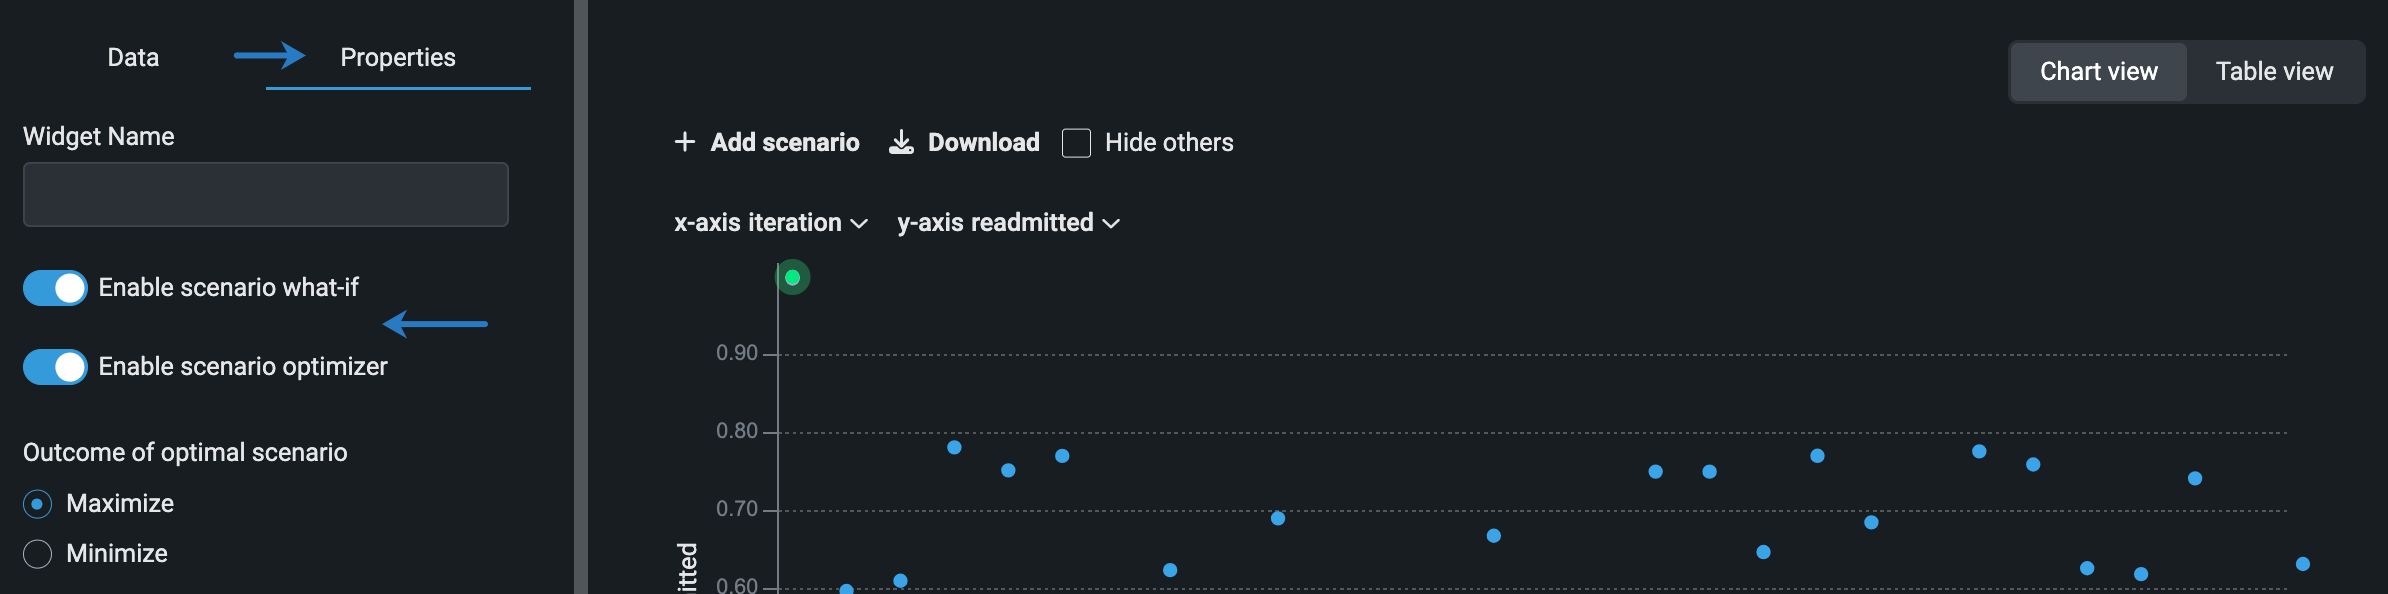
Enabling the what-if and optimizer tools
By default, only the what-if tool is enabled in the What-if and Optimizer widget. To enable the optimizer tool and/or disable the what-if tool, make sure you're in Edit mode. Hover over the widget and click the pencil icon. Open the Properties tab and use the toggles to customize the widget's functionality.
Create what-if scenarios
A decision-support tool that allows you to create and compare multiple prediction simulations to identify the option with the best outcome. You can also make a prediction, then change one or more inputs to create a new simulation, and see how those changes affect the target feature.
Learn more about using and configuring the what-if tool.
Optimize predictions
Identifies the maximum or minimum predicted value for a target or custom expression by varying the values of a selection of flexible features in the model.
Note
To view optimizations, you must open Present mode.
Learn more about using and configuring the optimizer tool.
Share
There are two ways to share applications:
- Send a shareable link to DataRobot or non-DataRobot users.
- Share the Use Case with other DataRobot users, which provides them with access to all assets contained within it.
Generate a shareable link
When using the application—in either Edit and Present mode—you can generate a shareable link. This link provides access to your application and can be shared with non-DataRobot users.
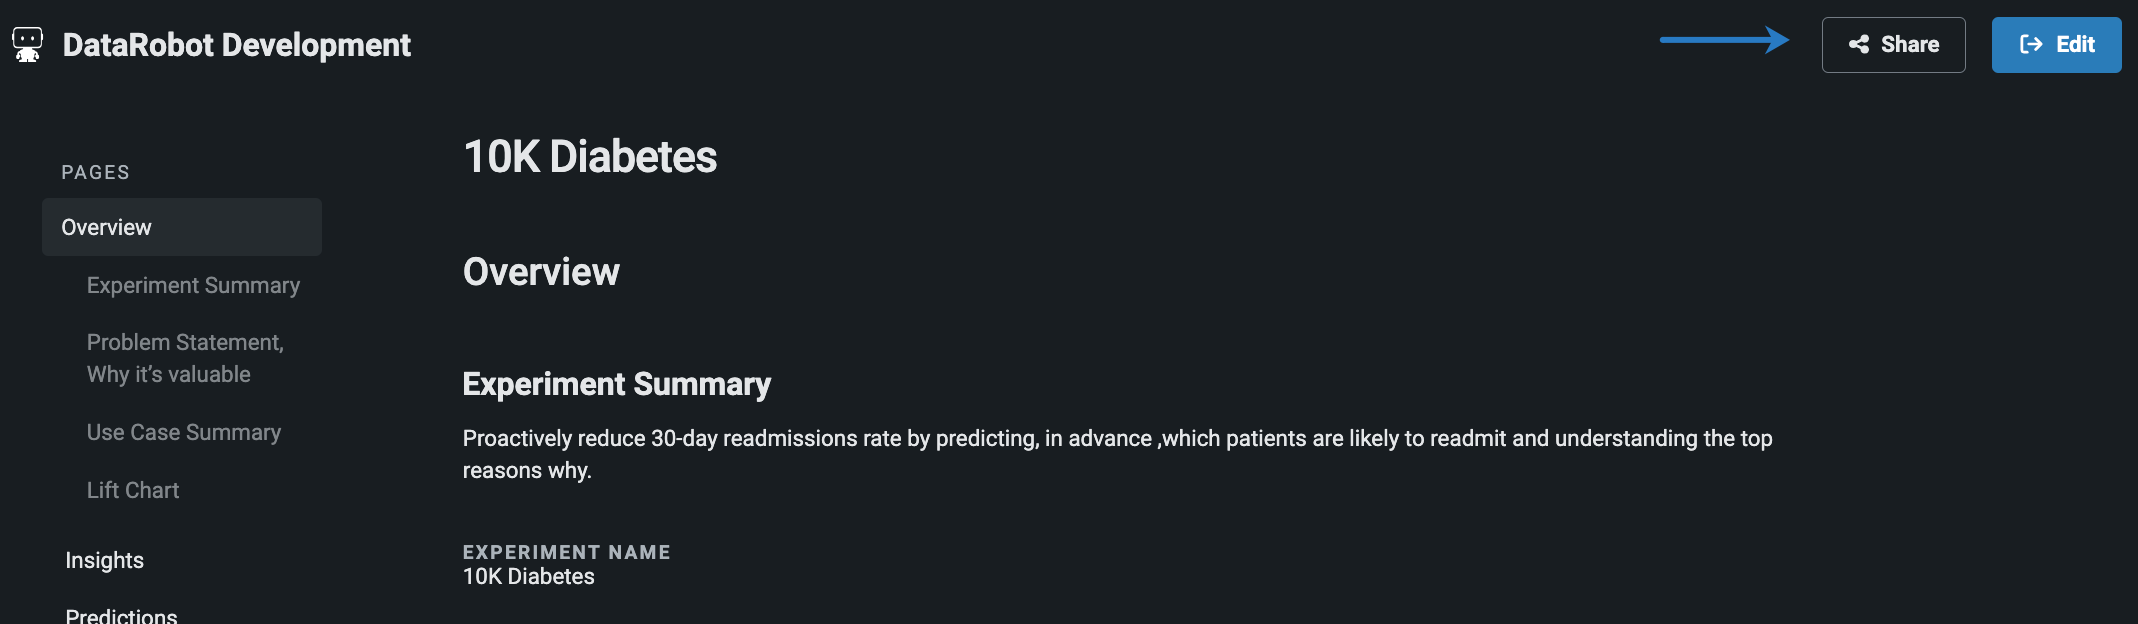
To generate a shareable link:
-
Click Share in the upper-right corner.
-
Select the box next to Grant access to anyone with this link. If this box does not have a check mark, users cannot access the application via the link.
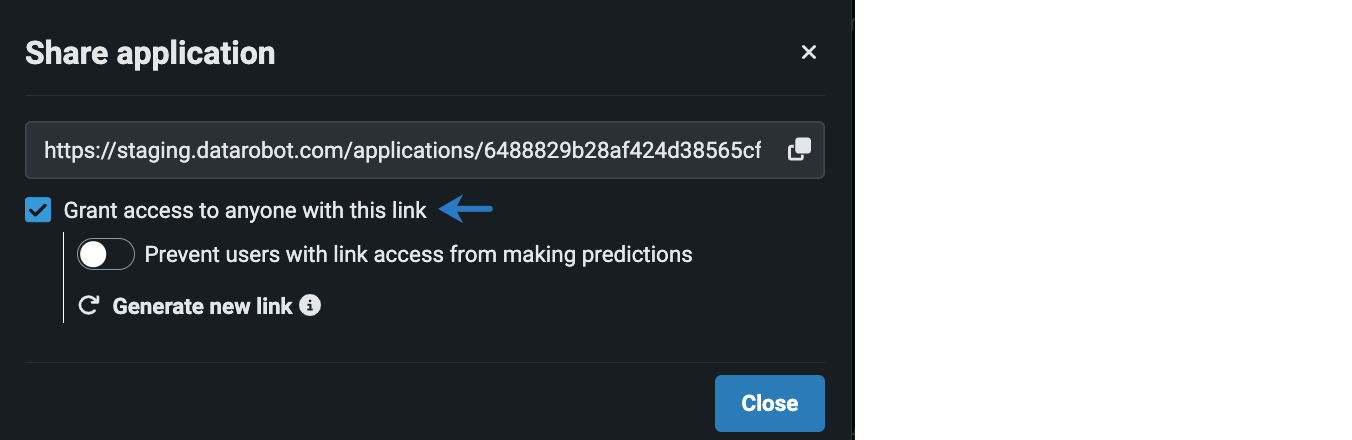
-
(Optional) Toggle Prevent users with link access from making predictions to control the ability for recipients to make predictions in the app.
Generate a new link
If you click Generate a new link, all users with the older link will no longer have access to the app— you must send a new link to grant access.