Manage the Leaderboard
Once you start modeling, Workbench begins to construct your model Leaderboard, a list of models ranked by performance, to help with quick model evaluation. The Leaderboard provides a summary of information, including scoring information, for each model built in an experiment. From the Leaderboard, you can click a model to access visualizations for further exploration. Using these tools can help to assess what to do in your next experiment.
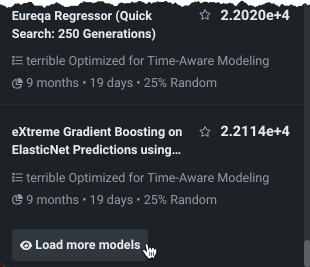
DataRobot populates the Leaderboard as it builds, initially displaying up to 50 models. Click Load more models to load 50 more models with each click.
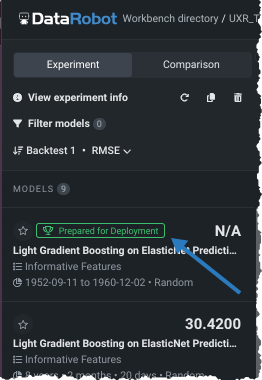
After Workbench completes Quick mode on the 64% sample size phase, the most accurate model is selected and trained on 100% of the data. That model is marked with the Prepared for Deployment badge.
Why isn't the prepared for deployment model at the top of the Leaderboard?
When Workbench prepares a model for deployment, it trains the model on 100% of the data. While the most accurate was selected to be prepared, it was selected based on a 64% sample size. As a part of preparing the most accurate model for deployment, Workbench unlocks Holdout, resulting in the prepared model being trained on different data from the original. If you do not change the Leaderboard to sort by Holdout, the validation score in the left bar can make it appear as if the prepared model is not the most accurate.
This page describes the summary information available for models and experiments as well as the controls available for working with the Leaderboard model listing:
- View model information
- View experiment information
- Filter models
- Sort models
- Shorthand controls
- Manage experiments from the Use Case directory
Model information
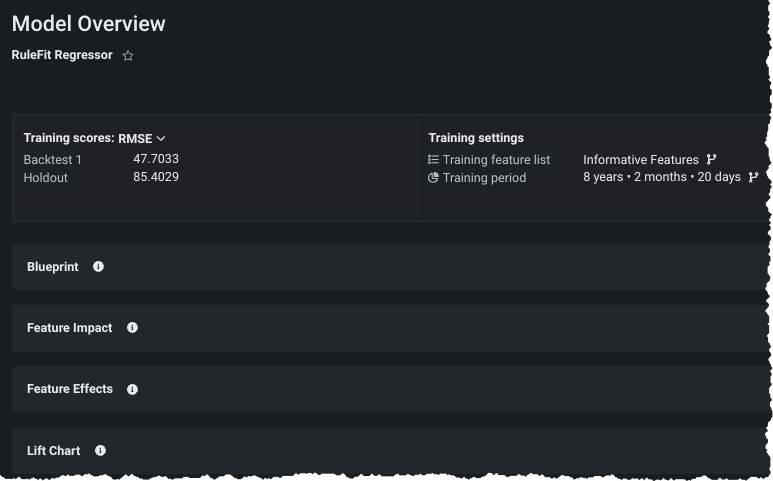
As soon as a model completes, you can select it from the Leaderboard listing to open the Model Overview where you can:
- See specific details about training scores and settings.
- Retrain models on new feature lists or sample sizes. Note that you cannot change the feature list on the model prepared for deployment as it is "frozen".
- Access model insights.
Model build failure
If a model failed to build, you will see that in the job queue as Autopilot runs. Once it completes, the model(s) are still listed in the Leaderboard but the entry indicates the failure. Click the model to display a log of issues that resulted in failure.
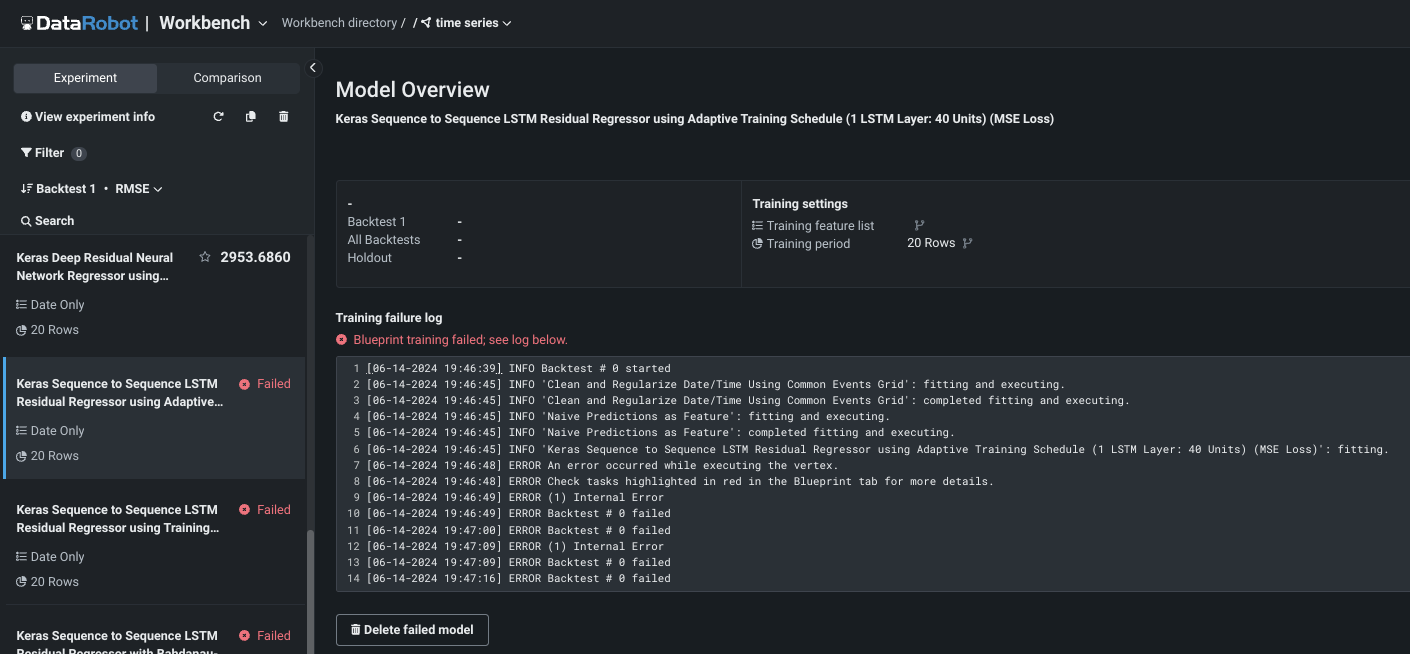
Use the Delete failed model button to remove the model from the Leaderbaord.
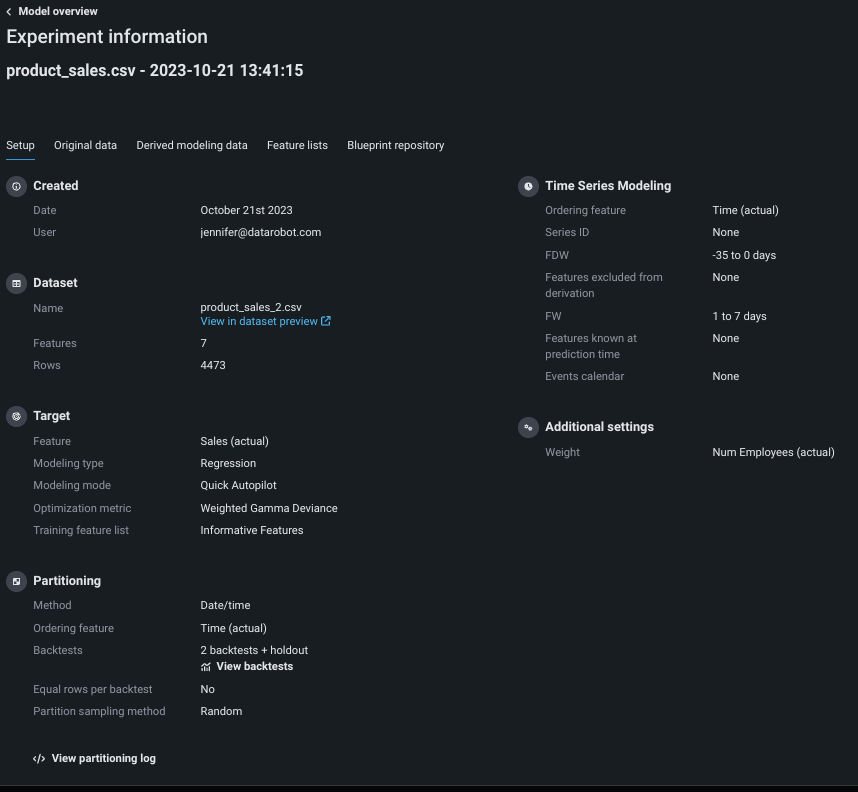
View experiment info
Click View experiment info to access the following tabs:
| Tab | Description |
|---|---|
| Setup | Provides summary information about the experiment. |
| Original data | Displays the data available for model training, filterable by the contents of a selected feature list. |
| Derived modeling data | Displays the data used for model training, after the feature derivation process was applied, filterable by the contents of any applicable feature list. |
| Feature lists | Provides tools to view and create feature lists; all lists are comprised exclusively of derived modeling data. |
| Blueprint repository | Provides access to additional blueprints for training. |
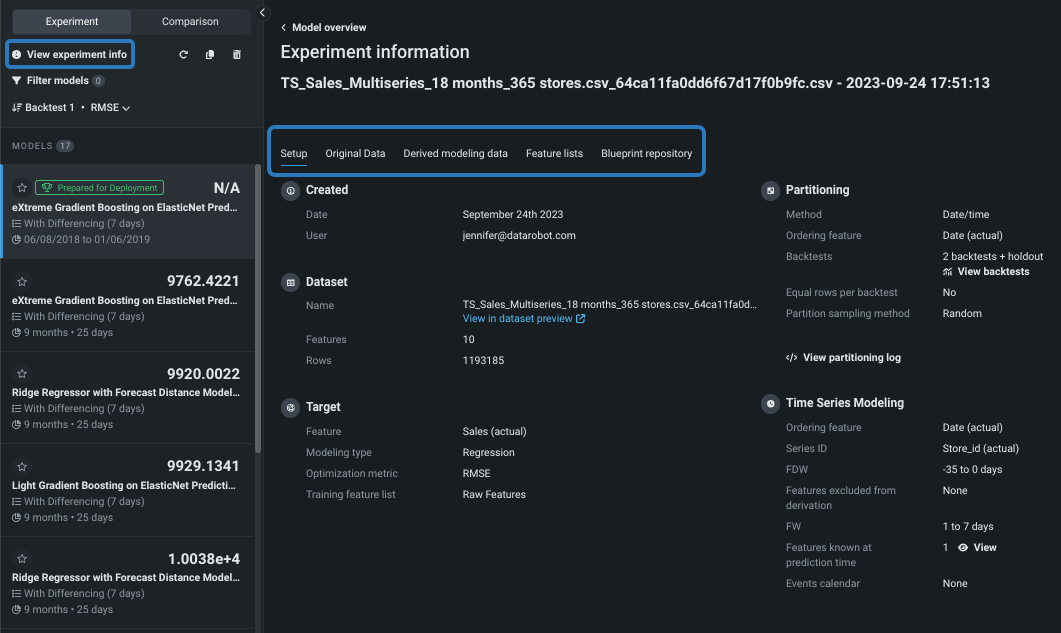
Setup tab
The Setup tab reports the parameters used to build the models on the Leaderboard.
| Field | Reports... |
|---|---|
| Created | A time stamp indicating the creation date of the experiment as well as the user who initiated the model run. |
| Dataset | The name, number of features, and number of rows in the modeling dataset. This is the same information available from the data preview page. |
| Target | The feature selected as the basis for predictions, the resulting experiment type, and the optimization metric used to define how to score the experiment's models. You can change the metric the Leaderboard is sorted by, but the metric displayed in the summary is the one used for the build. |
| Partitioning | Details of the date/time partitioning done for the experiment, including the ordering feature, backtest setting, and sampling method. It also provides a backtest summary and partitioning log, described in more detail below. |
| Time series modeling | Details of the time series modeling setup including ordering, series, excluded, and known in advance features, as well as window settings and events calendar information. |
| Additional settings | Advanced settings that were configured from the Additional settings tab. |
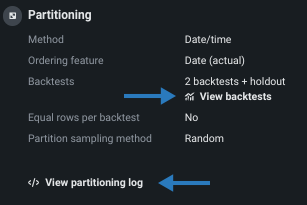
Partitioning details
The partitioning section's backtest summary and derivation log provide insight into how DataRobot handled the data in preparation for modeling.
-
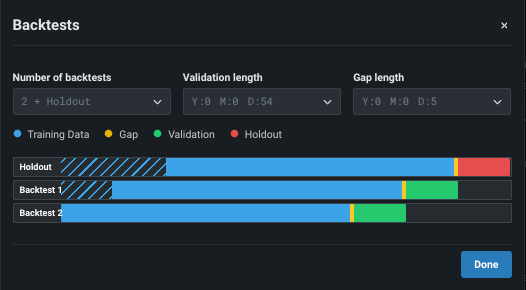
Click View backtests for a visual summary of the observations and testing partitions used to build the model. You cannot change the partitions from this window, but you can make modifications to retrain the model from the Model Overview.
-
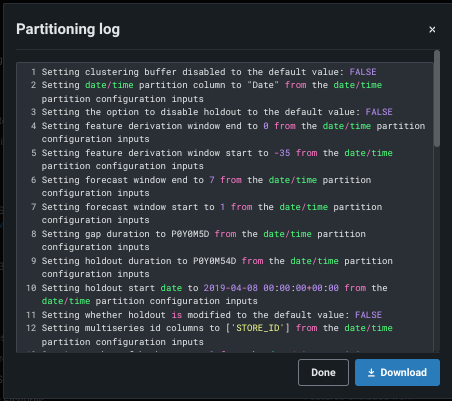
Click View partitioning log to see (and optionally export) a record of how DataRobot created backtests, assigned data based on window settings, and applied other setup criteria.
Original data tab
The Original data tab provides summary analytics of the data used in the experiment setup. To view exploratory data insights, click the dataset preview link.
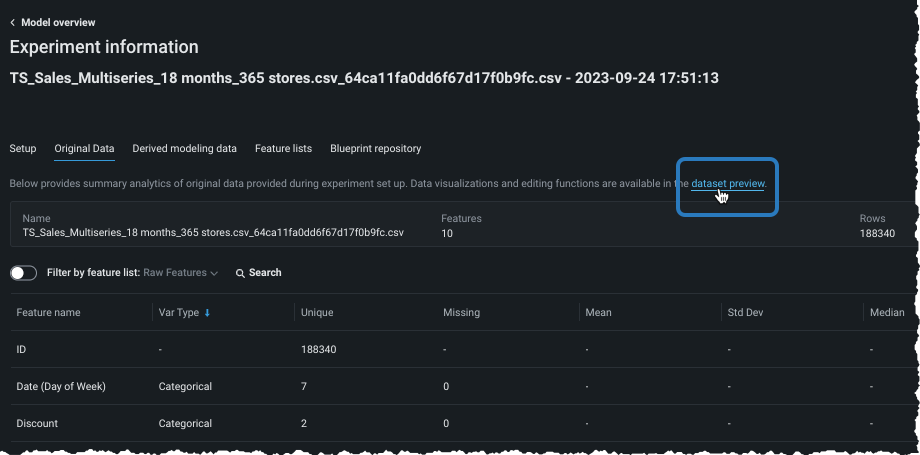
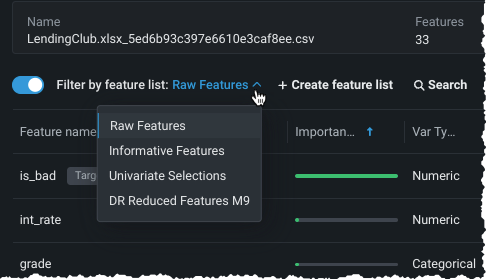
By default, the display includes all features in the dataset prior to feature derivation. You can view analytics for features specific to a single feature list by enabling Filter by feature list and selecting a list.
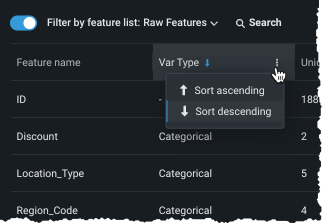
When viewing the list, you can click on the arrow or more info next to a column name to change the sort order.
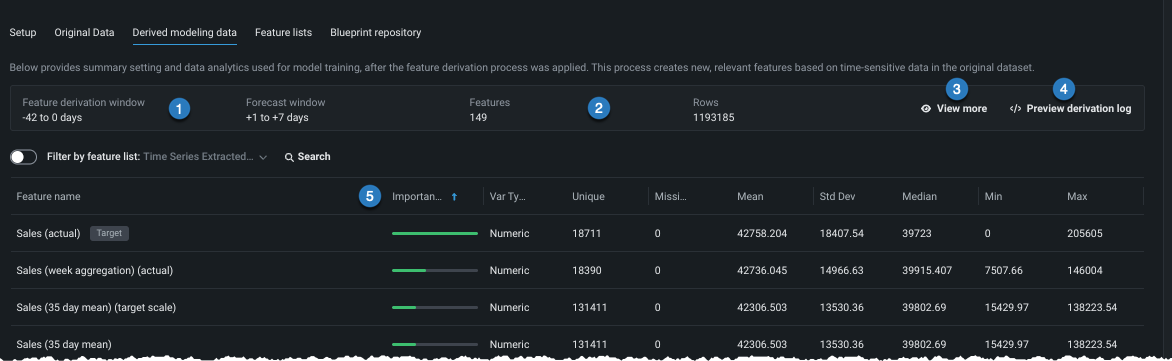
Derived modeling data tab
The Derived modeling data tab is populated after the feature derivation process runs. It shows basic data analytics as well as information that is not available in the Original data tab. Use the Filter by feature list toggle, described in the Original data section, to update the display. Values update to the selected list, as applicable.
| Element | Description | |
|---|---|---|
| 1 | Window setting summaries | Summarizes the FDW and FW used in model training. |
| 2 | Basic counts | Reports the number of features and rows in the selected list. |
| 3 | View more | Shows additional time series-specific experiment setup settings. |
| 4 | Preview derivation log | Shows the first 100 lines of a log that records the feature derivation and reduction process and provides an option to download the full log. |
| 5 | Importance score | Indicates the degree to which a feature is correlated with the target. |
Identify target leakage
When EDA2 is calculated, DataRobot checks for target leakage, which refers to a feature whose value cannot be known at the time of prediction, leading to overly optimistic models. A badge is displayed next to these features so that you can easily identify and exclude them from any new feature lists.
![]()
Feature lists tab
DataRobot automatically constructs time-aware features based on the characteristics of the data. Multiple periodicities can result in several possibilities when constructing the features and, in some cases, it is better to not transform the target by differencing. The choice that yields the optimal accuracy often depends on the data.
After constructing time series features for the data, DataRobot automatically creates multiple lists of features that are used to build models. Then, when experiment building begins, DataRobot automatically runs blueprints using several feature lists, selecting the list that best suits the model type.
Click the Feature lists tab to view all feature lists associated with the experiment. The display shows both DataRobot's automatically created time series feature lists and any custom feature lists that were created prior to model training.
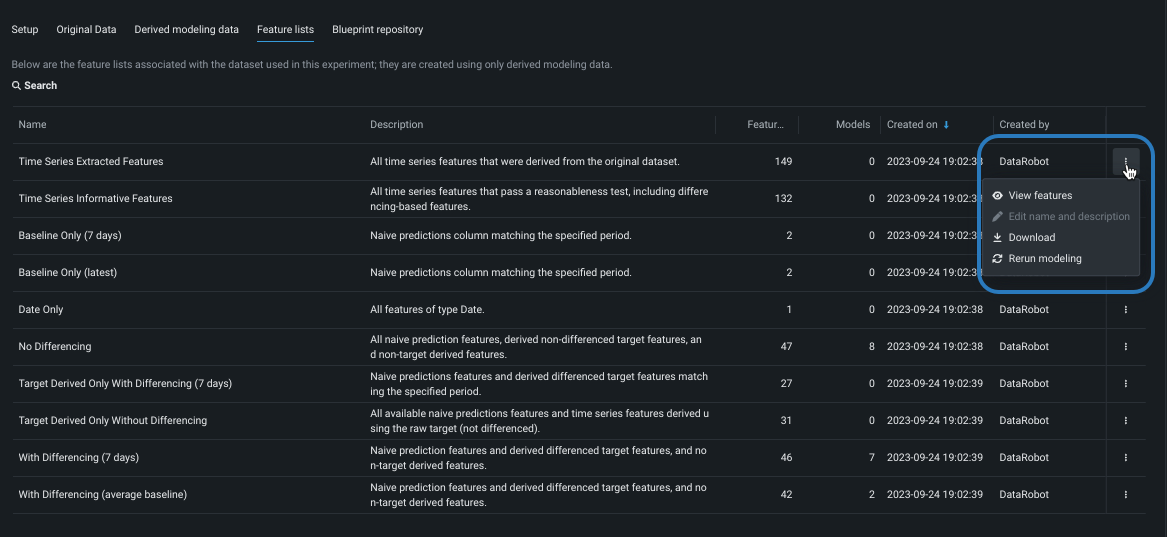
The following actions are available for feature lists from the actions menu to the right of the Created by column:
| Action | Description |
|---|---|
| View features | Displays insights for a feature list. This selection opens the Data tab with the filter set to the selected list. |
| Edit name and description | (Custom lists only) Opens a dialog to change the list name and change or add a description. |
| Download | Downloads the features contained in that list as a CSV file. |
| Rerun modeling | Opens the Rerun modeling modal to allow selecting a new feature list and restarting Autopilot. |
| Delete | (Custom lists only) Permanently deletes the selected list from the experiment. |
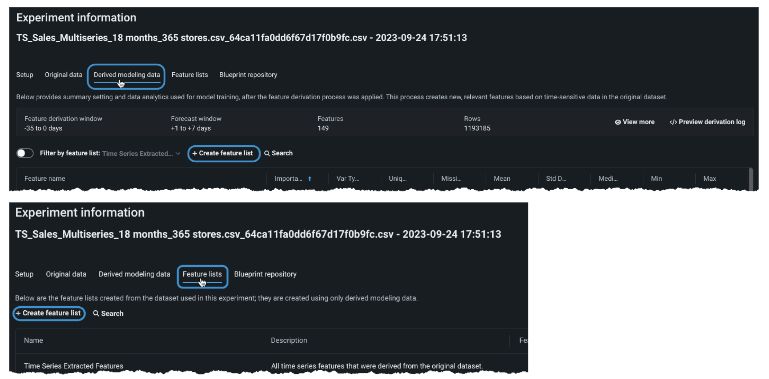
Custom feature lists can be created prior to modeling from the data explorer or after modeling from the Derived modeling data or Feature lists tabs, as described below.
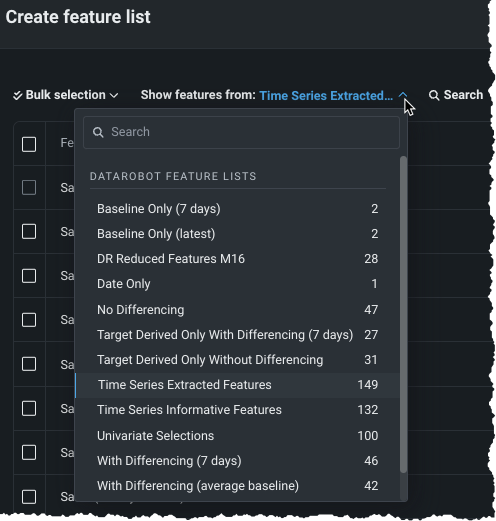
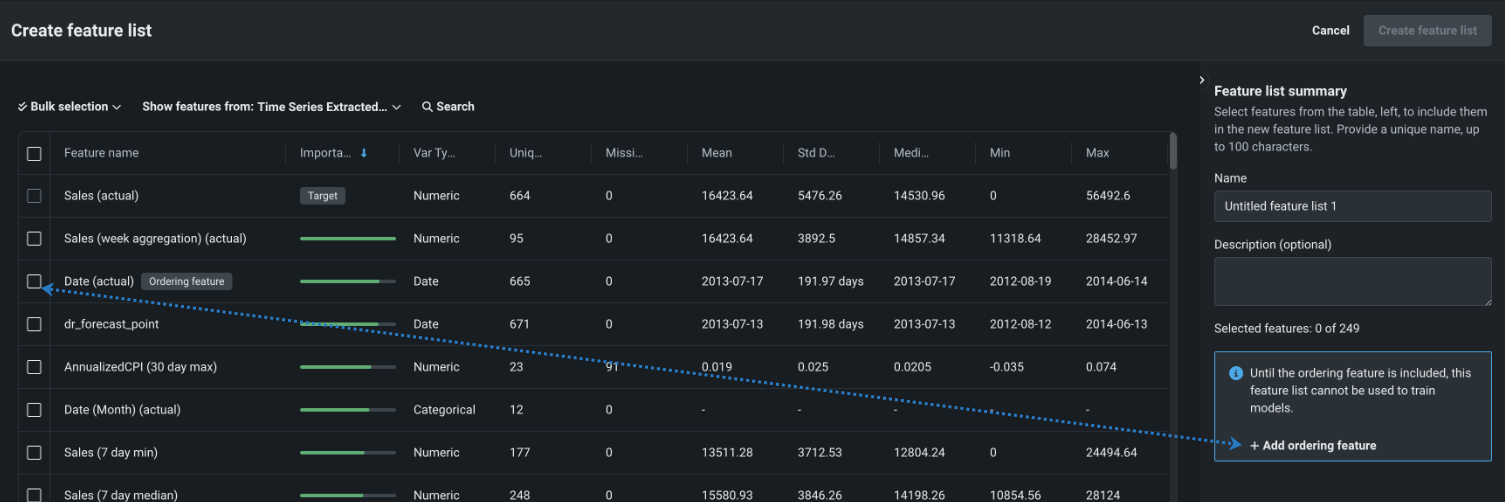
Create feature list
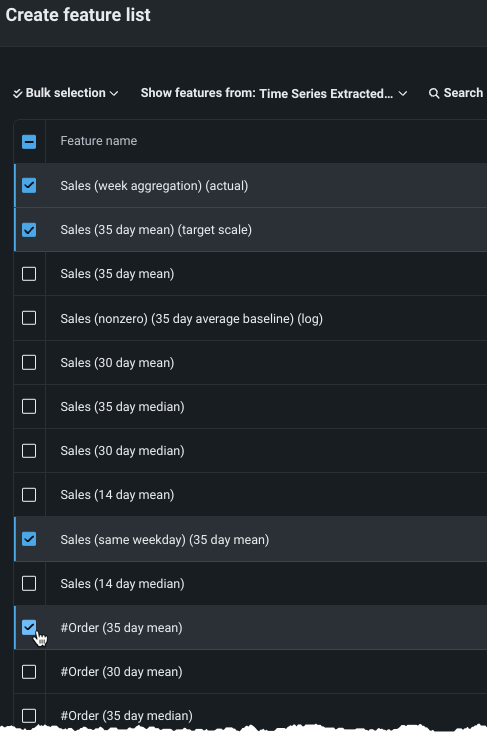
To create a custom feature list, select features individually or use bulk actions. Use the checkbox to the left of the Feature name column to add or clear selections.
Note
You must include the ordering feature when creating feature lists for time series model training. The ordering feature is not required if the list is not used directly for training, such as monotonic constraint lists.
To select features individually:
-
From the Derived modeling data or Feature lists tab, select + Create feature list.
-
Use the Show features from dropdown to change the displayed features that are available for selection. The default display list features from the Time Series Extracted Features list. All automatically generated and custom lists are available from the dropdown.
-
(Optional) If you are using the new feature list to train models, you must add the ordering feature by clicking + Add ordering feature or selecting the checkbox to the left of the feature.
-
Select the box next to each feature you want to include.
-
(Optional) Use the search field to update the display to show only those features, within the Show features from selection, that match the search string.
Bulk feature list actions
To add multiple features at a time, choose a method from the Bulk selection dropdown:
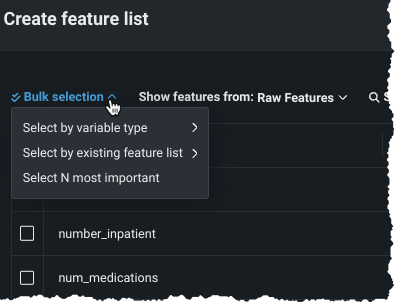
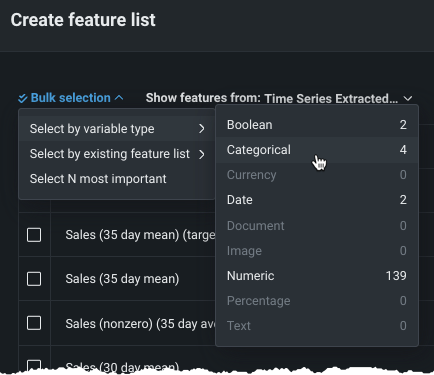
Use Select by variable type to create a list containing all features from the dataset that are of the selected variable type. While you can only select one variable type, you can individually add any other features (of any type), after selection.
Use Select by existing feature list to add all features in the chosen list.
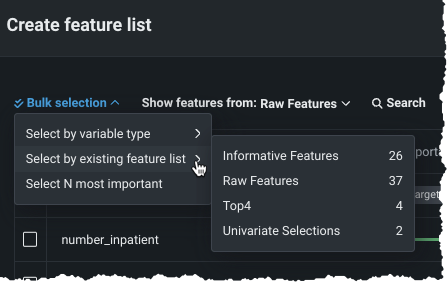
Note that the bulk actions are secondary to the Show features from dropdown. For example, showing features from a custom "Top6" list shows the six features added in your custom list. If you then use Select by existing feature list > Time Series Informative Features, all features in "Top6" that are also in "Time Series Informative features" are selected. Conversely, if you show informative features and select by "Top6" feature list, those six features are selected.
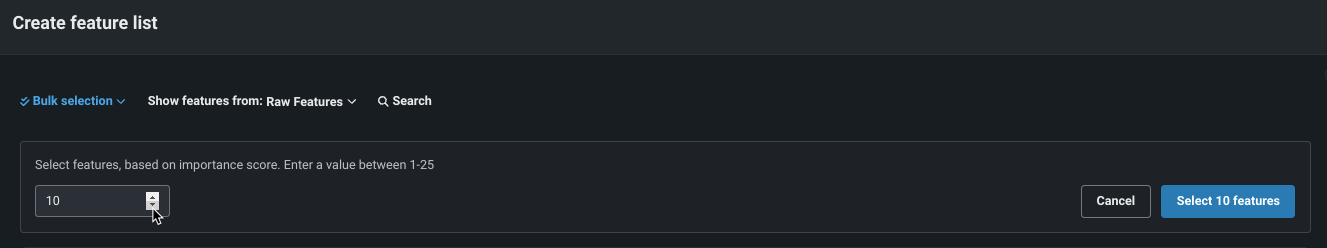
Use Select N most important" to add the specified number of "most important" features from the features available in the list select in the Show features from dropdown. The importance score indicates the degree to which a feature is correlated with the target—representing a measure of predictive power if you were to use only that variable to predict the target.
Save feature list
Once all features for the list are selected, optionally rename the list and provide a description in the Feature list summary. The summary also provides the count and type of features included in the list.
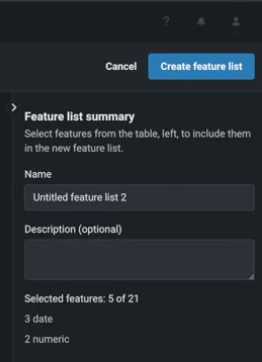
Then, click Create feature list to save the information. The new list will display in the listing on the Feature lists tab.
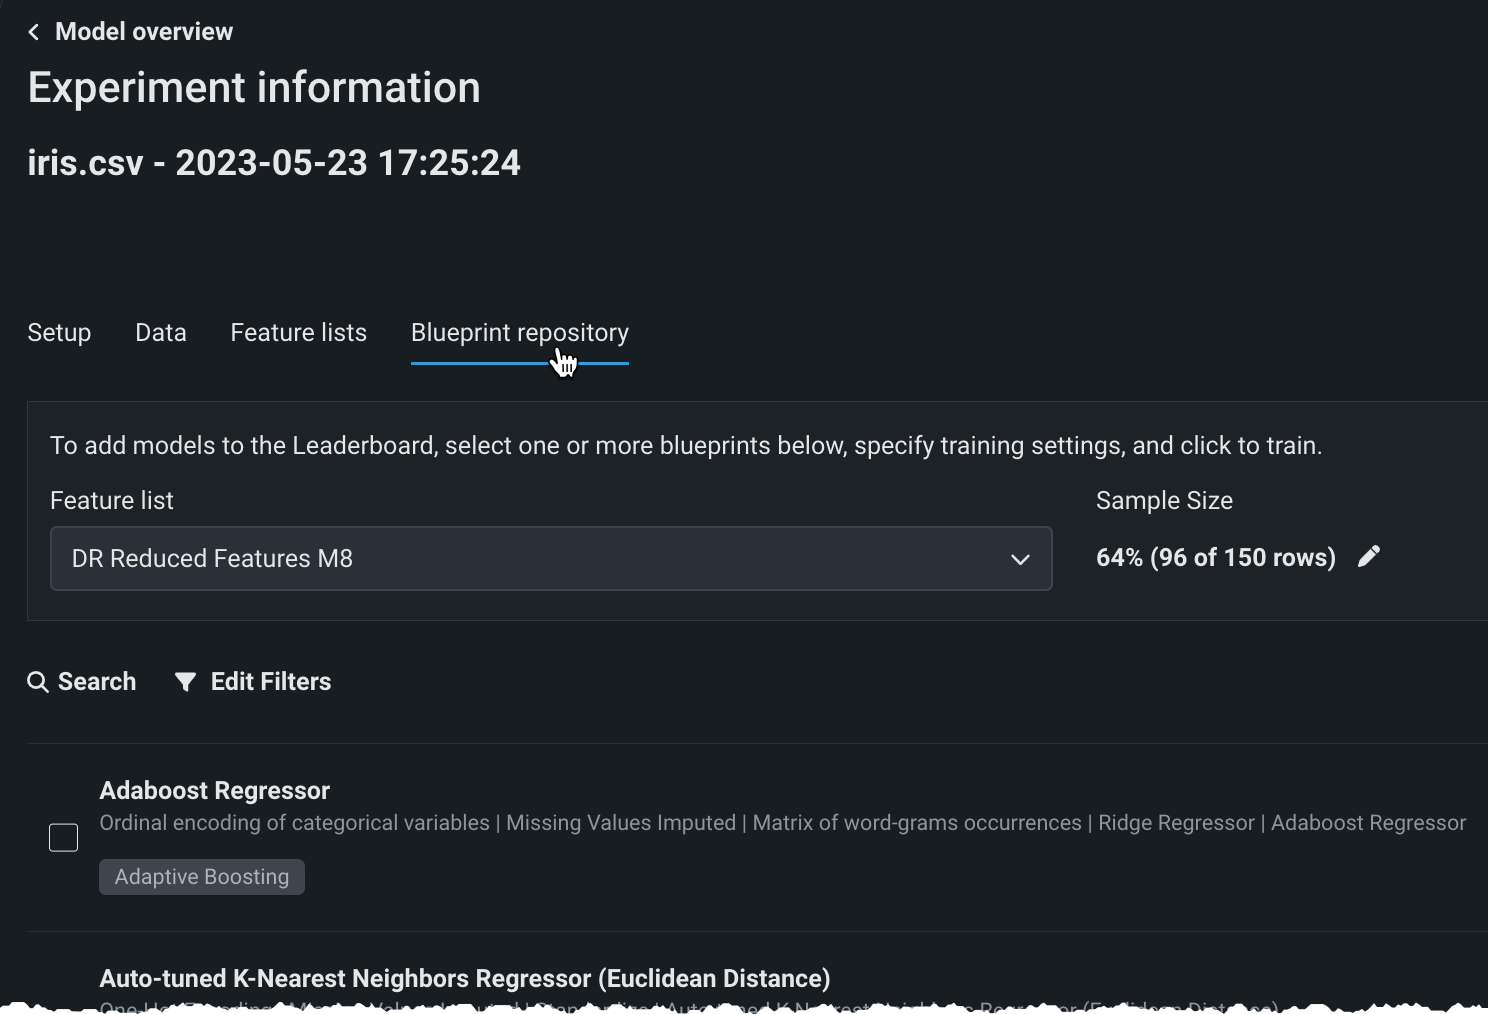
Blueprint repository tab
The blueprint repository is a library of modeling blueprints available for a selected experiment. Blueprints illustrate the tasks used to build a model, not the model itself. Model blueprints listed in the repository have not necessarily been built yet, but could be as they are of a type that is compatible with the experiment's data and settings.
There are two ways to access the blueprint repository:
-
From a Leaderboard model's Blueprint tab.
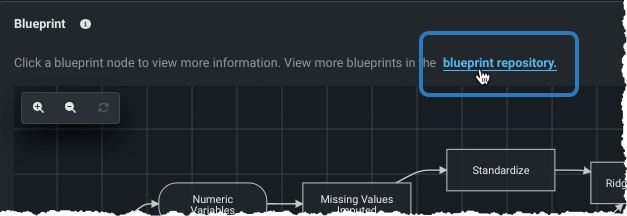
-
Click the View experiment info link and select the Blueprint repository tab.
Filter models
Filtering makes viewing and focusing on relevant models easier. Click Filter models to set the criteria for the models that Workbench displays on the Leaderboard. The choices available for each filter are dependent on the experiment and/or model type and will potentially change as models are added to the experiment. For example:
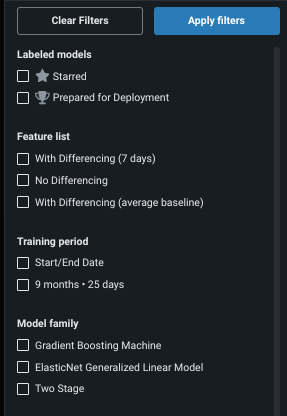
| Filter | Displays models that... |
|---|---|
| Labeled models | Have been assigned the listed tag, either starred models or models recommended for deployment. |
| Feature list | Were built with the selected feature list. |
| Training period | Were trained on the selected training period, either a specific duration or start/end dates. |
| Model family | Are part of the selected model family. |
Sort models by
By default, the Leaderboard sorts models based on the score of the validation partition, using the selected optimization metric. You can, however, control the basis of the display parameter when evaluating models.
Note that although Workbench built the experiment using the most appropriate metric for your data, it computes many applicable metrics on each of the models. After the build completes, you can redisplay the Leaderboard listing based on a different metric. It doesn't change any values within the models; it simply reorders the model listing based on model performance in this alternate metric.
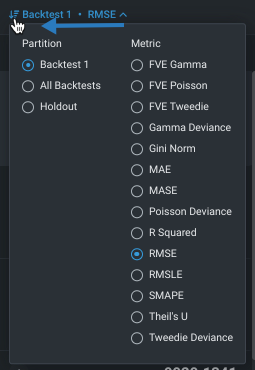
See the page on optimization metrics for detailed information on each.
Controls
Workbench provides simple, quick shorthand controls:
| Icon | Action |
|---|---|
| Reruns Quick mode with a different feature list. If you select a feature list that has already run, Workbench replaces the deleted models or make no changes. | |
| Duplicates the experiment with an option to reuse just the dataset, or the dataset and settings. | |
| Deletes the experiment and its models. If the experiment is being used by an application, you cannot delete it. | |
| Slides the Leaderboard panel closed to make additional room for, for example, viewing insights. |
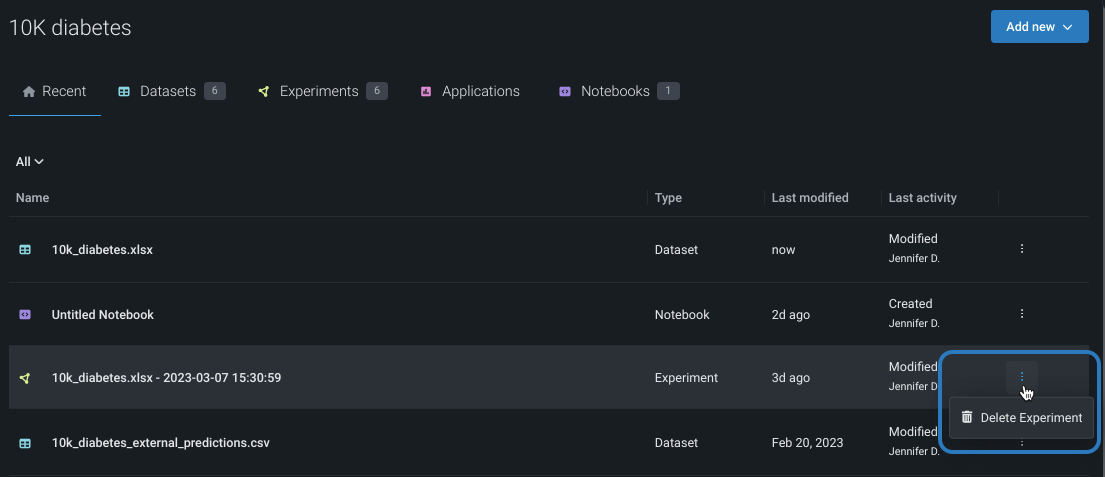
Manage experiments
At any point after models have been built, you can manage an individual experiment from within its Use Case. Click the Actions menu to the right of the experiment name to delete it. To share the experiment, use the Use Case Manage members tool to share the experiment and other associated assets.
What's next?
After selecting a model, you can, from within the experiment: