Lift Chart
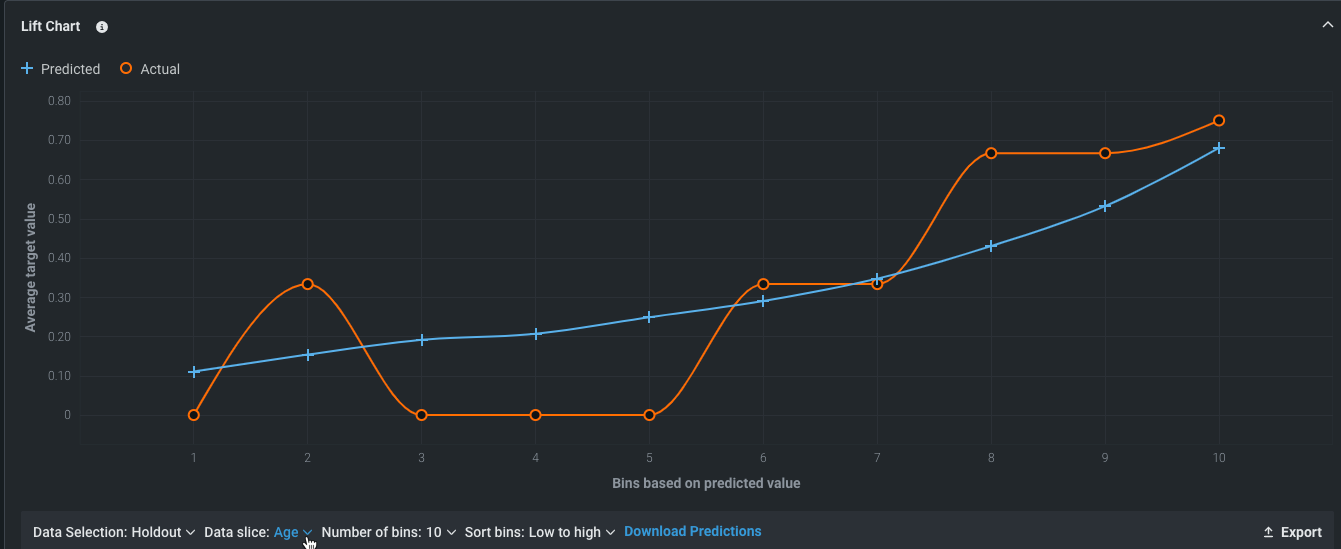
To help visualize model effectiveness, the Lift Chart depicts how well a model segments the target population and how well the model performs for different ranges of values of the target variable.
- Hover on any point to display the predicted and actual scores for rows in that bin.
- Use the controls to change the criteria for the display.
Updated June 21, 2024
Was this page helpful?
Great! Let us know what you found helpful.
What can we do to improve the content?
Thanks for your feedback!